


TradingView
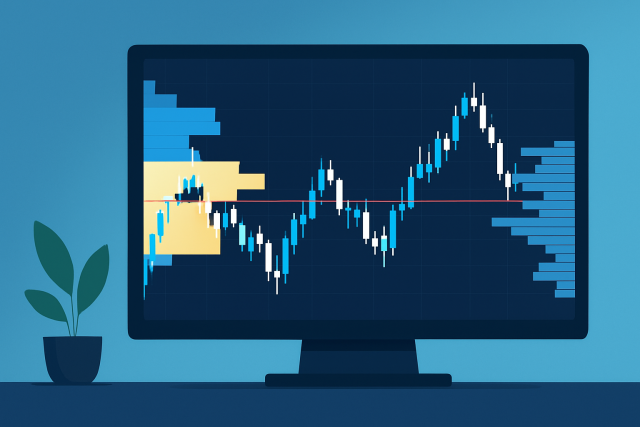
How to Read TradingView Profiler for Better Decisions
Unlock the power of the TradingView Profiler with this guide that breaks down volume profile reading...
Catching market trends early is absolutely important for traders who want to bump up their profits without letting risks get out of hand. We dive into some of the top TradingView indicators that both seasoned pros and everyday retail traders swear by to spot trends swiftly and with pinpoint accuracy.
We zeroed in on a handful of key factors to ensure we recommend only the most trustworthy and effective indicators. Each one was put under the microscope for how well it spots trends and how user-friendly it is. We also looked at the range of customization options it offers, its popularity within the TradingView community, and how seamlessly it plays with TradingView's platform.
Moving Averages are like your trusty weather vane in the stormy market winds—helping you spot trends without getting lost in the noise. They smooth out those wild price swings to give you a clearer view, almost like drawing a gentle curve through a hectic scatterplot. Whether you lean toward the simple or the exponential kind, MAs offer a straightforward way to gauge momentum and spot potential reversals, making them a favorite go-to for traders who appreciate a bit of calm in the chaos.
Moving Averages are great at smoothing out wild price swings and making the main trend easier on the eyes. The two classics you will hear about most often are Simple Moving Averages and Exponential Moving Averages. They act as trusty guides for traders by helping them catch bullish or bearish momentum through price crossovers and the direction of the moving average line.
The Average Directional Index (ADX) is a handy little tool that measures how strong a trend is without revealing its direction. On TradingView, readings above 25 often point to a robust trend whether it’s climbing up or sliding down. Many traders pair the ADX with other indicators like Moving Averages or the MACD to double-check how solid that trend really is before pulling the trigger. Since the ADX filters out sideways market noise, it helps avoid annoying false signals during periods of consolidation.
Ichimoku Cloud is a versatile indicator that gives you a clear snapshot of support and resistance levels, trend direction, momentum and potential reversals. Its signature cloud area uses colors to highlight different trend phases. This makes it easy to spot when the market’s feeling bullish, bearish or just sitting on the fence.

Ichimoku Cloud on TradingView illustrating trend direction and support/resistance zones with the cloud overlay
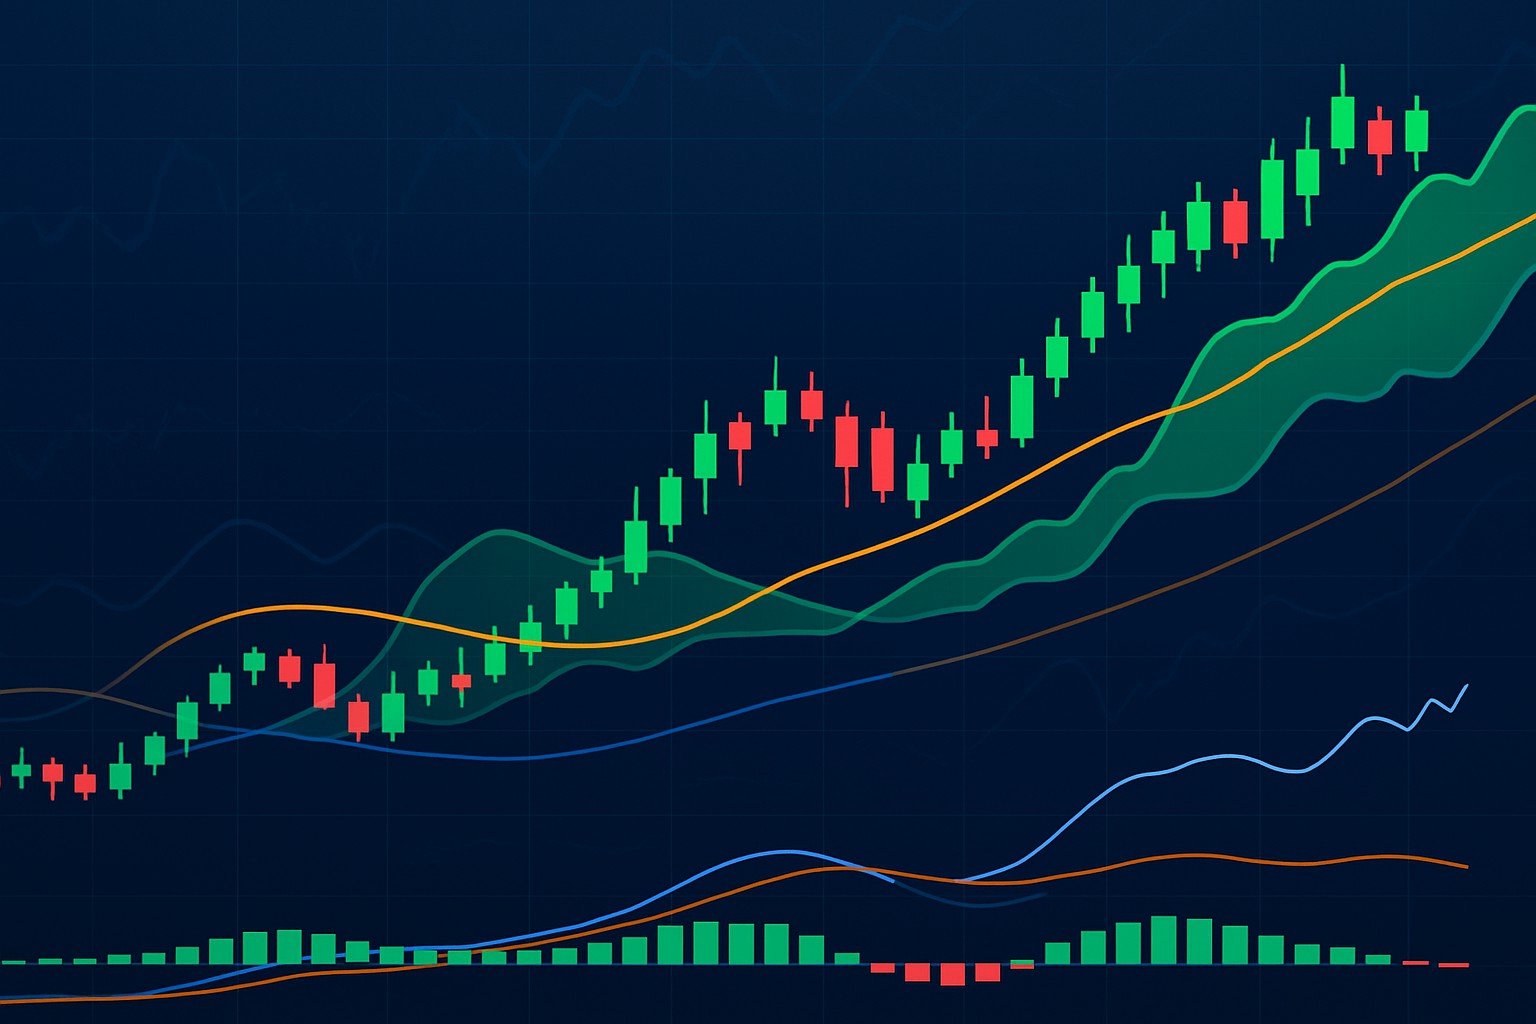
MACD cleverly mixes momentum with trend-following by comparing two moving averages, helping traders sniff out potential buy and sell signals. You’ll often see traders keeping an eye on the MACD line as it crosses above or below the signal line, while also paying attention to the histogram’s size and direction—those little bars really shout changes in momentum.
Parabolic Stop and Reverse (SAR) places dots above or below price bars to flag potential trend reversals and direction shifts. When the dots appear below the price, it is a reliable sign of an uptrend. Dots above usually point to a downtrend taking hold. Traders on TradingView often use Parabolic SAR during trending markets to better time their entries and exits.
Let's dive into the SuperTrend indicator, a tool that is gained quite a bit of love among traders for its straightforwardness and reliability. It essentially helps you keep your head above water in the often choppy seas of market trends by signaling whether you’re riding the wave up or bracing for a fall. Not too flashy, but it gets the job done, kind of like that dependable friend who shows up when you really need them.
SuperTrend has gained popularity because it cleverly combines Average True Range (ATR) with price action to highlight trend direction. It draws a line just below the price when things look bullish and flips above during bearish stretches. This makes it straightforward to follow. Traders often lean on it since it tends to catch trend reversals quickly, saving them from getting caught on the wrong side.
TradingView really stands out thanks to its impressive range of customizable indicators and snappy real-time charting features. It also has a lively community where traders eagerly swap scripts, ideas and strategies.

What You Get
Offers a broad selection of straightforward charting tools that help traders clearly visualize market data and feel confident in their trading choices, making the whole process feel a bit less like rocket science.
Makes market analysis easier by displaying data in a user-friendly and customizable way that suits traders of all experience levels, whether you are just dipping your toes or diving in headfirst.
Includes hundreds of built-in indicators, drawing tools, and various chart types that enable detailed exploration of market trends and patterns — giving you the tools to really nerd out on the data if that’s your thing.
Gives users the power to spot trading opportunities and make decisions backed by thorough data analysis, so you’re not just guessing but playing with a solid edge.
Allows multiple indicators on one chart, customizable layouts, and the option to save personalized chart templates to streamline trading routines, turning what could be a hassle into second nature.
Improves efficiency and the overall experience by letting traders adjust the platform to fit their individual strategies — because one size rarely fits all in trading.
Links users with a worldwide network of traders and investors to exchange ideas, strategies, and up-to-the-minute market insights, making it a little like having a trading roundtable anytime you want.
Encourages collaboration, learning, and refining strategies through interaction with the community, helping you avoid flying solo when it comes to tough decisions.
Built to be intuitive for beginners while still offering advanced tools that professional traders can access without a steep learning curve, striking a nice balance that avoids the usual tech overwhelm.
Promotes smooth navigation and helps users gain proficiency quickly, no matter their experience — so you spend less time scratching your head and more time trading.
Provides Pro+, Premium, and Elite plans, each adding more features like additional indicators per chart, better alerts, and priority support — letting you pick what feels right without breaking the bank upfront.
Lets users pick a plan that fits their trading style and budget, with options to scale up as their skills develop, because sometimes you’ve got to pay a bit more to play a bit better.
Supplies up-to-date market quotes, custom alerts, and instant updates so users can stay ahead in fast-changing markets — because missing the boat is no one’s favorite pastime.
Helps traders act proactively by ensuring they don’t miss important market moves or opportunities, keeping you in the know and ready to jump in when the time’s right.
TradingView is fantastic for hands-on charting and deep-dive analysis, but TrendSpider spices things up with AI-driven automation that really helps in catching trends through smart alerts and automated technical analysis.
This comparison lays out the key features of top TradingView indicator platforms, spotlighting pricing, features, and user experience to help traders pick the one that really gels with their style.
| Key Differences | |  |
|---|---|---|
| Pricing | Pro $14.95/mo, Pro+ $29.95/mo, Premium $59.95/mo | Basic $39.99/mo, Pro $59.99/mo, Premium $99.99/mo |
| Key Features | Advanced charting, a treasure trove of indicators, social sharing, and seamless access across all your devices. | Automated analysis, custom indicators, and smart AI-driven pattern recognition—tools that do a lot of the heavy lifting for you. |
| Ease of Use | Moderate learning curve; strikes a nice balance that suits both beginners trying to find their footing and seasoned traders alike. | Steeper learning curve; tailored for those active traders who are already comfy with technical analysis and want to dig deeper. |
| Target Audience | Great for traders at every level, especially those who want versatile analysis blended with a social twist. | Perfect for active traders and investors chasing automated, data-driven insights to stay ahead of the game. |
| Charting and Indicator Capabilities | A huge indicator library, multiple chart types, plus plenty of detailed drawing tools to get creative. | Sophisticated multi-timeframe charts, handy Fibonacci tools, and highly customizable indicators ready to match your strategy. |
| Automation & Pattern Recognition | Doesn’t come with built-in automation or AI pattern recognition—sometimes simplicity is key. | Comes packed with AI-driven pattern detection and automatic technical analysis to save you time and guesswork. |
| Integration & Community | Connects smoothly with major brokers and boasts a robust, engaged global trader community. | Leans heavily on advanced technical tools, with less focus on social networking or broader community features—more about the tech than the chit-chat. |
| Visit TradingView Site | Visit TrendSpider Site |
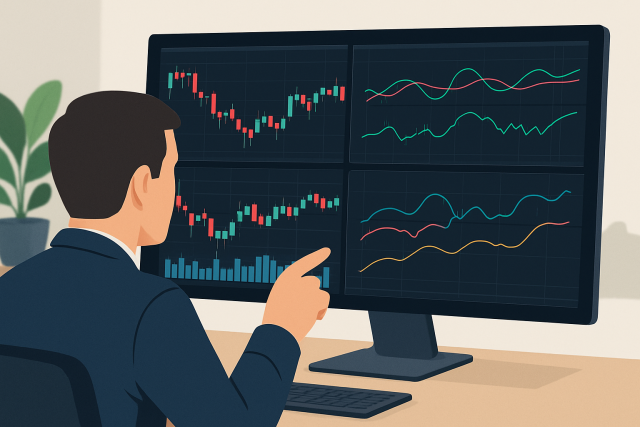
Relying on just one indicator can often send traders down the garden path especially when markets are unstable or stuck in a sideways drift. Using complementary indicators like a momentum tool such as MACD with a trend strength gauge like ADX usually gives you more confidence when spotting a genuine trend. Tools for timing your entries and exits such as SuperTrend or Parabolic SAR are great for adding final touches to your decision-making.
Relying too heavily on just one of the best TradingView indicators can often trip you up and lead to misreading the market and making some unfortunate trading decisions. Overlooking the bigger market picture, cutting corners on risk management or failing to double-check signals across different timeframes usually cause costly blunders even when the trend indicators seem rock solid.

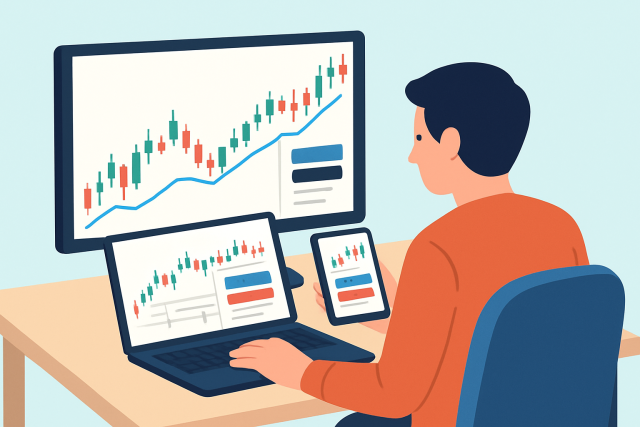
Are you tired of juggling multiple tools for your trading needs? TradingView is the all-in-one platform that streamlines your analysis and decision-making.
With its powerful charting capabilities, real-time data, and vibrant community, TradingView empowers traders like you to stay ahead of the market. Join thousands who trust TradingView for their trading success.

Driven by a passion for democratizing trading knowledge, she focuses on behavioral finance and psychological aspects of market decision-making.
Read PostsUnlock the power of the TradingView Profiler with this guide that breaks down volume profile reading...
Discover a step-by-step guide to using TradingView for seamless chart navigation and mastering its p...
Discover how to set up paper trading in TradingView with this step-by-step beginner’s guide. Gain co...
Discover how to locate the paper trading tab on TradingView and use it to practice trading without r...