51 articles
Elevate your trading prowess with our Trade Insights section. Gain access to real-time market data, technical analysis tools, and insightful research to make well-informed trading decisions and capitalize on emerging market opportunities.
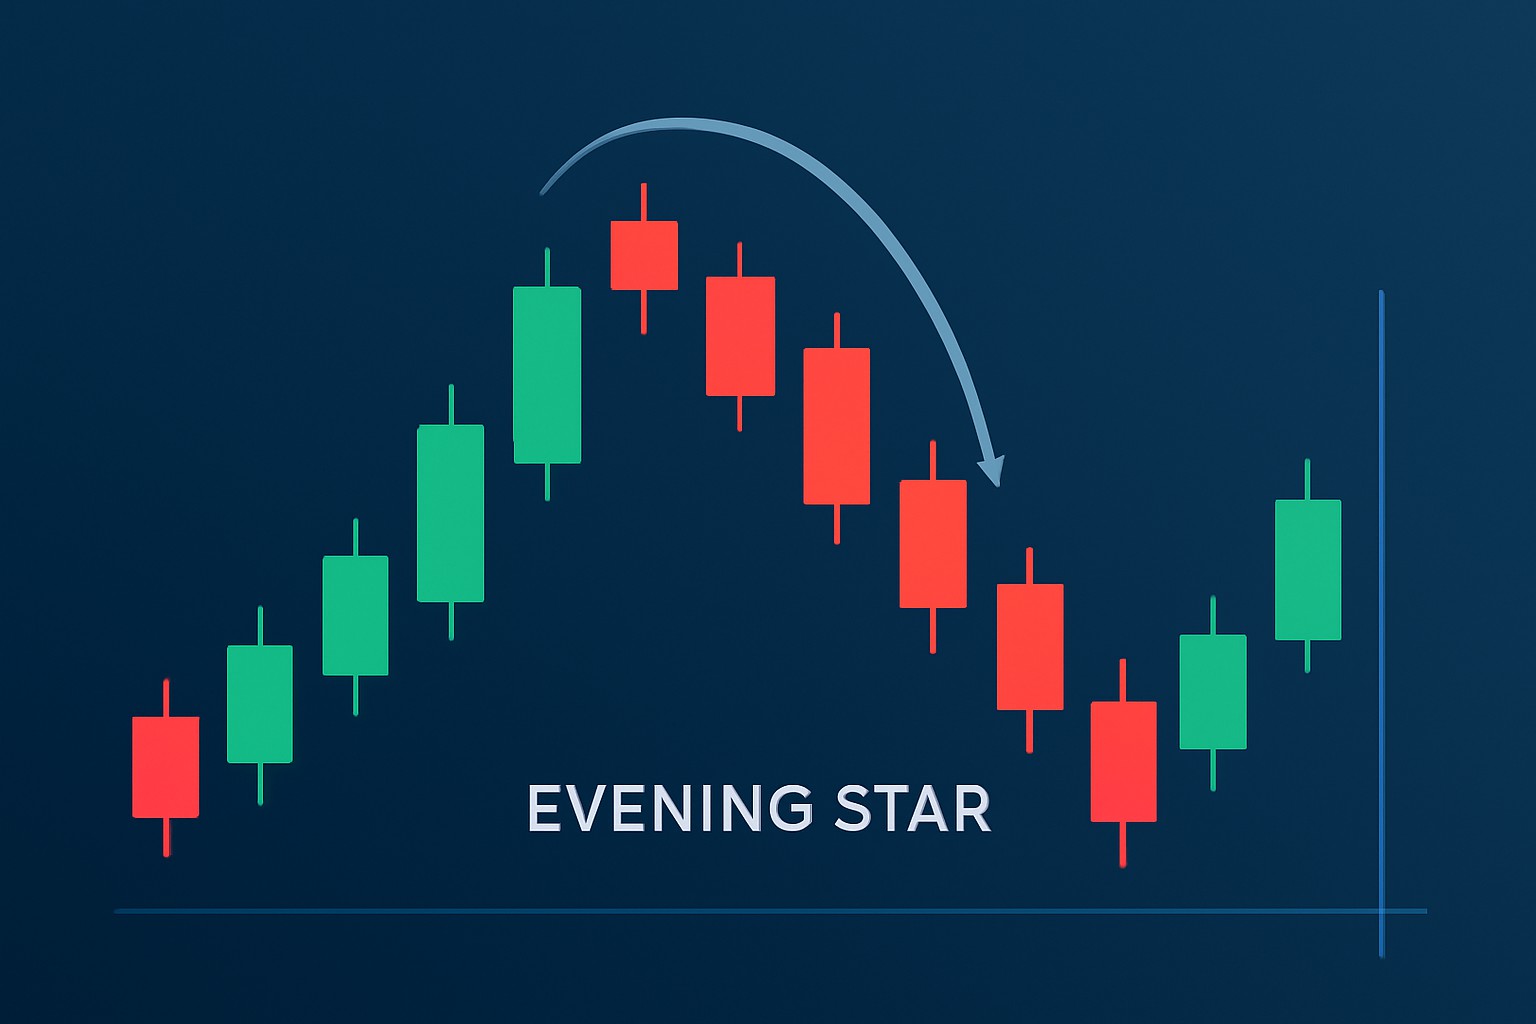
Discover how to recognize the evening star candlestick pattern—a powerful signal highlighting potential trend reversals—and enhance your trading strategies with clear insights and practical tips.
Learn how the True Range indicator captures market volatility and price swings, empowering traders to anticipate breakouts and manage risk effectively.
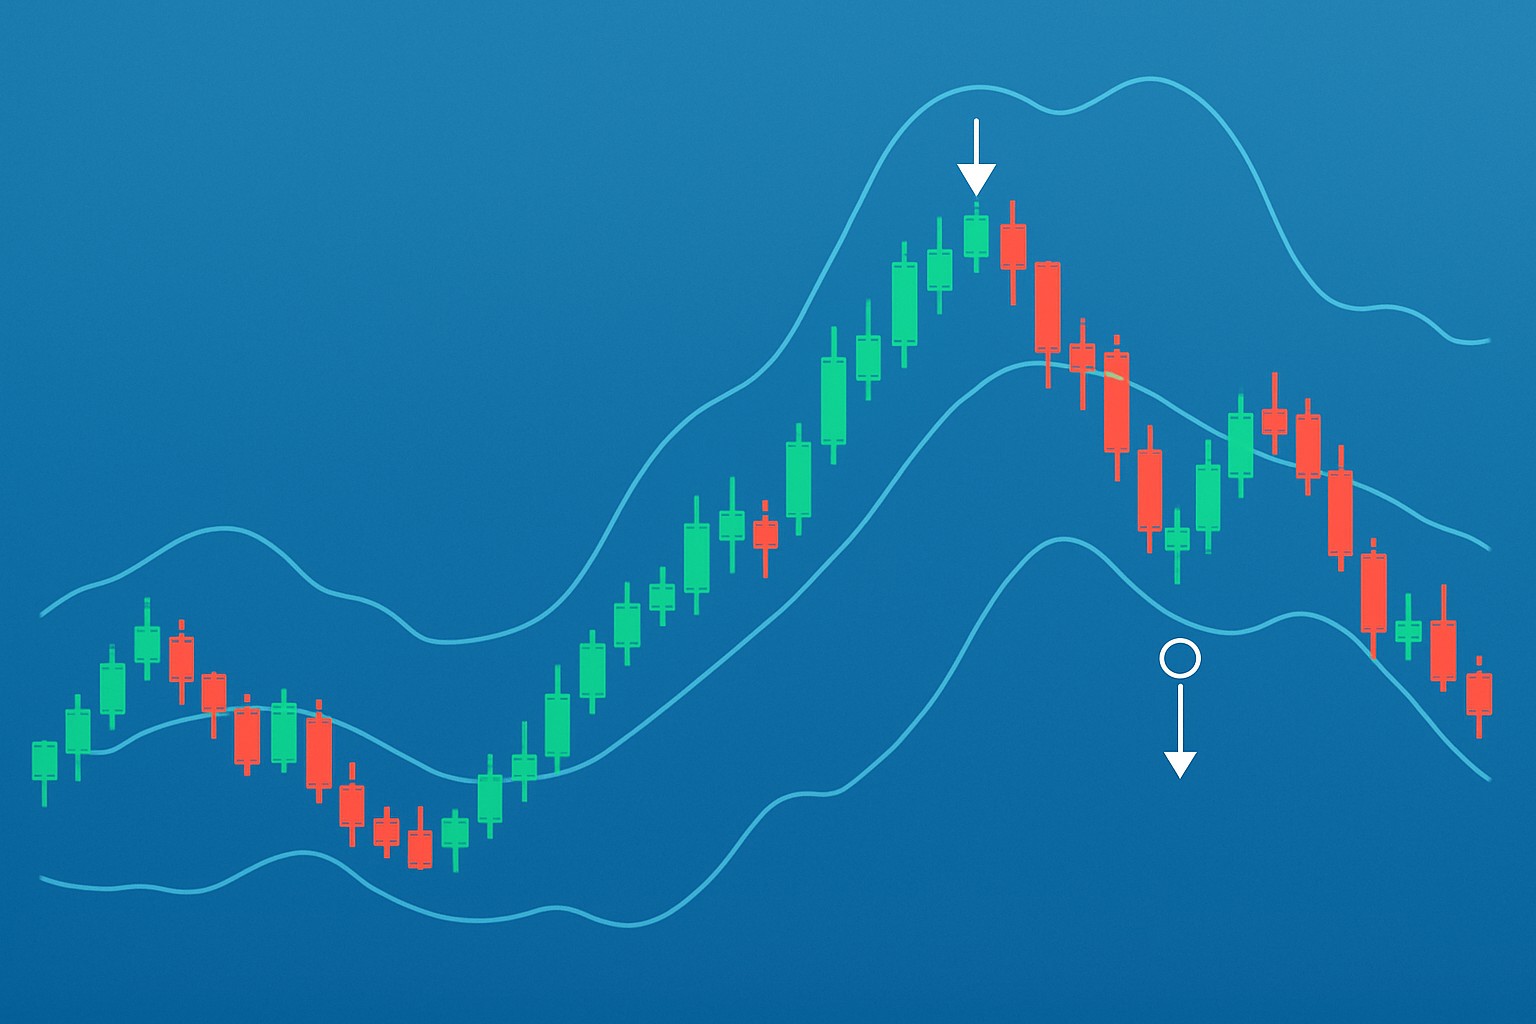
Master trading with Bollinger Bands by understanding volatility, setup patterns, and risk management. This how-to guide empowers traders at all levels to capitalize on price movements confidently.
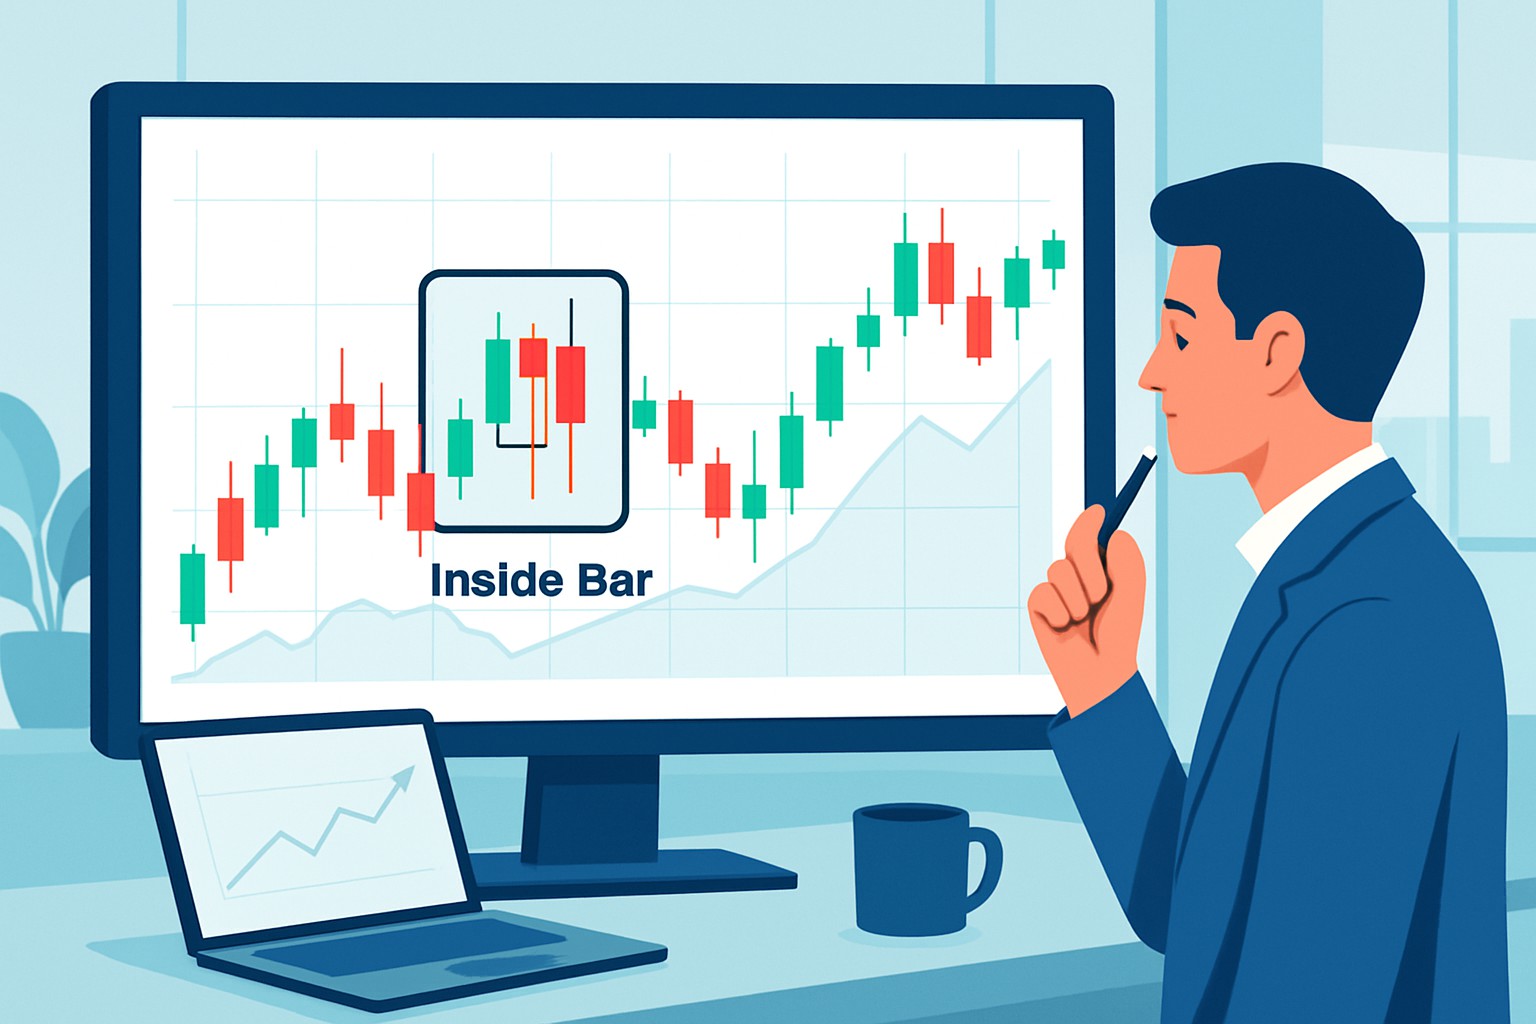
Discover how inside bar patterns signal key market pauses and possible breakouts or reversals. This guide breaks down the pattern in clear terms, tools, and tips for traders of all levels.

Liquidity is the ease of buying or selling assets at stable prices. Discover why liquidity matters in trading and how it impacts your market success.
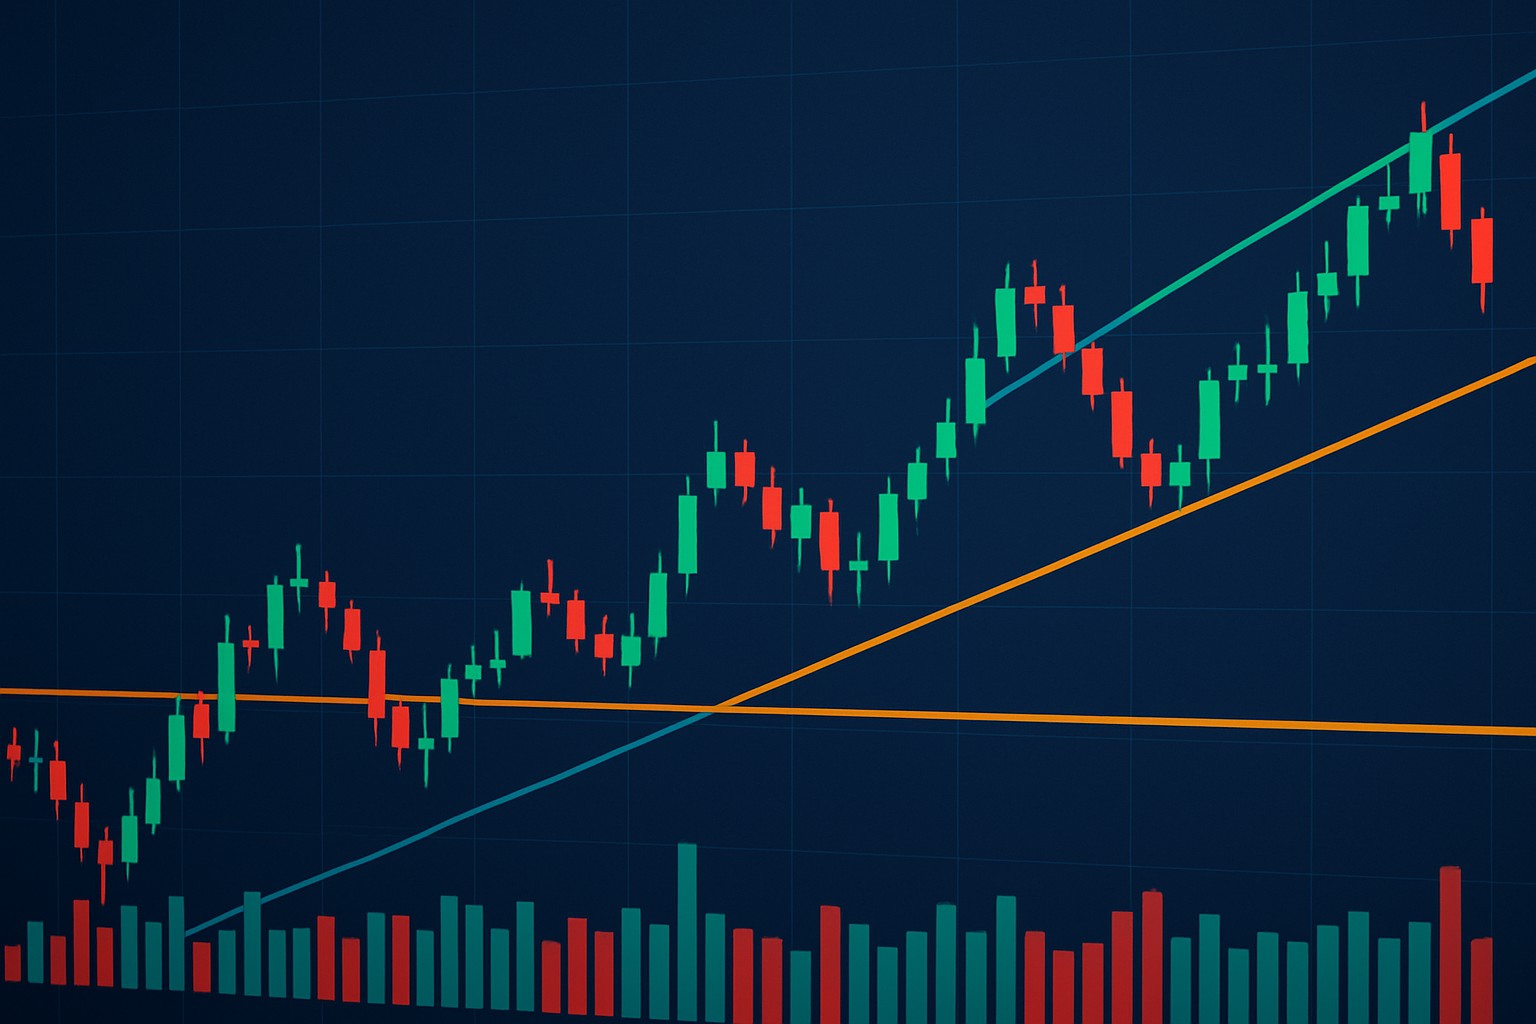
Trend lines are essential tools in technical analysis that help traders identify market direction and potential price action. This guide breaks down what trend lines are and how to use them effectively.
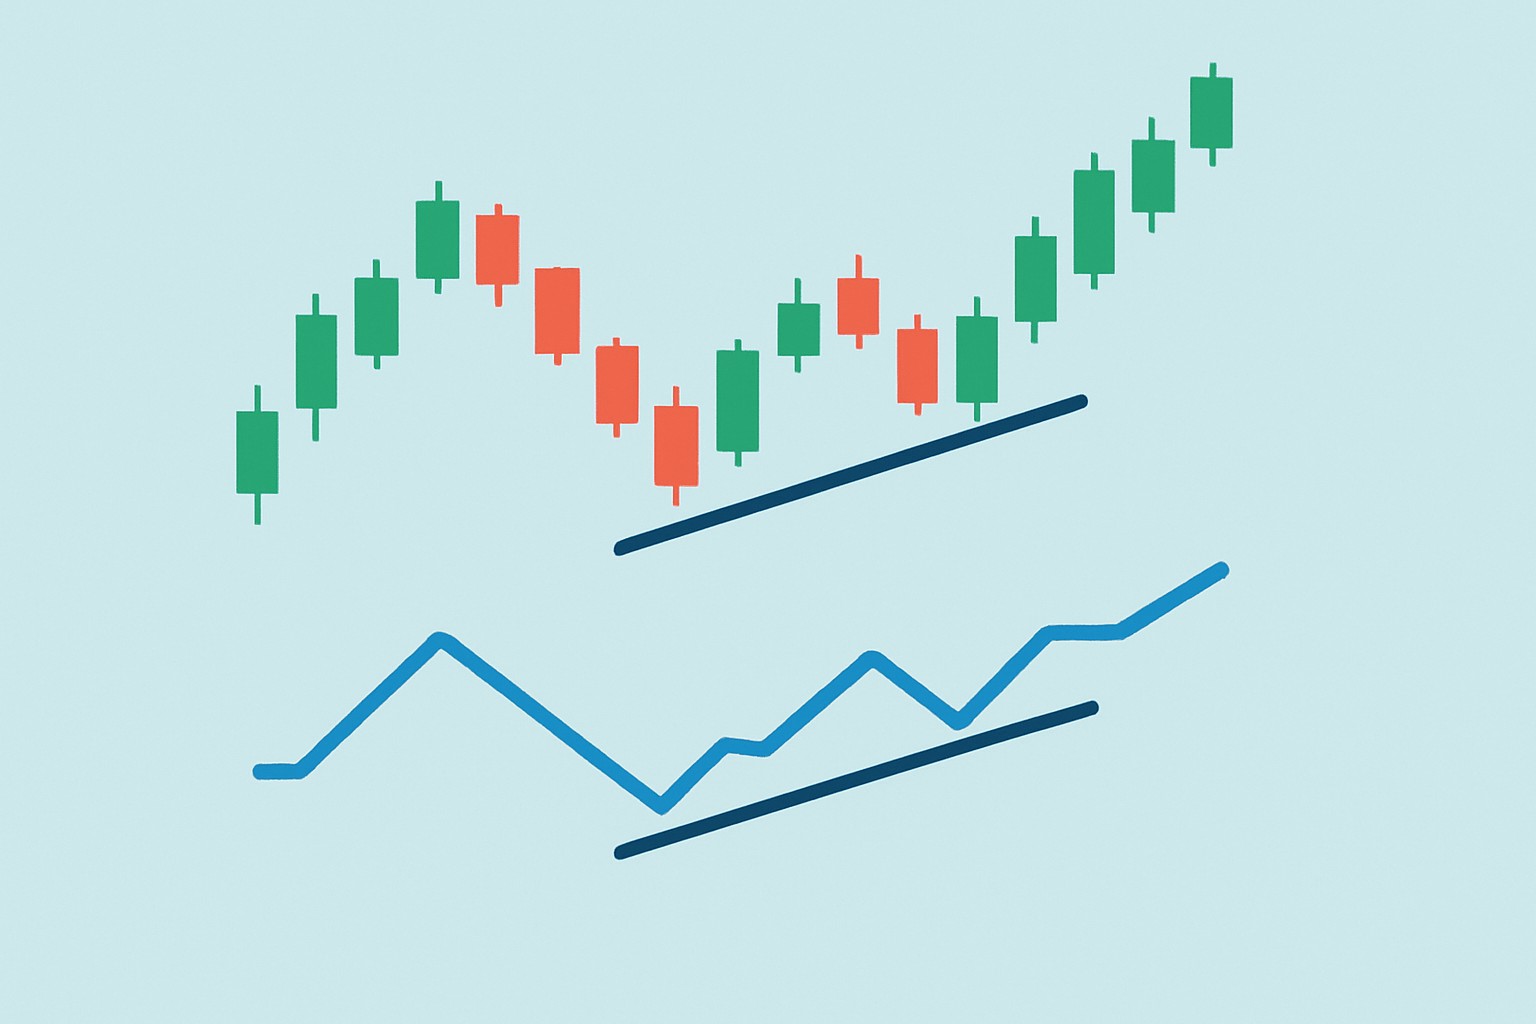
Hidden bullish divergence is a key technical indicator revealing strong buying pressure beneath uncertain price action. Learn how to identify it and why it predicts bullish trend continuation.
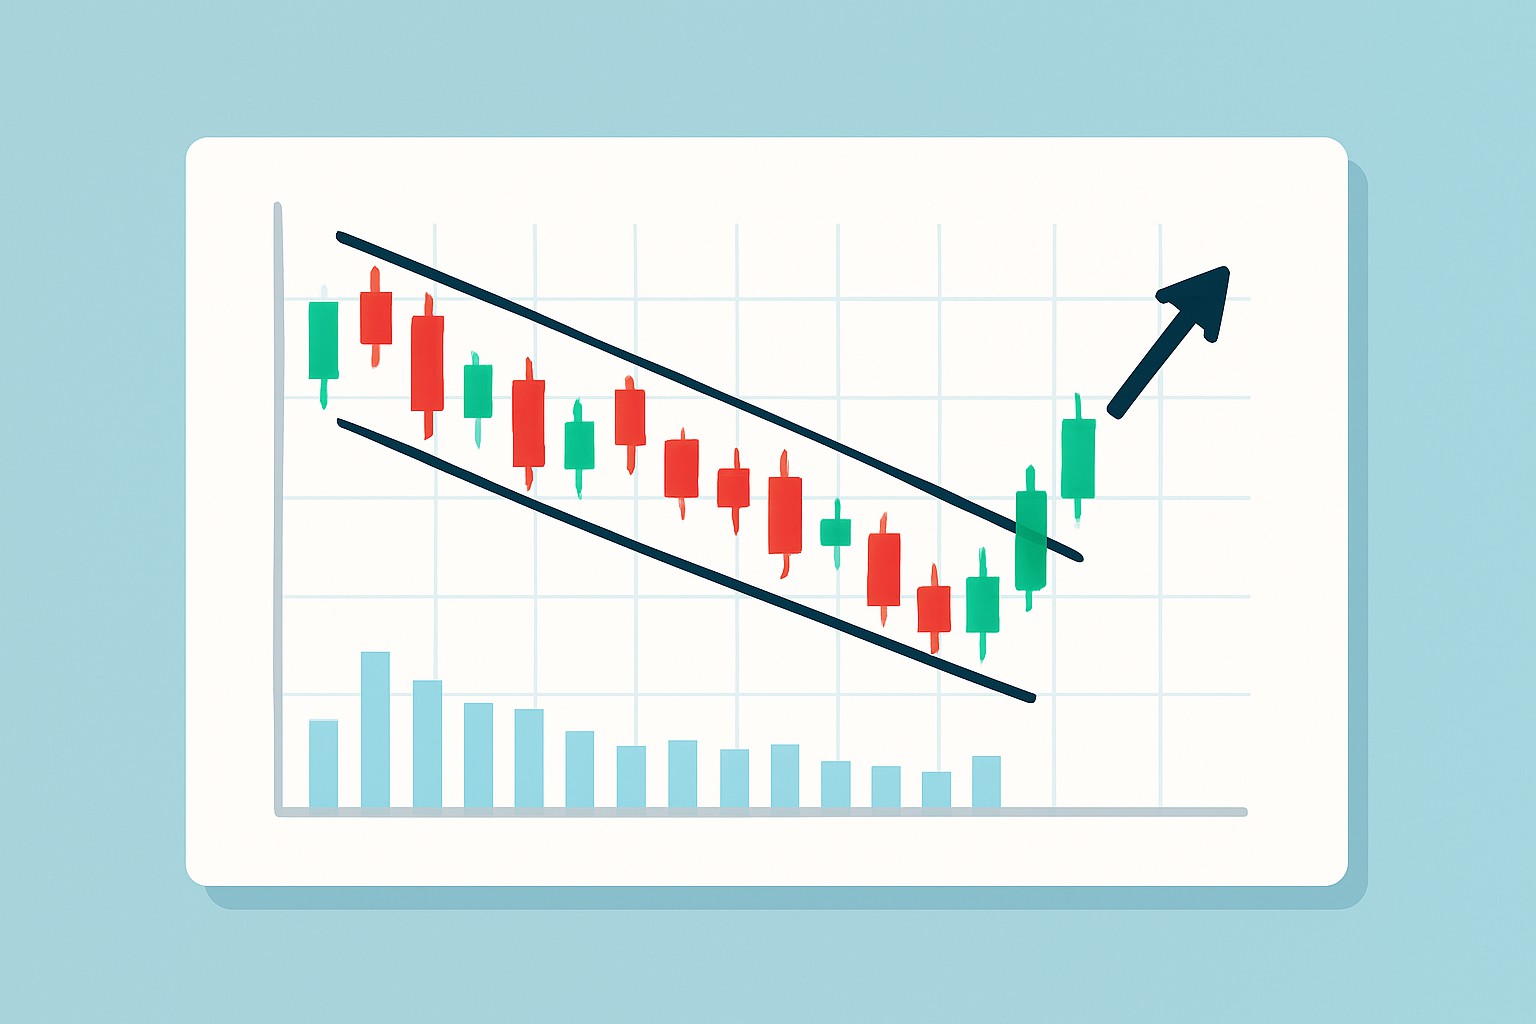
Discover the wedge falling pattern's secrets and learn step-by-step how to trade this powerful technical setup confidently, from identification to execution.

Understand what nonfarm payrolls mean and why this key economic indicator matters. This beginner-friendly guide breaks down the data, its importance, and how it affects financial markets.
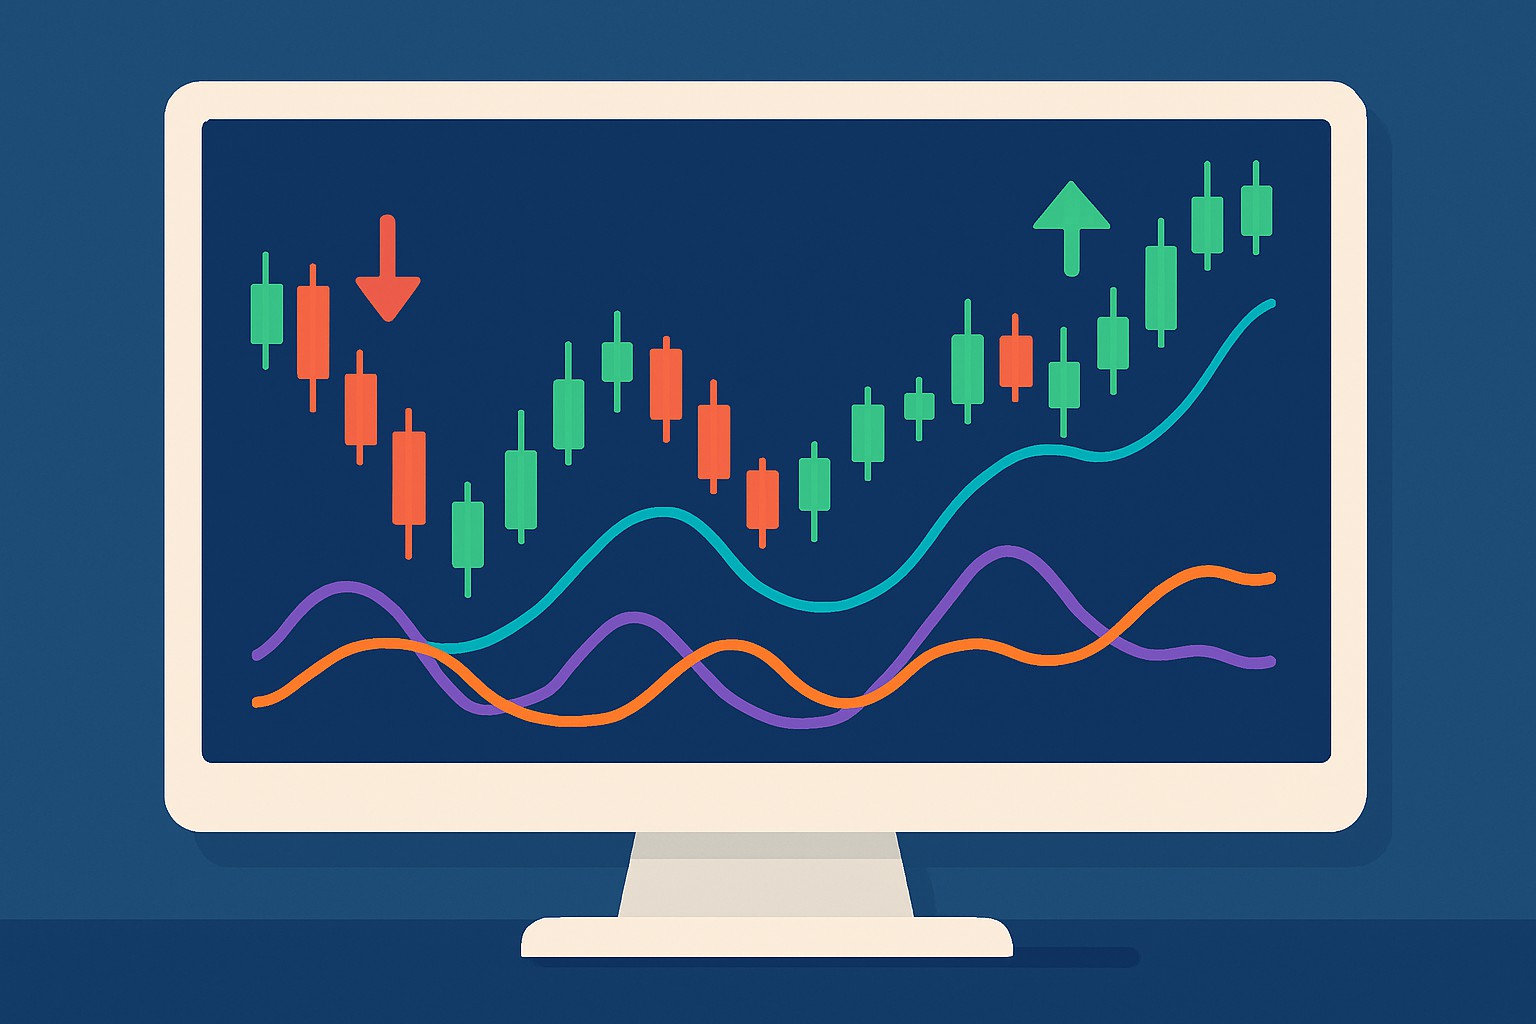
Master the momentum indicator to gauge price speed and trend strength. This ultimate guide covers calculation methods, popular variants, interpretation, and trading strategies.
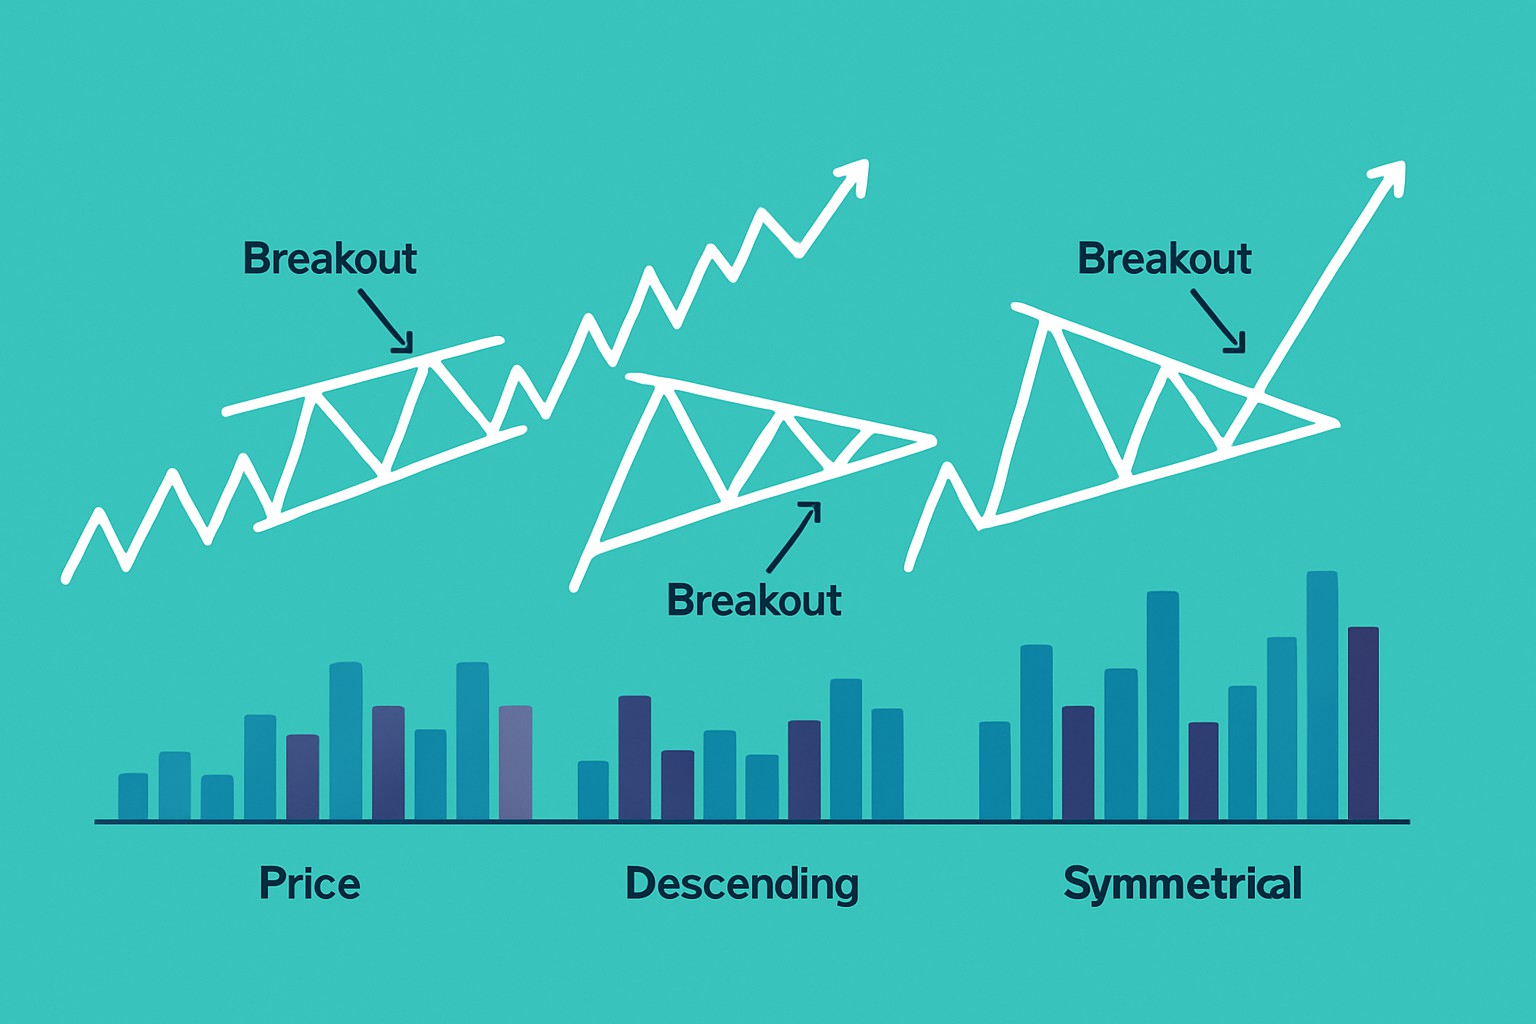
Discover how pattern triangles help traders predict price movements. This guide breaks down triangle types, identification methods, and breakout analysis for better trading decisions.

Oil inventory reports are key to understanding energy markets. This article breaks down how inventory data works and why it influences oil prices globally.
