

TradingView
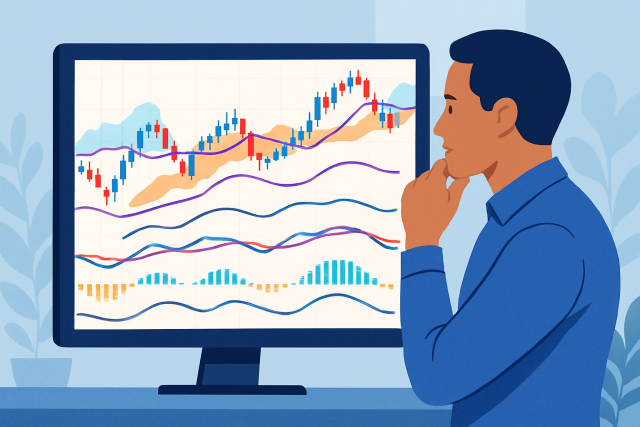
Some of the Best Indicators on TradingView for Trend Traders
Explore the top trend-trading indicators on TradingView that empower traders to identify strong mark...
The TradingView Profiler is a handy tool that lets traders and investors peek behind the curtain to see where the heaviest trading volumes cluster at specific price levels. This often unlocks valuable hints about market mood and highlights key support and resistance zones we all watch. Getting the hang of reading the profiler can up your game and help you nail better timing for entries, exits and managing risk like a pro.
TradingView Profiler is a handy visualization tool that lays out how volume is spread across different price levels over a selected time frame, shining a light on where the real action—the busiest trading—takes place.
The TradingView Profiler revolves around a handful of core concepts: the Volume Profile, Point of Control (POC) and Value Area.
Volume Profile reveals how traded volume is scattered across different price levels, giving you a clear picture of where most market players tend to hang out.
The Point of Control (POC) highlights the price level with the heaviest traded volume within a profile and serves as a handy benchmark.
Value Area High (VAH) and Value Area Low (VAL) frame the price range that captures roughly 70% of the trading volume and often point to key support and resistance zones.
Volume spikes often hint at shifts in supply and demand, making them a great tool for spotting potential breakouts or reversals before they become obvious.
Picking the right timeframe can be a bit of an art. Short-term traders usually lean on intraday profiles, while those chasing longer trends prefer daily or weekly profiles.

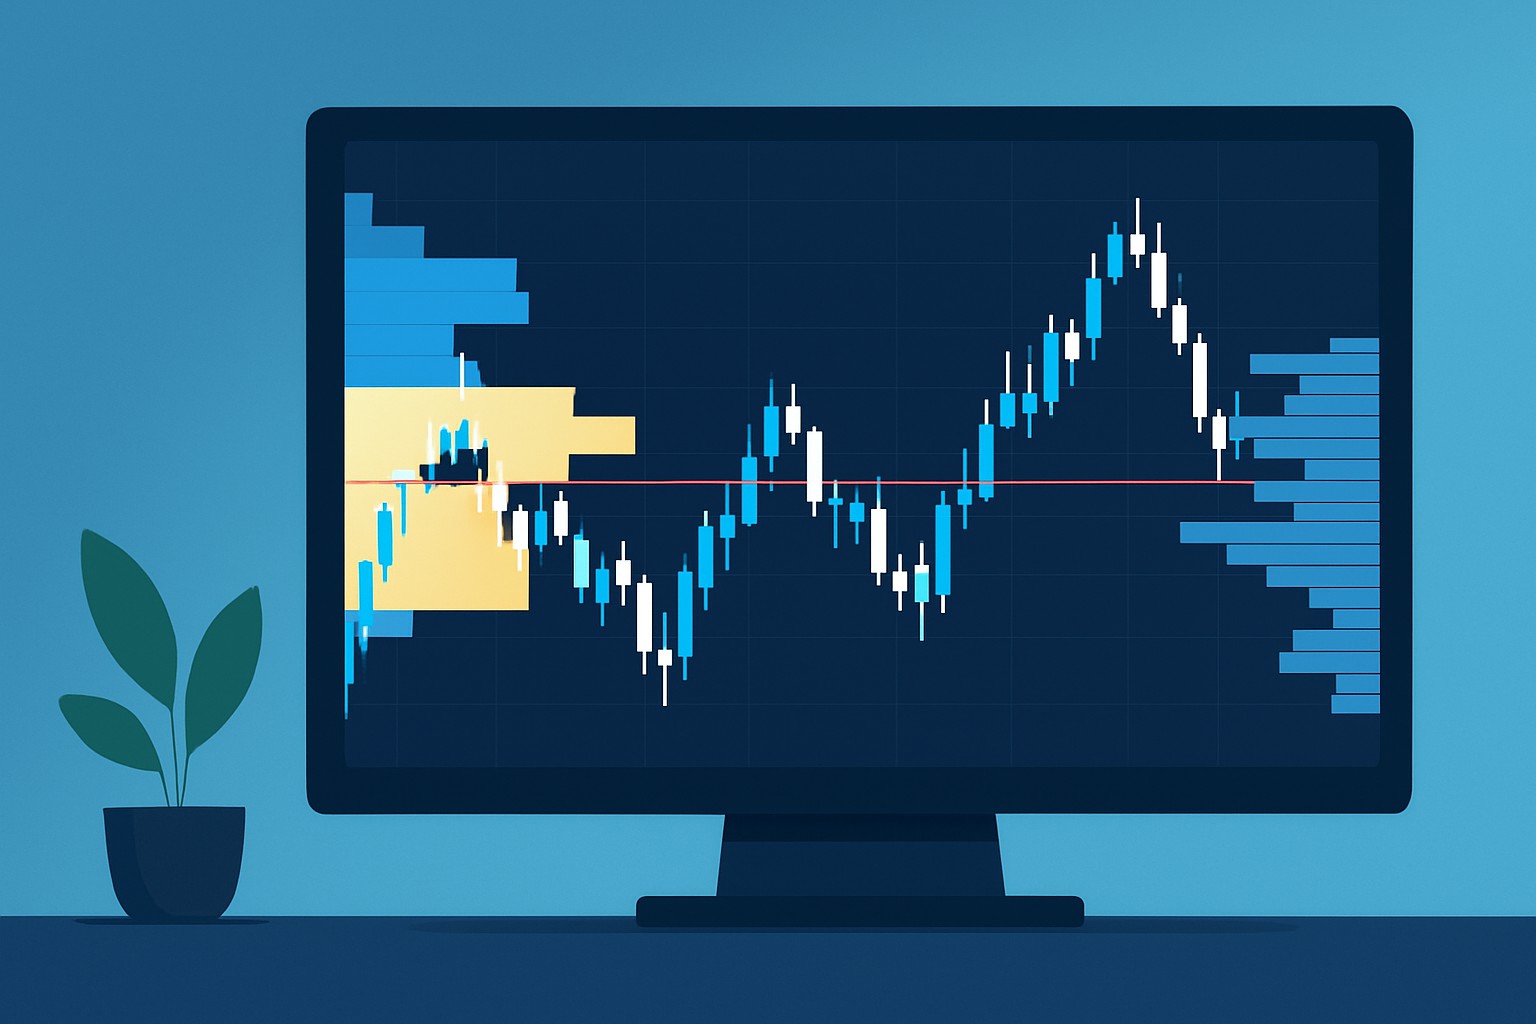
TradingView Profiler display highlighting volume distribution with key levels such as Point of Control and Value Area boundaries
When you peek at the profiler, volume tends to pile up in thick horizontal bands called volume clusters. These clusters highlight spots where serious buying or selling occurred and often serve as natural support or resistance. Price levels with consistently high volume usually signal strong market consensus. Sparse areas tend to act like rejection zones where the price couldn’t catch a break and struggled to gain momentum.
Tapping into the TradingView Profiler insights can genuinely sharpen your timing on entries and exits and help you manage risk like a pro. It also gives you that extra nudge in confirming trend signals you have already picked up on. When you understand exactly where volume clusters up, it’s like having a heads-up that helps you dodge those pesky false breakouts.
Reading the TradingView Profiler is a bit like staring at a heat map that’s come to life. The brighter and denser those volume clusters get, the more you can almost feel the market’s heartbeat speeding up. It’s like a friendly nudge, guiding you straight to where all the action is—so you’re not just wandering around trading aimlessly.
TradingView Profiler is definitely a handy tool in your trading toolbox, though I’ve noticed many traders lean on its data a bit too heavily or sometimes misinterpret volume levels altogether.
Really sharpen your TradingView Profiler skills by mixing things up with advanced techniques like order flow analysis and multiple timeframe profiling. Fine-tune parameters to fit different asset classes.
Blend order flow data with volume profiles to nail down the difference between aggressive buying and selling pressure versus passive accumulation. It’s like reading a room for the market.
Check volume profiles across multiple timeframes. Start with daily then zoom out to weekly or monthly to catch strong overlapping signals that might slip under the radar.
Don’t hesitate to tweak volume profile settings like row size or value area percentage. Matching these to the asset’s volatility and your trading style can make all the difference.
Pair Profiler readings with price action hints like candlestick patterns to make your entry and exit calls more grounded.
Always cross-check profiler levels against broader market and sector trends. This way you avoid getting fooled by what’s just market static rather than genuine interest.

Are you tired of juggling multiple tools for your trading needs? TradingView is the all-in-one platform that streamlines your analysis and decision-making.
With its powerful charting capabilities, real-time data, and vibrant community, TradingView empowers traders like you to stay ahead of the market. Join thousands who trust TradingView for their trading success.

Driven by a passion for democratizing financial markets, Vivienne creates educational content on forex trading and currency market fundamentals for beginners.
Read PostsExplore the top trend-trading indicators on TradingView that empower traders to identify strong mark...
Master trend spotting with the best TradingView indicators carefully selected for accuracy, ease of...
Discover how to set up Automated Trade Management (ATM) in TradingView with this comprehensive step-...
Discover the step-by-step process to enable TradingView on Tradovate, unlocking seamless trading com...