


TrendSpider
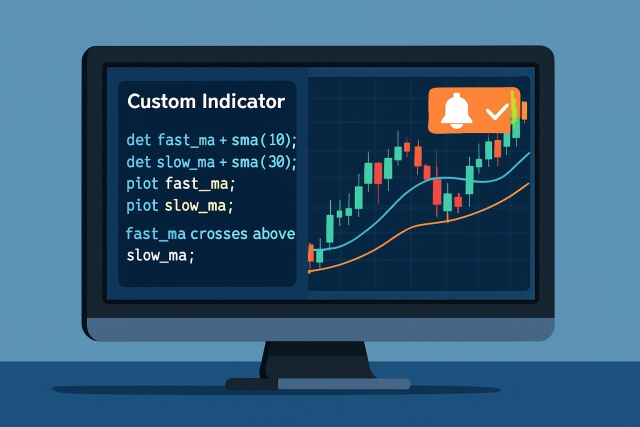
How to Create TrendSpider Custom Indicator from Scratch
Discover how to create custom indicators on TrendSpider with this step-by-step guide. Tailor your tr...
The TradingView stock screener is a handy little gem for traders of all stripes, making it a breeze to zero in on promising stocks and trading opportunities without any hassle.
TradingView's stock screener is quite the powerhouse—an online tool that sifts through thousands of stocks worldwide based on criteria you tailor yourself. What really makes it stand out is its clever mix of easy-to-navigate design, sophisticated filtering options and seamless chart integration.

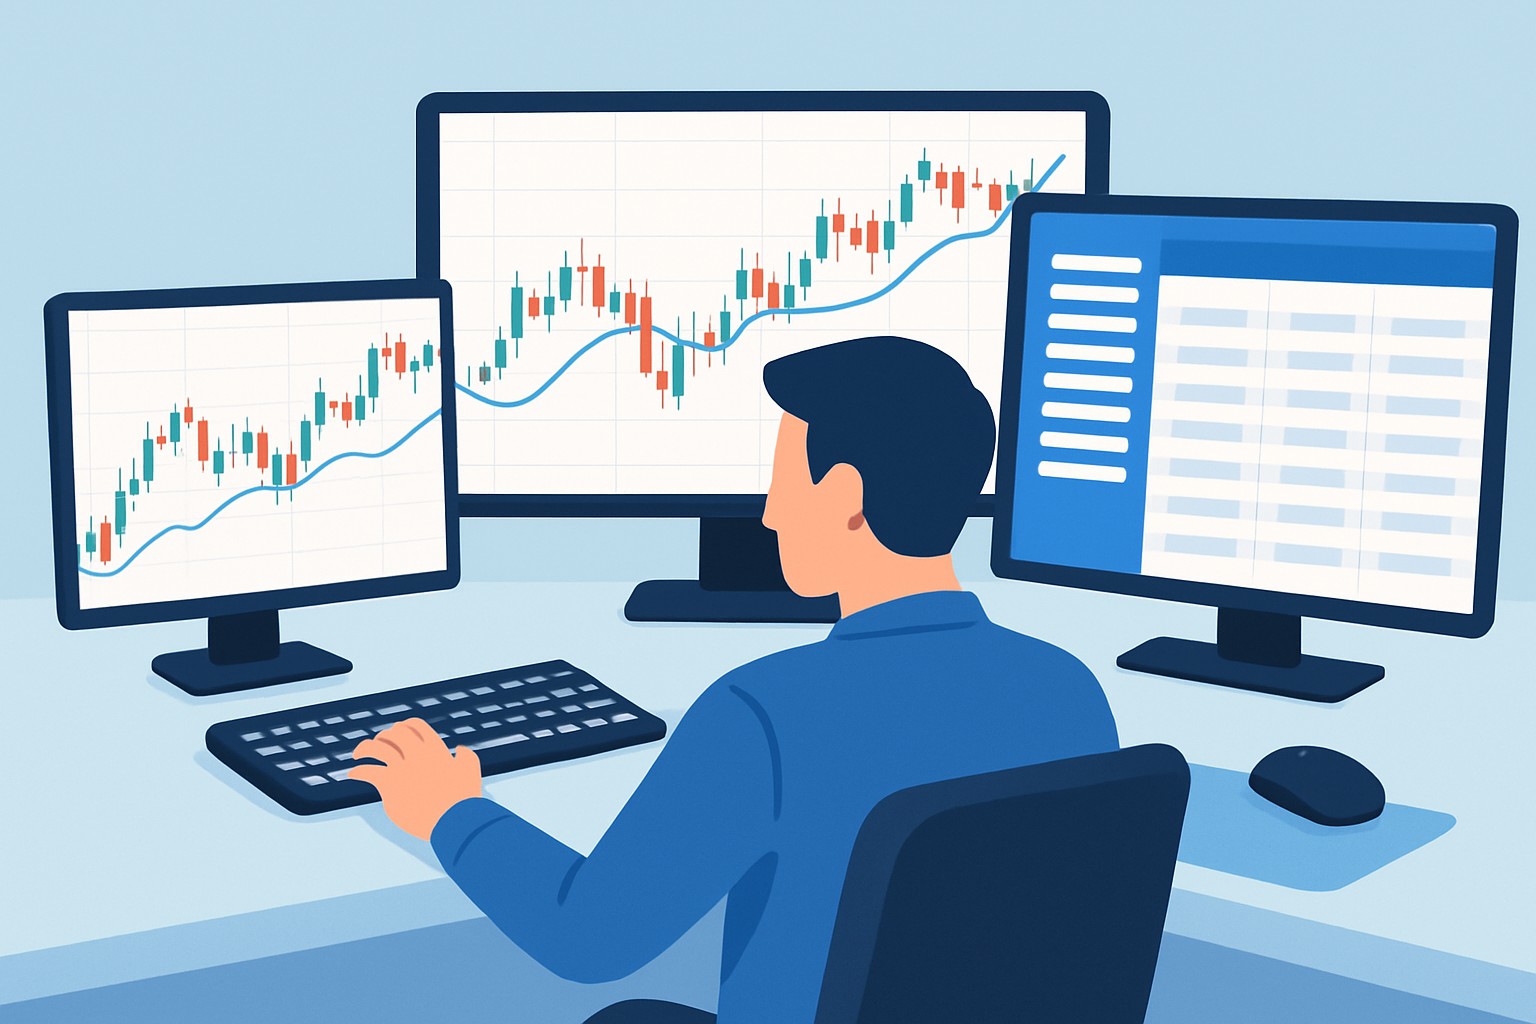
TradingView stock screener interface showcasing filtering options and stock results
Head over to the TradingView website at www.tradingview.com and sign up for a free account to unlock all those handy screener features.
Once you’re logged in, keep an eye out for the "Screeners" tab up top and click "Stock Screener."
Choose the market exchange or region that tickles your fancy like NASDAQ or NYSE.
Feel free to tweak the default filters or add your own criteria to make the screener work in your favor.
Don’t forget to save your settings then kick back and browse through the filtered stocks—you might just spot your next big opportunity.
Tweak your screener layout by shuffling columns around and picking the filters you want front and center.
Filters are your trusty sidekick when it comes to cutting through the vast stock universe and zeroing in on stocks that tick your particular boxes like market capitalization, volume, price range and important technical indicators.
Using several filters together can really sharpen how precisely you screen stocks. For example, setting a minimum volume ensures there’s enough liquidity to trade. Adding an RSI filter can point out stocks that look oversold or overbought. Picking specific sectors lets you stick to markets you know inside and out.
Once you have set up filters tailored to your trading strategy, you can save these custom screeners for lightning-fast access down the road.
Once you’ve got your filters all set up just the way you like, go ahead and hit that "Save" button perched at the top right of the screener.
Give your screener a clear, memorable name—something like "Momentum Stocks" or "Value Picks"—so you won’t have to rack your brain when you want to find it later.
You can jump into your saved screeners anytime from the dropdown menu, no need to rebuild your filters from scratch every single time.
If you’re feeling generous, sharing your screener URLs is a breeze—you can send them to colleagues or friends to brainstorm stock ideas together.
Saving screeners is a handy trick for keeping your stock research consistent, allowing you to reuse those filter combinations that actually do the heavy lifting. Plus, it shaves off a good chunk of time by skipping the repetitive setup.
Avoid filters that are way too strict and yield only a handful of results because that’s a sure path to missing out on some golden opportunities. On the flip side, brushing off volume or liquidity can land you with stocks that are tricky to trade or even harder to exit.
TradingView has built a solid reputation for its easy-to-navigate interface and rich charting tools. It also has a lively community buzzing with activity. Meanwhile, platforms like TrendSpider focus on automated technical analysis and AI-driven pattern recognition. They cater to those who want more horsepower under the hood with advanced algorithmic insights.
Choosing the right stock screener means weighing pricing, features, ease of use, and community support. Below is a side-by-side comparison of two top platforms to help you zero in on the one that best fits your unique trading style and experience.
| Key Differences |  |  |
|---|---|---|
| Pricing | Pro+ at $19.95 per month, Premium at $39.95 per month, Elite at $59.95 per month — reasonably priced tiers that won’t break the bank for most. | Standard at $49.99 per month, Pro at $79.99 per month, Elite at $129.99 per month — a steeper price, but you get what you pay for. |
| Charting and Technical Analysis | User-friendly charts packed with a wide range of indicators and plenty of customization options to make the data your own. | Sophisticated automated charting combined with AI-driven technical analysis — the kind of muscle power active traders appreciate. |
| Automation and Alerts | Basic alert system in place, but it stops short of advanced AI automation and pattern detection — good for starters, but not quite cutting-edge. | AI-powered pattern recognition, flexible alerts, and backtesting features designed to keep you one step ahead — automation at its finest. |
| User Experience | An easy-to-navigate interface that plays nice with both beginners and seasoned pros — no need to feel lost in the weeds. | Generally user-friendly, though newcomers might find the learning curve a bit steep — patience pays off here. |
| Community and Social Features | A vibrant global community buzzing with options for sharing and collaboration — trading doesn’t have to be a solo gig. | Offers fewer social features compared to other platforms — more of a solo flight than a group adventure. |
| Pros | Simple, easy-to-use tools, an active community, and extensive options to tailor your charts just right. | Powerful automation, precise pattern recognition, and responsive alerts that won’t let you miss a beat. |
| Cons | Limited in fundamental analysis; watch out for paywalls on premium features. Also, it might feel a bit tricky for absolute beginners just starting out. | Higher price tag, a learning curve that can trip up newcomers, and limited customization for those power users craving full control. |
| Visit TradingView Site | Visit TrendSpider Site |
TradingView usually shines for traders who appreciate a smooth user-friendly experience and love bouncing ideas off a lively community. They also enjoy rolling up their sleeves with flexible manual analysis. Meanwhile, TrendSpider tends to be the go-to for individuals who prefer letting automation take the wheel, especially when digging into detailed technical patterns.
Kicking off your journey with the TradingView stock screener is a smart move if you want to trade stocks more effectively and get real insight. Take time to play with the filters and experiment with different approaches. Tweak your strategies as you learn what works best for you.

Struggling to improve your trading performance? Edgewonk's advanced analytics tools are designed to give you the edge you need.
With detailed trade journaling, robust strategy analysis, and psychological insights, you'll gain a comprehensive understanding of your strengths and weaknesses. Don't miss out on this game-changing opportunity.

Known for demystifying options trading for retail investors, this former hedge fund manager brings Wall Street expertise to everyday trading education.
Read PostsDiscover how to create custom indicators on TrendSpider with this step-by-step guide. Tailor your tr...
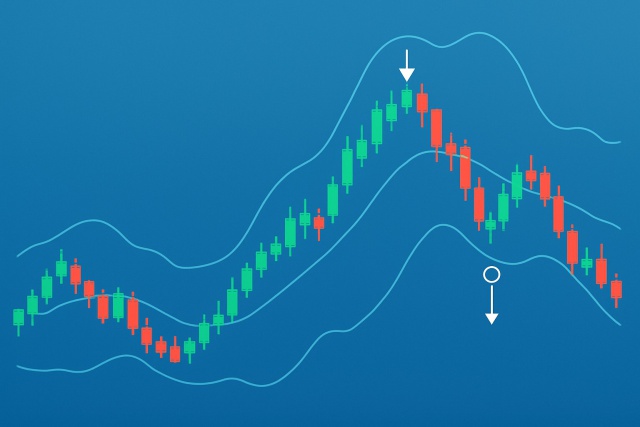
Master trading with Bollinger Bands by understanding volatility, setup patterns, and risk management...

Discover how to recognize the evening star candlestick pattern—a powerful signal highlighting potent...

Unlock the full potential of TrendSpider with this authoritative guide to TrendSpider University tra...