


Technical Analysis
Momentum Indicator Basics for Traders
Master the momentum indicator to gauge price speed and trend strength. This ultimate guide covers ca...
Heikenashi candles are quite the quirky twist on traditional charting in technical analysis, helping traders get a clearer picture of market trends by smoothing out the usual noisy price data.
Heikenashi candles offer a fresh take compared to your run-of-the-mill candlesticks by averaging price data to tone down the usual market noise. Rather than laying out the raw open, close, high and low prices like standard candlesticks do, Heikenashi candles rely on tweaked calculations that smooth over short-term jitters. This makes it easier to spot the bigger picture in price trends.
Traditional candlesticks lay out raw price data for each period in a straightforward way, while Heikenashi candles take a more polished approach by using adjusted calculations to paint a smoother picture of price movement. This switch-up naturally changes both their appearance and how you read market trends.
| Feature | Heikenashi Candles | Traditional Candlesticks |
|---|---|---|
| Calculation Method | Calculates smoothed averages of open, close, high, and low prices to iron out the bumps | Uses the exact open, close, high, and low prices, keeping all the raw details intact |
| Appearance | Produces candles that flow more smoothly, cutting down on the usual noise and hiccups | Shows a variety of candle sizes with more frequent ups and downs, like a rollercoaster ride |
| Noise Reduction | Tends to filter out those pesky short-term market jitters, making the trend easier to spot | Lays bare every price twitch and spike, including all the market’s noisy moments |
| Typical Use Cases | Often preferred when you want a clearer picture of trend strength without getting distracted by noise | Commonly favored for digging into detailed price action and pinpointing precise entry points |
Heikenashi candles do a pretty neat job smoothing out those wild price swings, making it a lot simpler to catch the overall vibe of the market as it unfolds. Traders often find it easier to pinpoint lasting trends and get a better sense of when momentum is starting to fizzle out or gearing up for a flip.
Heikenashi candles are crafted using specific formulas for each component—open, close, high and low—that cleverly incorporate data from previous candles to smooth things out.
This smoothing helps each Heikenashi candle flow more gently into the next, taming those jarring jumps that can make a chart look like a rollercoaster ride.
Interpreting Heikenashi candles is about tuning in to the candle’s color and size to get a real feel for trend strength and spot potential reversals.

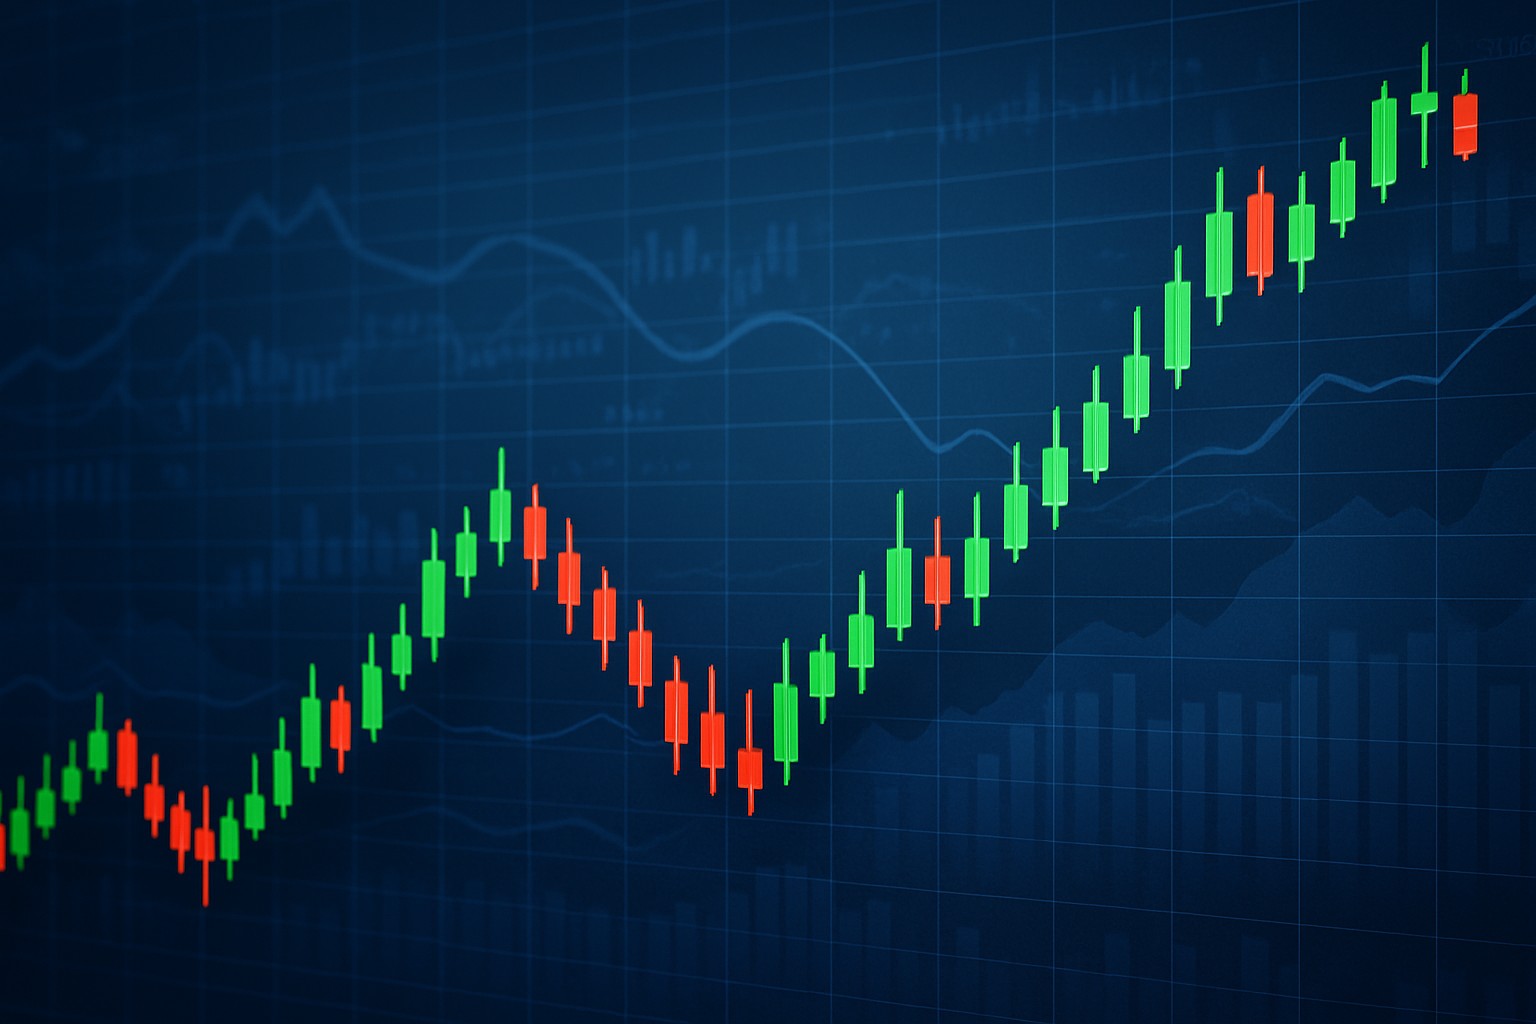
Example of Heikenashi candles showing a clear uptrend followed by indecision and reversal signals
The color of Heikenashi candles generally gives you a clear hint about momentum. Green usually signals upward pressure while red points toward downward pressure. Bigger candle bodies are like a shout indicating strong momentum and often a trend that’s ready to keep rolling. On the flip side smaller bodies suggest the strength is fading a bit. It’s almost like the trend is catching its breath. A neat detail is when green candles show up without lower wicks or red candles come without upper wicks. This is often a solid confirmation that the trend is holding strong.
Heikenashi candles act like a trusty filter, slicing through the market’s noisy chatter to reveal the genuine price momentum hiding beneath — kind of like fine-tuning a radio dial until the static fades and the music comes through loud and clear.
Trading with Heikenashi candles can be a real game-changer once you get the hang of it, so let’s dive into some handy tips that might save you from a few rookie mistakes along the way.
To really squeeze the most juice out of Heikenashi candles, it’s a smart move to pair them with other technical indicators and check out multiple timeframes. This combo tends to make those trend confirmations feel a lot sturdier.
Relying solely on Heikenashi candles can occasionally lead to missed opportunities or give you a bit of a false sense of confidence if you’re not paying attention to other supporting analysis tools.
There are a few common myths floating around about Heikenashi candles. Some traders tend to believe they magically filter out all the market noise and nail exact price reversals every time. They also think Heikenashi candles make other analysis tools obsolete or work like a charm regardless of the timeframe.
By keeping expectations grounded and combining Heikenashi candles with other indicators and solid trading strategies, traders can get a clearer picture of market trends without putting all their eggs in one basket or counting on certain outcomes.

Tired of missing opportunities and making suboptimal trading decisions? TrendSpider's cutting-edge platform automates complex technical analysis, saving you time and reducing human error.
With multi-timeframe analysis, dynamic alerts, backtesting, and customizable charting, you'll gain a competitive edge in identifying trends and making informed trades across global markets.

Known for demystifying options trading for retail investors, this former hedge fund manager brings Wall Street expertise to everyday trading education.
Read PostsMaster the momentum indicator to gauge price speed and trend strength. This ultimate guide covers ca...

Learn how the True Range indicator captures market volatility and price swings, empowering traders t...
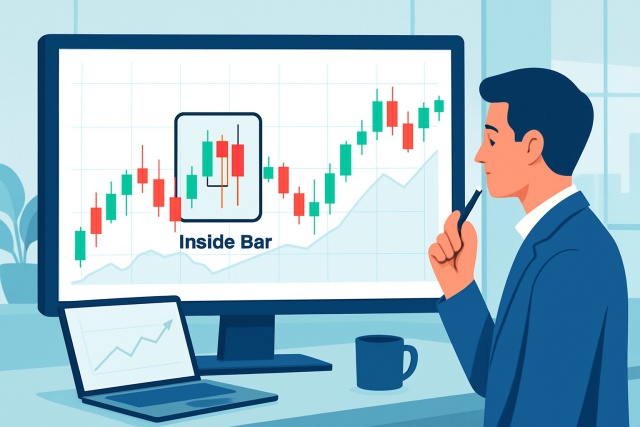
Discover how inside bar patterns signal key market pauses and possible breakouts or reversals. This...

Discover how to recognize the evening star candlestick pattern—a powerful signal highlighting potent...