


TradingView
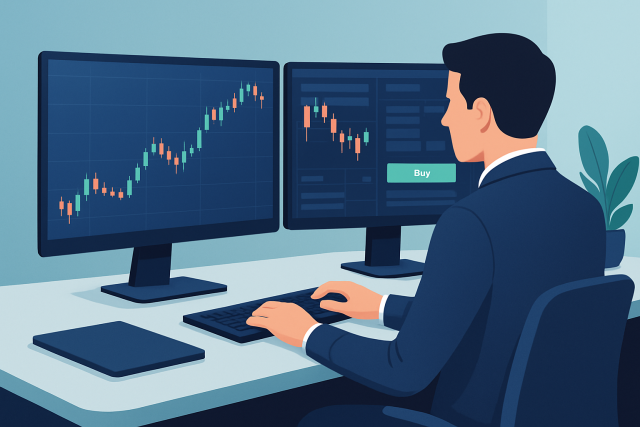
How to Allow TradingView on Tradovate for Smooth Trading
Discover the step-by-step process to enable TradingView on Tradovate, unlocking seamless trading com...
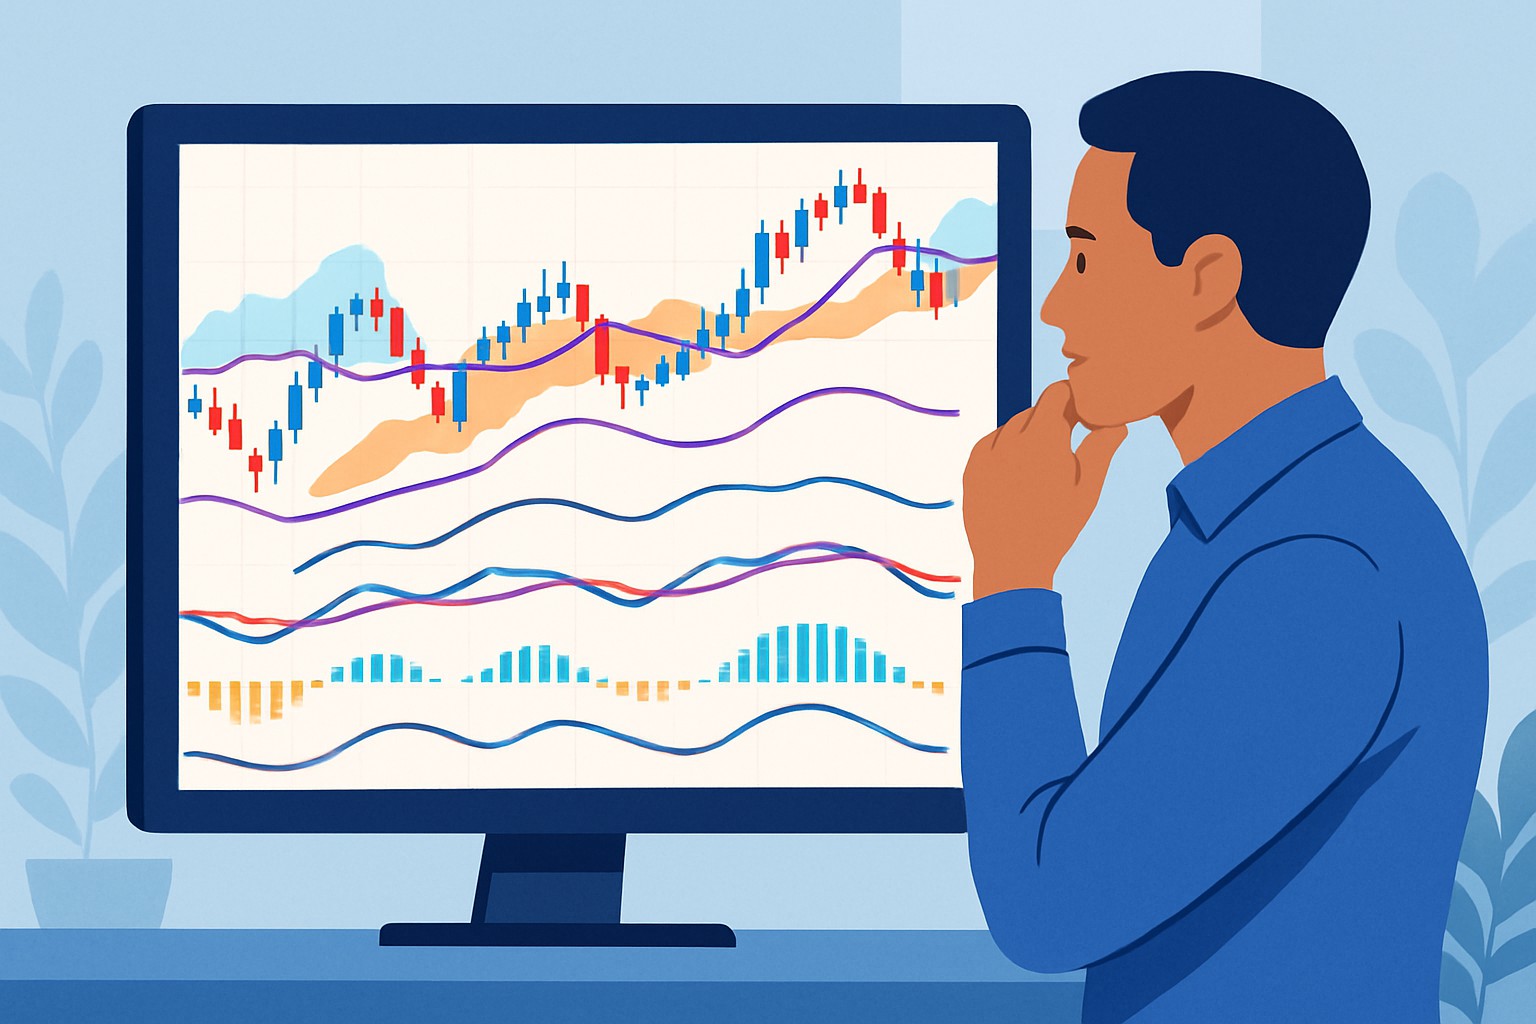
Trend traders often lean on some of the best indicators on TradingView to confidently spot and ride price movements as they unfold. The platform is celebrated for its sturdy charting capabilities and a treasure trove of indicators, offering plenty of tools that can really lighten the load.
We took a close look at indicators by checking how spot-on they are at detecting trends and how straightforward they are to grasp. We also considered how much love they get from TradingView users and how adaptable they prove across different asset classes.
Let's dive into the Moving Average Convergence Divergence, or MACD for short—a trusty tool that traders swear by to make sense of market momentum. It might sound a bit technical at first, but once you get the hang of it, the MACD can be like having a seasoned guide whispering insights about trend shifts right in your ear.
The Moving Average Convergence Divergence or MACD is one of the most popular momentum indicators that trend traders swear by worldwide. It looks at the difference between two exponential moving averages—typically the 12- and 26-period EMAs—to get a feel for the strength and direction of a trend. TradingView’s take on the MACD lets you tweak the EMAs and signal line settings to perfectly match your favorite timeframes and assets. I’ve found this makes a world of difference. The histogram visually spells out when those moving averages are converging or diverging and gives you a straightforward snapshot of momentum shifts that often hint at where you might want to jump in or out of a trade.
MACD serves up pretty clear signals about shifts in momentum, making it a favorite for trend traders who want to know just when to jump in as bullish vibes pick up or wisely step aside when bearish signs start waving red flags. Its histogram does a neat job of boiling down complex data into a straightforward visual perfect for instantly sizing up how strong a trend really is without breaking a sweat. When the MACD line crosses the signal line, it’s often a nudge that a trend reversal might be brewing.
Let's dive into the Average Directional Index, or ADX for short. It is that handy little tool traders lean on when trying to figure out just how strong a trend really is—no guesswork needed. You might say it is like the strength meter at a carnival game, but for market trends. Whether the market's on a leisurely stroll or sprinting full throttle, the ADX helps cut through the noise and spot the real action.
The Average Directional Index (ADX) is a handy tool that measures the strength of a trend without focusing on its direction—something trend traders especially appreciate. Created by Welles Wilder, the ADX blends upward and downward price moves into a smooth line that typically ranges between 0 and 100. On TradingView, this indicator helps traders determine if the market is genuinely trending or moving sideways. This reduces the risk of chasing false breakouts or being caught off guard by sudden reversals.
Traders often treat ADX values above 25 as a pretty solid sign that a strong trend is underway, while readings below 20 usually suggest the market is a bit lackluster or just meandering sideways. On TradingView, pairing ADX with directional indicators +DI and -DI or price action clues tends to offer more trustworthy trend entry points. This combo can really help cut through the noise. Throwing in other momentum or volume indicators alongside ADX is another smart move to help weed out those pesky false signals.
The Ichimoku Cloud is a well-rounded trend indicator that brings several layers of market info to the table, including trend direction and momentum plus versatile support and resistance zones. It might seem daunting because it bundles multiple components like the Tenkan-sen, Kijun-sen, Senkou Spans and Chikou Span. Once you get the hang of it, it often becomes a trusty sidekick for trend traders who want clearer signals amid all the usual market static.
When you really dive into using Ichimoku Cloud on TradingView, it has this way of boosting traders' confidence in their trend-based calls like few other tools do. The clever dance of its various lines not only helps you spot trends but also shines a light on potential reversal zones and smart exit points with surprising clarity.
The Parabolic SAR indicator is a neat tool that helps traders set trailing stop losses and spot trend reversals by plotting a series of dots just above or below the price bars. On TradingView these dots serve as a visual roadmap for the current trend. When you see dots below the price it usually signals an uptrend while dots above hint at a downtrend. This makes the indicator handy for managing positions and locking in profits as the market moves.
Parabolic SAR tends to shine in trending markets, helping traders spot when a trend is still going strong and where it might be wise to exit. It’s not foolproof and can throw out some false signals when the market is moving sideways or behaving choppily.
The Hull Moving Average (HMA) is crafted to give trend traders a faster and smoother moving average by using weighted moving averages and tweaking the period based on its square root. On TradingView it’s well-liked because it trims down lag much more than average moving averages. This helps traders snag quicker entry and exit signals while staying smooth enough to avoid false alarms.
HMA tends to shine brightest when paired with volume indicators or momentum oscillators, which do a great job confirming if a trend is truly robust and help cut through the usual chatter of minor pullbacks. Traders on TradingView often get a bit creative by adjusting the period length to match different assets and timeframes, tailoring HMA to their specific needs.

Example TradingView chart showcasing the Hull Moving Average overlaid on a trending stock price
TradingView comes packed with many indicators but when you combine it with clever analytics tools like TrendSpider your trend trading game can level up. TrendSpider offers automated trendline detection and flexible multi-timeframe analysis. It also has robust backtesting features that complement TradingView’s charting. Together these tools help traders double-check signals with smart algorithms and spot trade opportunities more precisely.

What You Get
Automatically identifies key trends, support and resistance levels, plus potential entry and exit points, making the analysis process much more straightforward—saving you from the usual head-scratching moments.
Saves time and cuts down on human error, helping you make decisions more efficiently and with greater confidence. It’s like having a sharp-eyed assistant who never blinks.
Lets users build, tweak, and tailor technical indicators to fit their specific trading strategies and personal tastes—no cookie-cutter stuff here.
Offers the flexibility to shape analysis tools exactly around your unique trading style and needs, so you aren’t forced into a one-size-fits-all mold.
Features multi-timeframe analysis, Fibonacci retracements, and dynamic price alerts that dig deeper into market nuances you might otherwise miss.
Supports detailed market visualization and timely alerts, helping you pounce on trading opportunities before they slip away.
Uses AI algorithms to consistently spot a variety of chart patterns and technical setups across different markets—like having a seasoned trader with a photographic memory on your team.
Assists traders in identifying potential market opportunities and risks faster and more accurately, cutting through the noise.
Offers Basic, Pro, and Premium plans designed to match different levels of trading complexity and support needs—because one size never fits all in trading.
Lets traders choose a plan that fits their experience and budget without sacrificing access to essential features.
Enables you to set automated alerts based on price points, trend shifts, or indicator signals across multiple timeframes, so you’re never caught off guard.
Keeps you updated in real time, making it easier to respond swiftly to market movements—kind of like having a trading buddy who’s always on call.
Combines essential analysis tools with cutting-edge AI enhancements, offering a broad suite of market evaluation methods to cover all your bases.
Equips traders with versatile tools to sharpen and improve their strategies, aiming for better outcomes with a bit less guesswork.
Using TrendSpider alongside TradingView indicators lets traders verify signals with algorithmic precision, which usually helps nip human errors in the bud and gives confidence a nice little boost.
TradingView is a powerhouse platform that shines with its advanced technical analysis capabilities and a strong social networking edge. It arms users with a rich selection of indicators and seamless brokerage links, though unlocking its full potential usually means opting for higher-tier subscriptions. The platform’s sophistication does come with a learning curve, and since it leans heavily toward technical rather than fundamental analysis, it’s truly a gem for those who live and breathe charts.
Best for active and trend traders who thrive on advanced charting, technical indicators, and community insights, as well as anyone looking for smooth brokerage integration across multiple devices.
 | |
|---|---|
| Advantages | Limitations |
Advanced Charting Tools Offers a wide variety of chart types and customizable drawing tools that let you dive deep into technical analysis with ease. If you love tinkering with charts, this one won’t disappoint. | Premium Features Behind Subscription Tiers Many of the cooler, advanced tools and indicators come locked behind pricier Pro+ or Premium plans, so be ready to open your wallet if you want the full shebang. |
Extensive Library of Technical Indicators Gives users access to a treasure trove of built-in and community-created indicators, perfect for anyone looking to really get a handle on market nuances. | Steep Learning Curve for Beginners With so many bells and whistles, newcomers might find themselves scratching their heads at first—it definitely takes some patience and practice to get comfortable. |
Community-Driven Social Networking Lets users share trading ideas, strategies, and charts, fostering a collaborative vibe that helps traders across the globe learn from each other’s wins and missteps. | Occasional Latency During High Market Volume At peak trading times, you might notice the platform slowing down a bit, which isn’t ideal when every second counts in decision-making. |
Multi-Device Accessibility Allows smooth trading and analysis whether you’re at your desk, on your phone, or lounging with a tablet—making it a breeze to keep tabs on the market no matter where life takes you. | Limited Fundamental Analysis Tools The focus is firmly on technical analysis here, so if you’re on the hunt for in-depth fundamental data, you might feel a bit left out. |
Brokerage Integration Connects with major brokers for real-time market data and lets you place orders right within the platform, cutting out the hassle of switching back and forth. | |
Global User Base for Diverse Perspectives Taps into a vast and lively worldwide community, bringing a colorful mix of viewpoints that can really broaden your market analysis horizons. | |
If you’re diving into trend trading, especially with TradingView indicators at your side, you’re in for a ride. These tips aim to help you wring every drop of value out of those tools, so you’re not just trading blindly but with a bit of savvy and flair.
Regularly reviewing and tweaking your indicator settings is key to keeping some of the best indicators on TradingView synced with ever-shifting market conditions, which helps maintain their edge. TradingView’s lively social community is a goldmine where traders swap ideas and collaborate on strategies while staying on top of fresh scripts and updates.

Struggling to improve your trading performance? Edgewonk's advanced analytics tools are designed to give you the edge you need.
With detailed trade journaling, robust strategy analysis, and psychological insights, you'll gain a comprehensive understanding of your strengths and weaknesses. Don't miss out on this game-changing opportunity.

Known for demystifying complex derivatives trading through accessible education, this former Wall Street trader turned educator empowers retail investors with institutional-level strategies.
Read PostsDiscover the step-by-step process to enable TradingView on Tradovate, unlocking seamless trading com...
Discover how to locate the paper trading tab on TradingView and use it to practice trading without r...
Unlock the power of the TradingView Profiler with this guide that breaks down volume profile reading...
Discover how to set up paper trading in TradingView with this step-by-step beginner’s guide. Gain co...