


Technical Analysis
How to Trade a Wedge Falling Pattern
Discover the wedge falling pattern's secrets and learn step-by-step how to trade this powerful techn...
Engulfing candles really make a splash as a powerful candlestick pattern in technical analysis, frequently hinting at potential trend reversals.
Engulfing candles are unique candlestick patterns on price charts where a single candle completely swallows the body of the previous one—no leftovers. There are two flavors: bullish engulfing, which hints at a potential upward turnaround, and bearish engulfing which often signals the market might be gearing up for a downward slide.
Picture a tug-of-war between buyers and sellers with the previous candle showing the sellers firmly holding their ground. Then out of nowhere a powerful wave of buyers yanks the rope so hard it completely knocks the sellers off balance.
Engulfing candles hold a special place in technical analysis because they often point to potential reversals in the flow of price movements. Traders tend to eyeball these engulfing patterns together with volume data and trend analysis, trying to get a better grip on just how strong and trustworthy the signal really is before pulling the trigger on any decisions
Many people tend to believe engulfing candles by themselves always shout a reversal is on its way. While they can pack a punch as indicators, you really need to take a step back and look at the whole picture including the ongoing trend, volume and other technical clues.
Not all engulfing candles carry the same weight and some scream louder than others. To find the most trustworthy signals traders usually look at a few key things: the candle's size, the trading volume behind it, where it sits within the trend and how the price behaves afterward.
Keep an eye out for an engulfing candle that is noticeably bigger than the ones before it. This usually signals serious momentum building up.
Make sure the pattern appears at a vital spot such as near trend reversals or key support or resistance levels because context really matters here.
Check for volume that is higher than usual alongside the engulfing candle. It’s the market’s way of raising its hand to confirm real buying or selling action.
Watch the candles that come next closely. They may keep the trend going or break important levels. That detail can make all the difference.
This pattern shines brightest when it fits with the bigger market picture. Engulfing signals that line up with other analysis tend to be most reliable.
Applying these criteria together is like having a trusty filter that helps traders sift through weaker or misleading signals, so they can zero in on setups that actually stand a fighting chance.

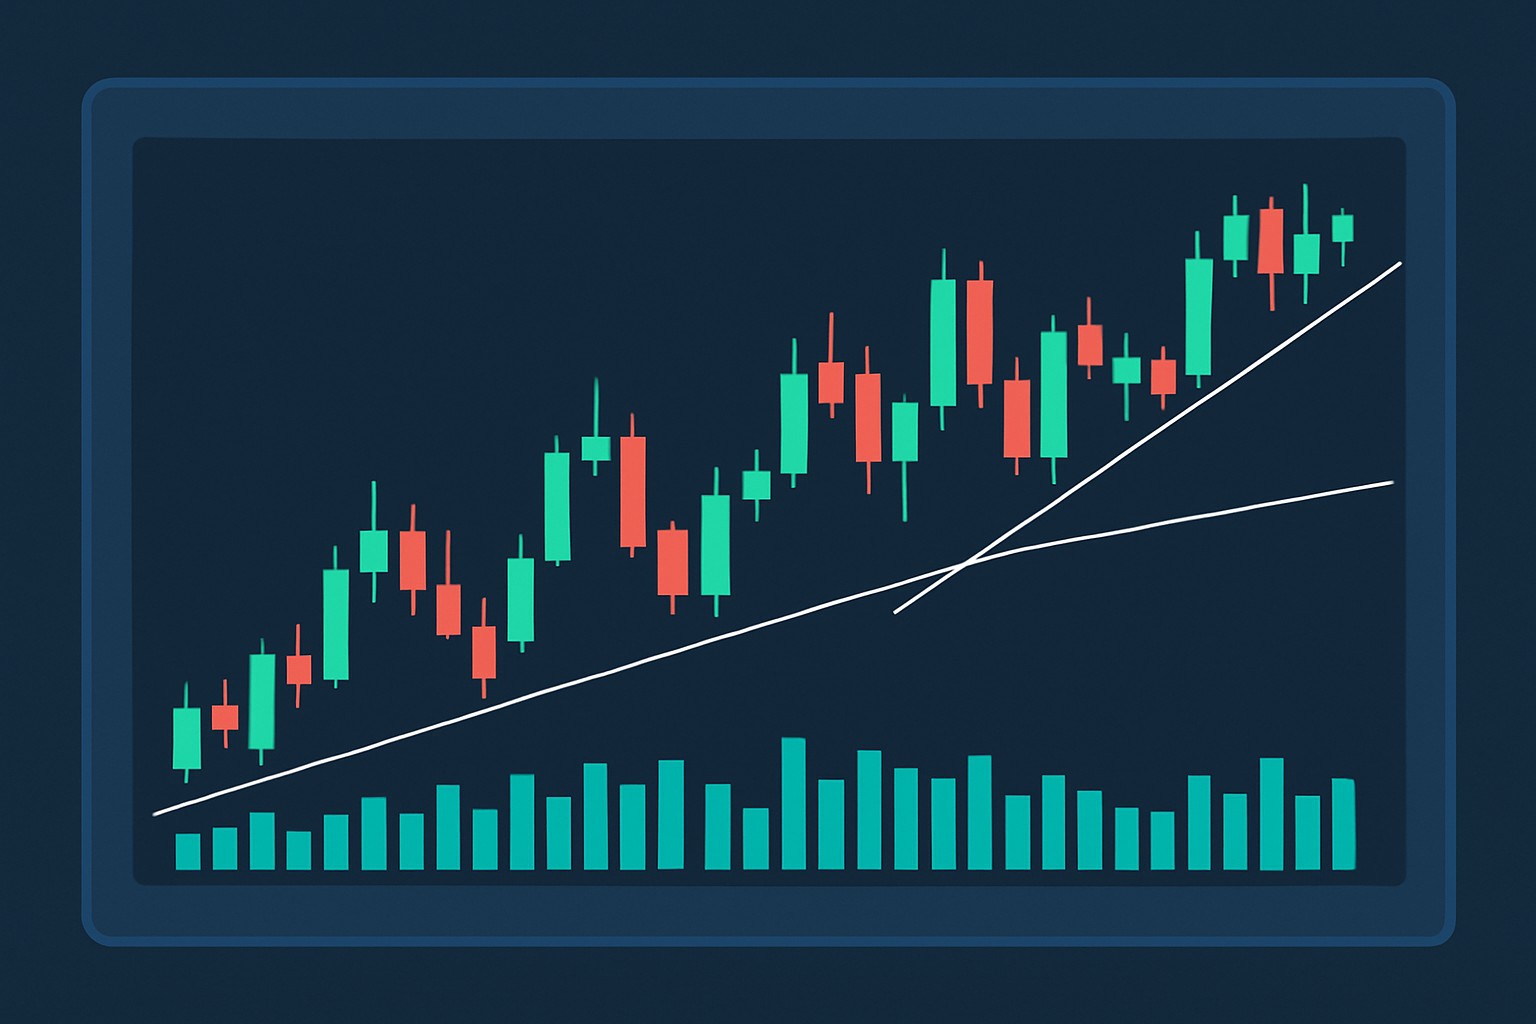
Chart illustrating bullish and bearish engulfing candles alongside volume for clearer signal interpretation
Let us dive into some real trading charts that showcase engulfing candles igniting key price moves. We will stroll through strong bullish and bearish engulfing patterns, explore how their signals tend to confirm and point out a few warning signs of false signals.
By paying close attention to engulfing candles in all sorts of market conditions, traders usually get the hang of spotting real signals and tuning out the noise.
Engulfing candles really shine when they are woven into a broader trading strategy that mixes in other technical indicators and a healthy dose of disciplined risk management.
Using engulfing candles effectively takes a bit of patience and a touch of practice.
Many traders trip up on engulfing candles because they miss the forest for the trees or rush into trades without a solid thumbs-up from the market. They also get their wires crossed mistaking candle wicks for actual bodies.
Engulfing candle signals tend to pack a bit more punch when a few indicators are all singing from the same hymn sheet. It’s worth checking these patterns against volume and the broader trend—kind of like getting a second (or third) opinion—so you’re not putting all your eggs in one basket based on a single factor.

Tired of missing opportunities and making suboptimal trading decisions? TrendSpider's cutting-edge platform automates complex technical analysis, saving you time and reducing human error.
With multi-timeframe analysis, dynamic alerts, backtesting, and customizable charting, you'll gain a competitive edge in identifying trends and making informed trades across global markets.

Transforming the field of commodities trading through sustainable investing principles, she bridges traditional finance with ESG considerations.
Read PostsDiscover the wedge falling pattern's secrets and learn step-by-step how to trade this powerful techn...

Hidden bullish divergence is a key technical indicator revealing strong buying pressure beneath unce...

Discover how to recognize the evening star candlestick pattern—a powerful signal highlighting potent...
Trend lines are essential tools in technical analysis that help traders identify market direction an...