


Technical Analysis
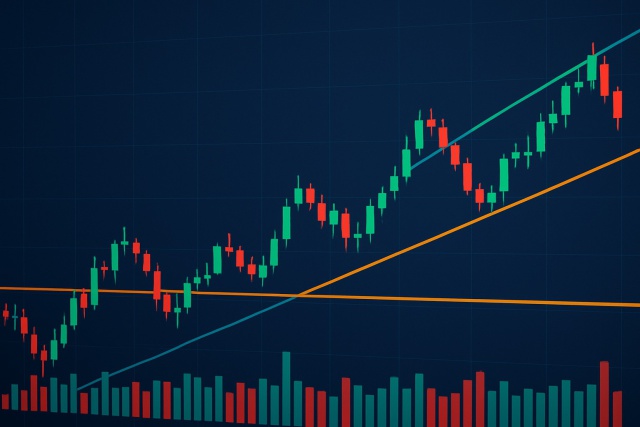
What Is a Trend Line in Technical Analysis?
Trend lines are essential tools in technical analysis that help traders identify market direction an...
Candlestick reversal patterns are handy tools in technical analysis that give traders a nudge when a market trend might be about to take a turn.
It’s worth taking a moment to really grasp what a candlestick chart is showing us. Each candlestick paints a little story of price movement over a set period and neatly captures the opening, closing, high and low prices.
Candlestick reversal patterns are distinctive shapes that often give a heads-up about a possible shift in price trends, flipping from up to down or vice versa. Traders tend to keep a keen eye on these patterns since they can offer those early hints on when to jump into or bail out of a trade
No candlestick reversal pattern can promise a trend will flip on a dime; rather, they hint at a stronger possibility that it might. In my experience, confirmation along with cautious risk management remains key to actually making those trades pay off.
A handful of candlestick patterns often serve as pretty reliable signals when it comes to spotting trend reversals. Getting a feel for how they form and what they’re trying to tell you can definitely give you a bit more confidence in anticipating market moves.
Two classic candlesticks that often sneak up on traders just when you think you’ve got the trend figured out.
A powerful signal kind of like a double take that screams reversal if you ask me.
These patterns are like the sun rising and setting on market sentiment. each tells its own story.
The ultimate indecisive character in the chart embodying hesitation and the calm before the storm.
Think of these as the market’s way of dropping subtle hints that a shift might be brewing.
They look a bit like each other but have very different vibes. sort of like market déjà vu with a twist.
Because in the world of charts there’s always a few wildcard patterns ready to surprise you.
The Hammer and Hanging Man are single-candle patterns shaped like a capital 'T' with a small real body near the top and a long lower wick stretching down. Think of a Hammer as a sign that a downtrend might be ready to end and turn bullish. A Hanging Man tends to wave a caution flag for a bearish reversal after prices have been rising. The real trick is knowing where these patterns appear.
Let's dive into engulfing patterns, a classic favorite when it comes to spotting potential market turnarounds. Whether bullish or bearish, these patterns often serve as subtle whispers from the market, hinting that something’s about to shake things up. They may look simple on the surface, but in my experience, they pack a punch when you know where to look.
Engulfing patterns are all about two candles where the second candle's body completely covers or "engulfs" the first one. In a Bullish Engulfing pattern the market has been on a downward swing and then a larger bullish candle follows a smaller bearish one—kind of like a comeback kid—hinting that buyers might be stepping back into the ring. Conversely a Bearish Engulfing shows up after an uptrend when a bigger bearish candle swallows a smaller bullish candle and waves a red flag for potential selling pressure. These patterns often point to shifts in momentum because they reflect a swift change in market mood.
These three-candle patterns often pop up as pretty reliable signals of a strong reversal. Take the Morning Star for instance. It usually appears after a downtrend starts winding down. It kicks off with a long bearish candle followed by a small indecisive one, often a Doji, and then wraps up with a bullish candle that closes comfortably inside the first candle's body. On the flip side, the Evening Star flips the script as a bearish pattern showing up after an uptrend and tracing out the opposite sequence of candles.
Doji candlesticks pop up when the open and close prices are practically neck and neck and paint a picture of market indecision. You’ll come across a few varieties such as the classic Doji, the Dragonfly Doji with a long lower wick, and the Gravestone Doji which flaunts a long upper wick like it’s trying to make a point.
The Piercing Line and Dark Cloud Cover are two classic two-candle reversal patterns that hint at upcoming shifts toward bullish or bearish trends. When you spot a Piercing Line after a downtrend, you’ll see the first candle playing the bearish role followed by a bullish candle that closes well within the previous candle’s body and climbs above its midpoint—kind of like a little comeback story. On the flip side, Dark Cloud Cover flips the script: after an uptrend, a bullish candle gets overshadowed by a bearish one that closes deeply inside the prior candle’s body.
The Shooting Star and Inverted Hammer are single-candle patterns that catch the eye with their long upper shadows and small bodies. You will spot a Shooting Star after an uptrend. Although buyers push prices higher initially to keep momentum going, sellers firmly take the reins by the close, suggesting a possible bearish reversal. Meanwhile, the Inverted Hammer tends to show up after a downtrend.
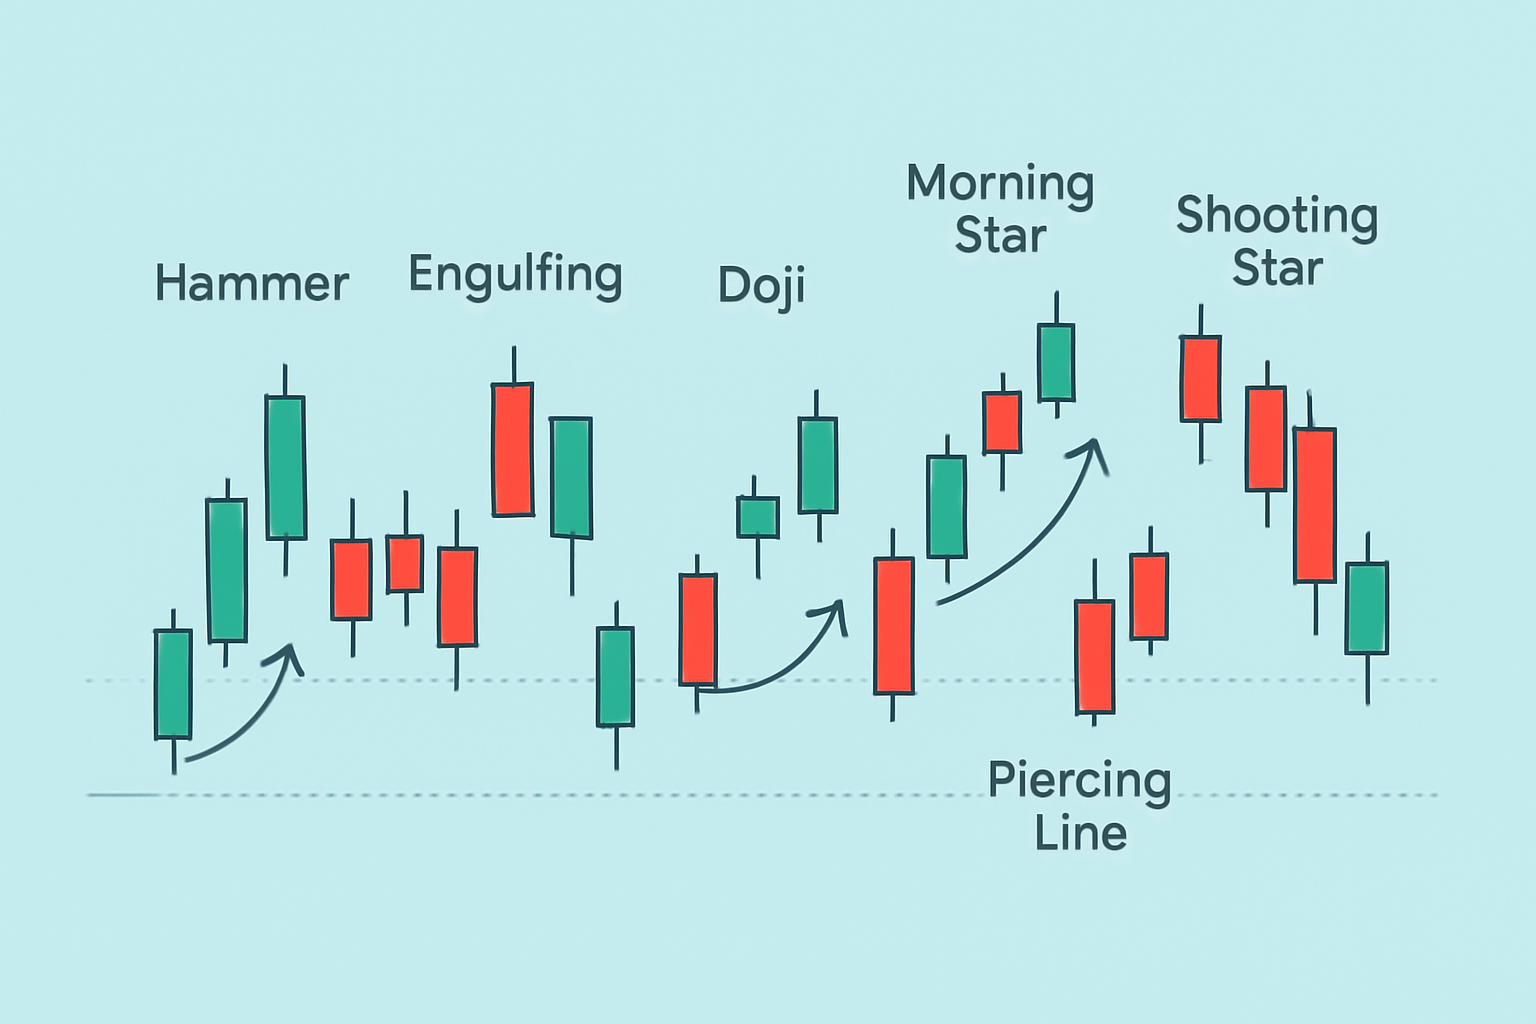
Visual guide to common candlestick reversal patterns and their price chart formations
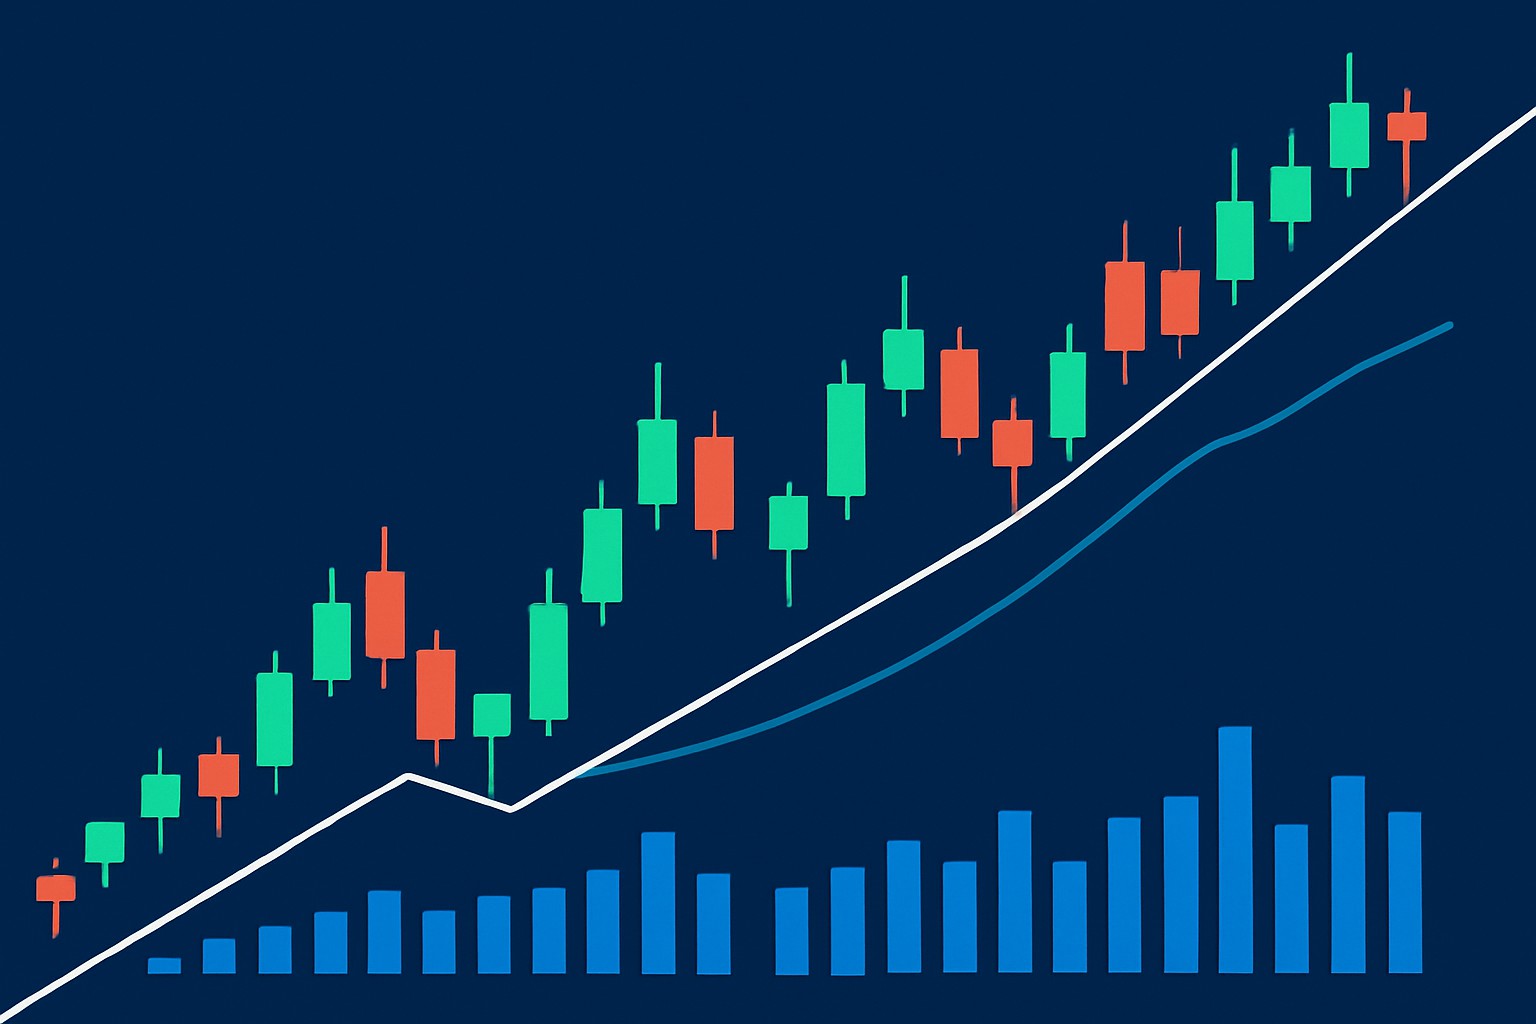
Candlestick reversal patterns can occasionally send false alarms on their own. Savvy traders usually pair these patterns with other tools like volume analysis, trend indicators and support or resistance levels.
Even seasoned traders can occasionally trip up when reading reversal patterns. It’s common to put too much faith in a single candle or miss the bigger trend by ignoring it. They may also jump into trades before the confirmation candle has fully closed.
To make the most out of candlestick reversal patterns, traders often blend them with other analysis techniques and develop steady reliable habits.

Struggling to improve your trading performance? Edgewonk's advanced analytics tools are designed to give you the edge you need.
With detailed trade journaling, robust strategy analysis, and psychological insights, you'll gain a comprehensive understanding of your strengths and weaknesses. Don't miss out on this game-changing opportunity.

With 20 years experience in commodity trading, Jasper provides insights into energy markets, precious metals, and agricultural futures with a focus on macroeconomic trends.
Read PostsTrend lines are essential tools in technical analysis that help traders identify market direction an...

Discover how to recognize the evening star candlestick pattern—a powerful signal highlighting potent...

Learn how the True Range indicator captures market volatility and price swings, empowering traders t...

Master the momentum indicator to gauge price speed and trend strength. This ultimate guide covers ca...