


TrendSpider
Is TrendSpider Worth It for Swing Traders?
Wondering if TrendSpider is worth it for swing trading? This detailed pros and cons guide breaks dow...
This guide walks you through building a custom technical indicator from scratch using the TrendSpider platform—consider it your friendly companion in market analysis.
TrendSpider is a solid automated technical analysis platform designed to boost your trading strategies with advanced charting tools and AI-powered insights. One of its standout features is the ability to create custom indicators tailored to your trading style. This guide will walk you through building a TrendSpider custom indicator from scratch and break everything down into clear bite-sized steps that won’t overwhelm you.
Custom indicators in TrendSpider give traders the freedom to cook up their own calculations and visualizations, going way beyond the usual off-the-shelf tools. TrendSpider comes with a proprietary scripting language that’s designed to feel intuitive and laser-focused on the nitty-gritty of technical analysis.
Familiarize yourself with the TrendSpider interface and find the custom indicator editor. This is your playground where you’ll write and tweak your scripts and give them a test run.
Sign in to your TrendSpider account and open the charting window.
Next, head to the "Indicators" menu and pick "Custom Indicators" from the list.
Click on "Create New Indicator"—this will bring up the scripting editor where you can code, preview your work and save it when you’re happy. It’s straightforward once you get going.
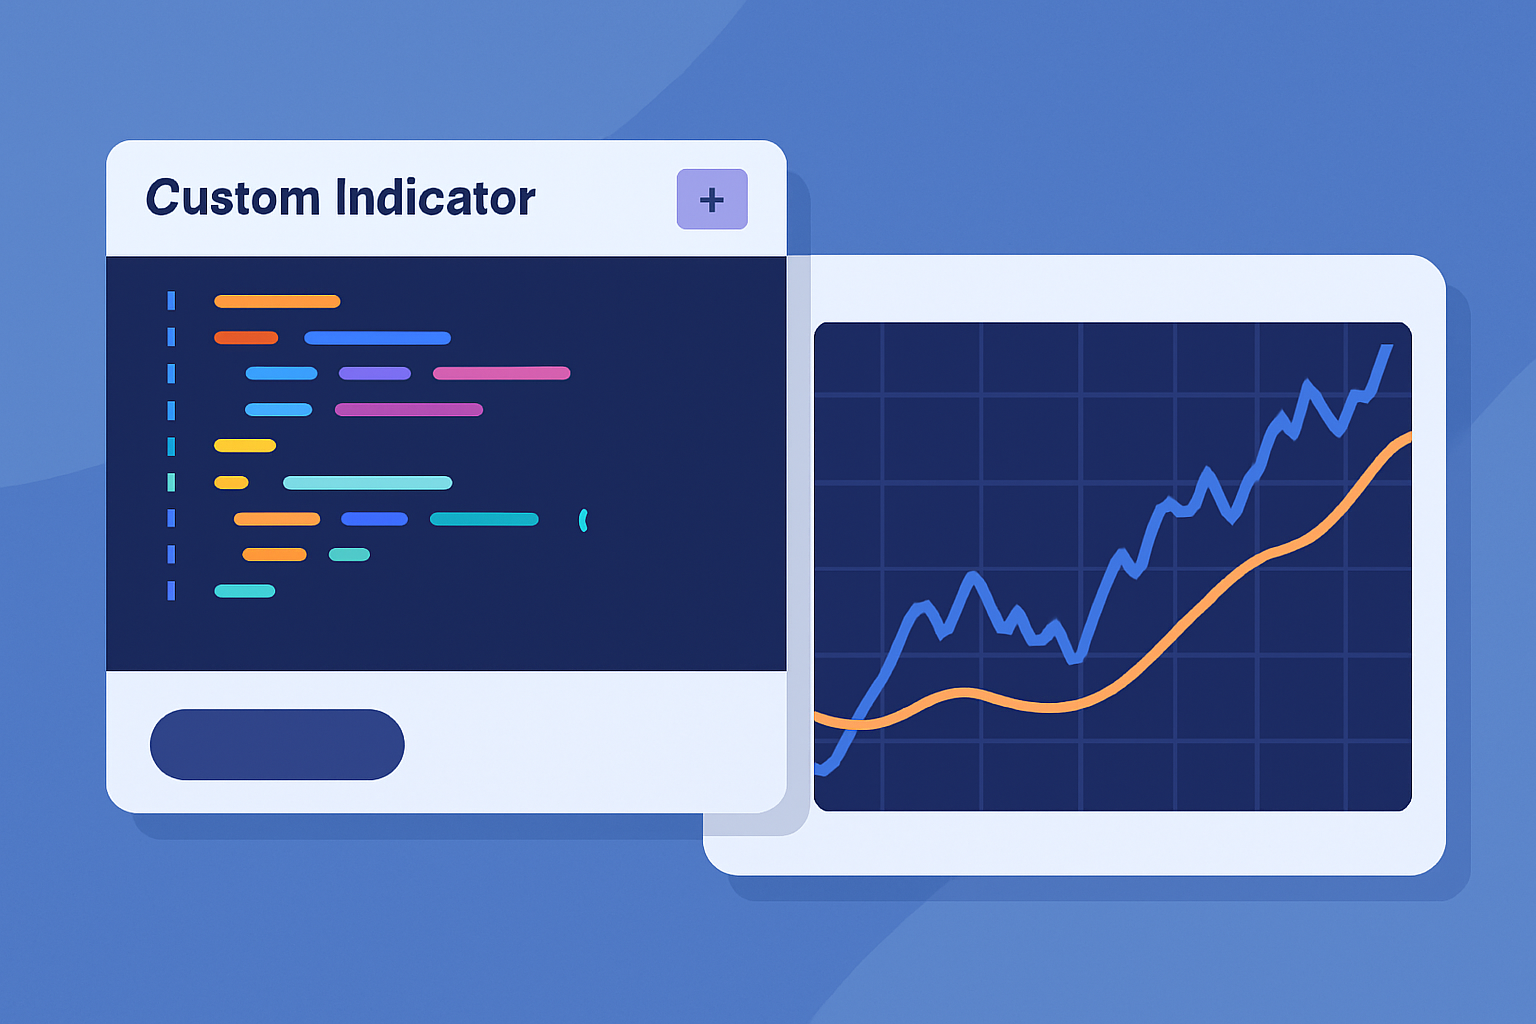
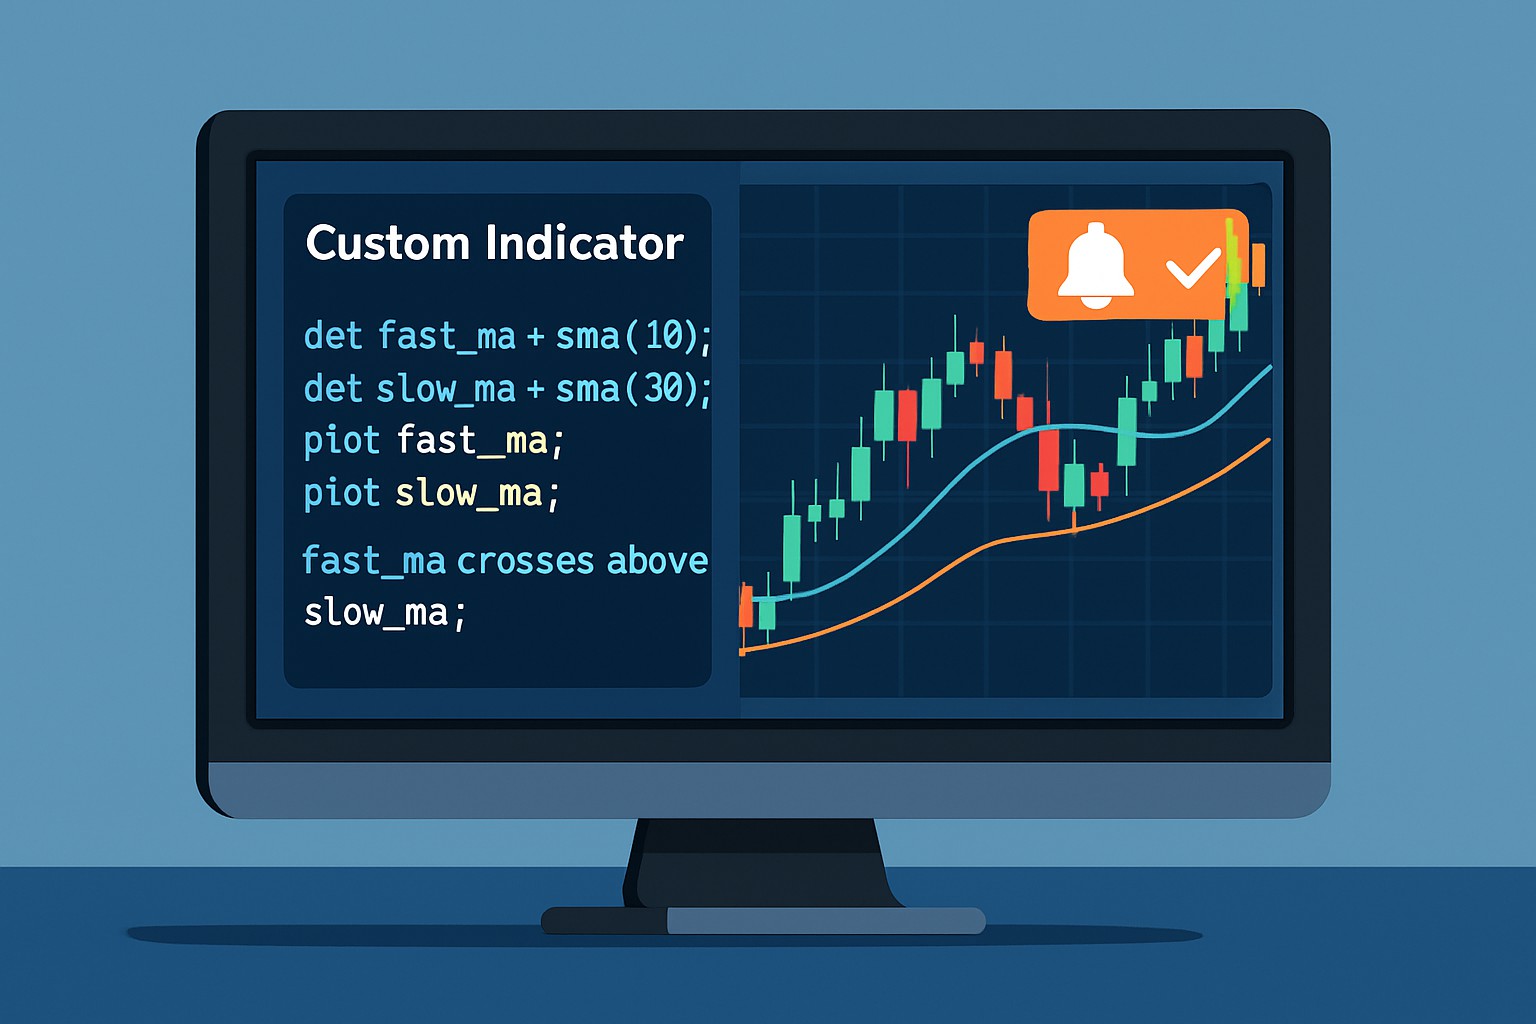
TrendSpider custom indicator editor displaying script input area and chart preview for testing code
Start off by zeroing in on the exact trading problem your custom indicator aims to tackle. Having this clear as day not only guides you in choosing the right inputs but also keeps your indicator nimble and straightforward to use.
Turn your indicator idea into TrendSpider's scripting language by setting variables and doing some math with your inputs. You can use built-in functions for averages or differences. If you are feeling adventurous, craft your own formulas from scratch.
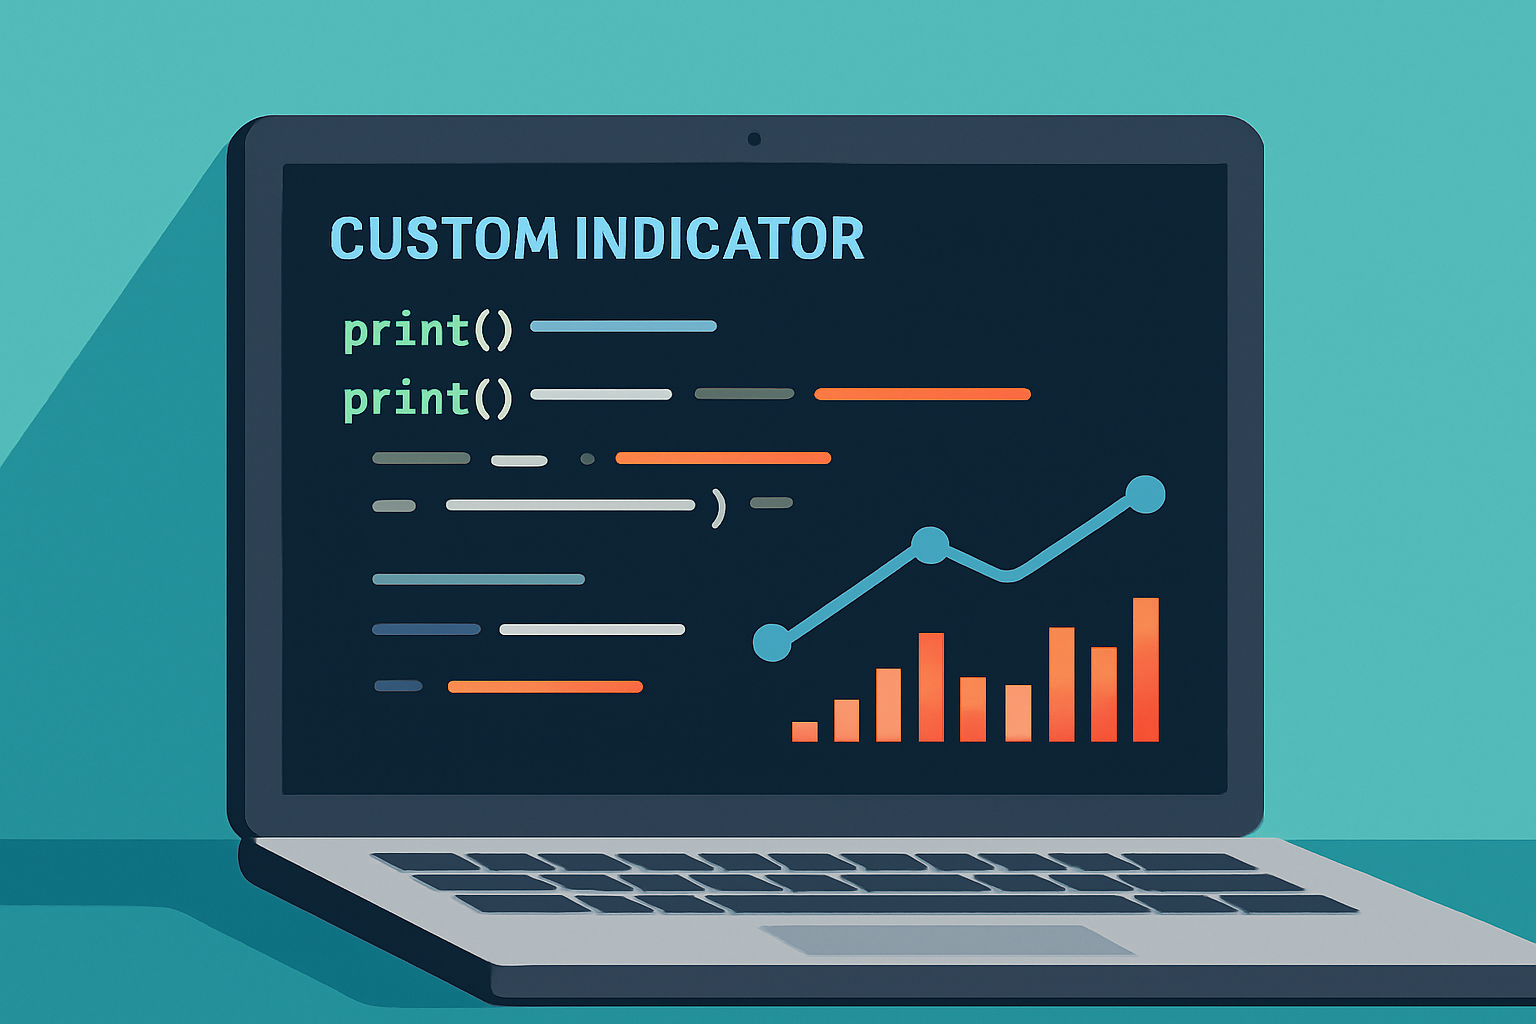
Example of debugging custom indicator code in TrendSpider with printed variables and test plots
Now comes the fun part—putting that indicator right where the action happens on your chart. This step lets you see all those numbers and signals come to life, making the data a lot less abstract and, dare I say, a bit more exciting. So, buckle up and get ready to visualize your progress in a way that is both insightful and, hopefully, a little more intuitive.
Visualization is key when it comes to making sense of your indicator's signals. Thanks to TrendSpider's handy plotting functions you can effortlessly add lines, histograms or markers directly onto your price charts. Plus you get to customize colors and line styles which really helps keep things neat and easy to tell apart. When your indicator comes with multiple bits and pieces like moving averages and thresholds you can plot them all together without losing clarity by styling each element thoughtfully.
| Parameter | Expected Values | Usage Example |
|---|---|---|
| color | Named colors or hex codes, you know, anything from "red" to "#FF5733" works just fine | plot(value, color="red") |
| style | line, histogram, or dots — the usual suspects when it comes to plots | plot(value, style="line") |
| width | Integer from 1 to 5, because sometimes size does matter | plot(value, width=2) |
| overlay | true or false (plots right on the price or keeps it neat in a separate pane) | plot(value, overlay=true) |
Really get the most out of TrendSpider’s dynamic alert system by including conditional statements in your script that catch key events like crosses or threshold breaches.
Craft conditional expressions in your script that clearly spell out when an alert should fire. Think of it as setting a trap for the moment the price jumps above a moving average.
Link these conditions with alert functions right inside the TrendSpider editor so your notifications appear exactly when you need them, not a moment too soon.
Be mindful when setting alert frequency because nobody wants to drown in a sea of alerts. Keep it balanced to focus only on the signals that really count and avoid alert fatigue.
Now comes the fun part—putting your custom indicator through its paces and seeing what it’s really made of. Testing isn’t just a formality here; it’s the vital step where you find out if your creation holds water or needs a bit of TLC. In my experience, patience during this phase pays off big time, especially when you start fine-tuning your tool to catch those subtle market signals. So, grab a cup of coffee, roll up your sleeves, and get ready to tweak, test, and improve until everything clicks into place just right.
Thorough testing is your best friend when it comes to ensuring your custom indicator performs smoothly across a variety of market conditions and securities. TrendSpider’s backtesting tools let you roll up your sleeves and dive into historical data, uncovering any quirks or weak spots along the way.
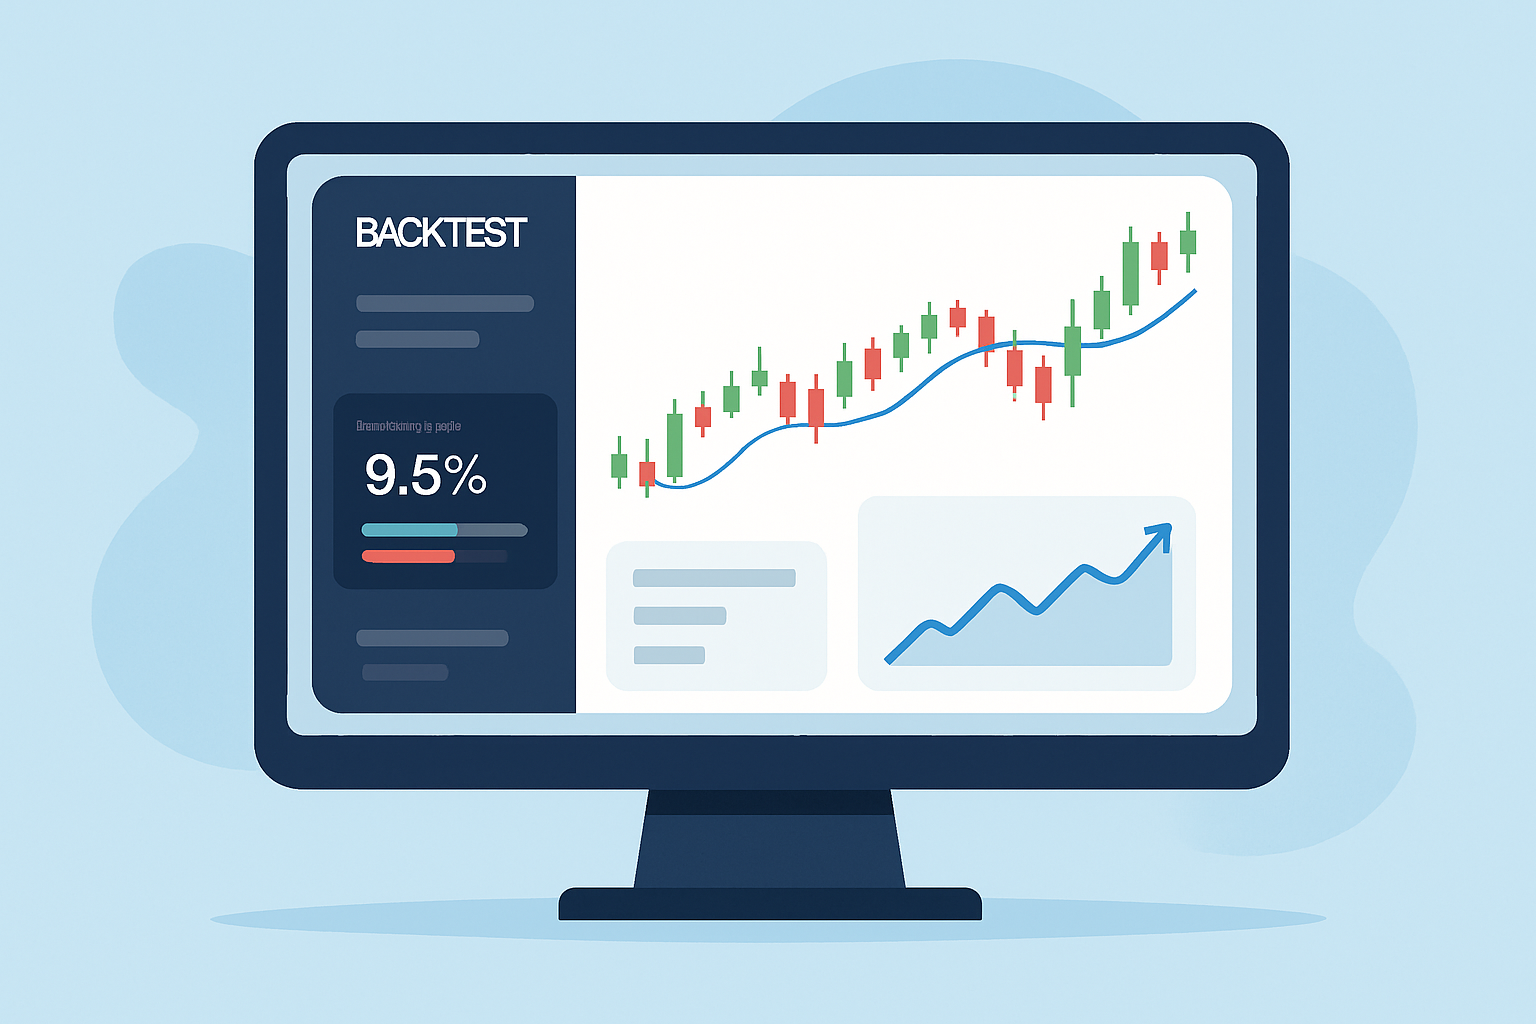
Backtesting and performance evaluation of a custom indicator in TrendSpider using historical market data
Think syntax errors or sluggish performance. Unexpected logic quirks can also sneak up on you. Getting to know these common headaches early and leaning on clear debugging and optimization techniques can really save the day.
Once you've put the finishing touches on your TrendSpider custom indicator, be sure to take full advantage of the platform's handy saving and sharing features to keep your hard work safe and share it with the community. It's a good idea to give your scripts clear descriptive names and use version control—it's a lifesaver when tracking updates over time.

Struggling to improve your trading performance? Edgewonk's advanced analytics tools are designed to give you the edge you need.
With detailed trade journaling, robust strategy analysis, and psychological insights, you'll gain a comprehensive understanding of your strengths and weaknesses. Don't miss out on this game-changing opportunity.

Transforming the field of forex trading through his systematic approach to currency pair analysis, he focuses on macroeconomic indicators and central bank policy impacts.
Read PostsWondering if TrendSpider is worth it for swing trading? This detailed pros and cons guide breaks dow...

Discover if TrendSpider software’s advanced automated technical analysis tools justify the cost for...

Wondering how much TrendSpider costs and how it stacks up against other platforms? This comprehensiv...

Unlock faster, smarter trading with the TrendSpider Chrome Extension. Learn how it integrates automa...