


Technical Analysis
Why Hidden Bullish Divergence Can Signal Strong Buying Pressure
Hidden bullish divergence is a key technical indicator revealing strong buying pressure beneath unce...
The spinning top candlestick pattern is quite the player in technical analysis, especially when you are on the hunt for potential market reversals.
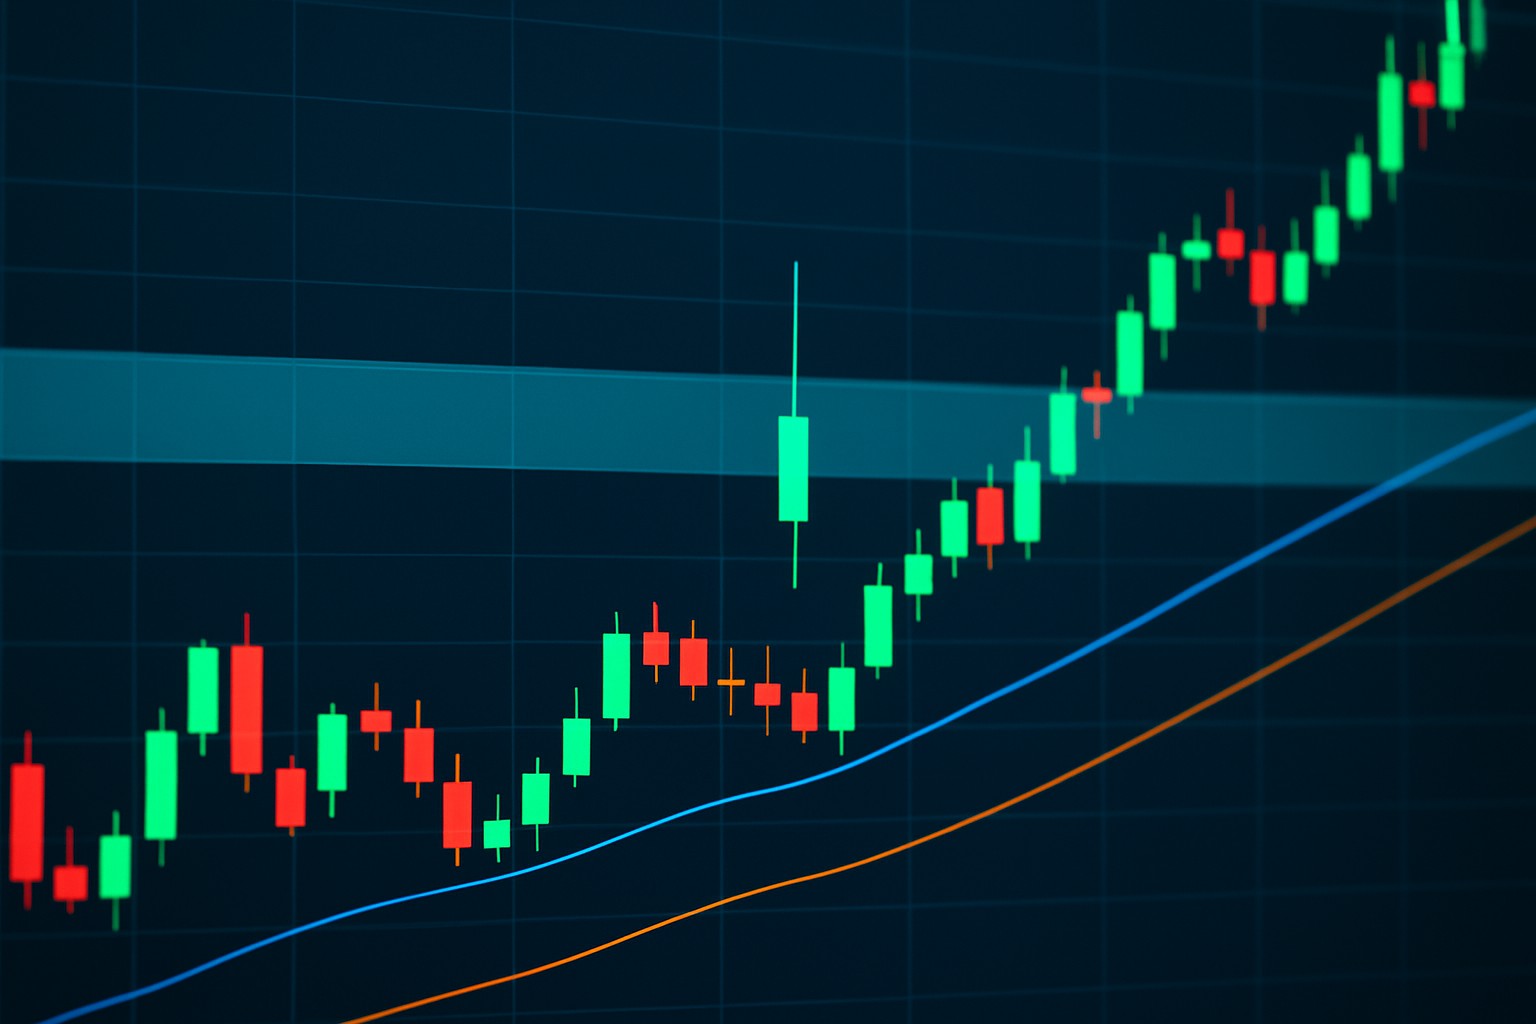
Candlestick charts paint a clear picture of price movements over a specific timeframe using four key data points: the opening price, the highest price, the lowest price, and the closing price.
Candlestick patterns are a visual showdown between buyers and sellers, capturing that ongoing tug-of-war in the market and throwing up some pretty important clues about what individuals are thinking. Once traders get to know these patterns a bit better, they can often pick up on subtle signals hinting at potential price moves.
A spinning top is a type of candlestick featuring a small real body sitting pretty much in the middle of its range, flanked by long upper and lower shadows. This pattern usually points to a bit of market indecision, suggesting that neither buyers nor sellers really had the upper hand during the trading session
Spinning tops sport a small but noticeable body, unlike those sneaky doji candlesticks that barely show any real body at all—making spinning tops a bit easier to catch with the eye. Evening star or morning star patterns often carry stronger reversal vibes, while spinning tops usually act as tentative early warning signs that call for a second look before jumping to conclusions.
The psychology behind spinning tops really captures that uneasy feeling of market uncertainty. When you see a small body flanked by long shadows on both sides it’s like bulls and bears having a tug of war and pushing prices up and down but ending in a stalemate. This back-and-forth dance often suggests the current trend is running out of steam as buyers and sellers hit the pause button—hinting at a possible slowdown or even a sneak reversal in the trend.
When spinning tops pop up after a solid run either up or down, they often hint that the current trend could be running out of steam or gearing up to switch lanes.
Spot spinning tops by giving those candlestick charts a good, close look across various platforms. Keep an eye out for candles that show up with tiny real bodies nestled between long upper and lower shadows.
Picking the right timeframe really does matter. Daily and hourly charts tend to give clearer insights without drowning you in a sea of noise. On the flip side, those super short timeframes can sometimes throw up signals that leave you scratching your head.
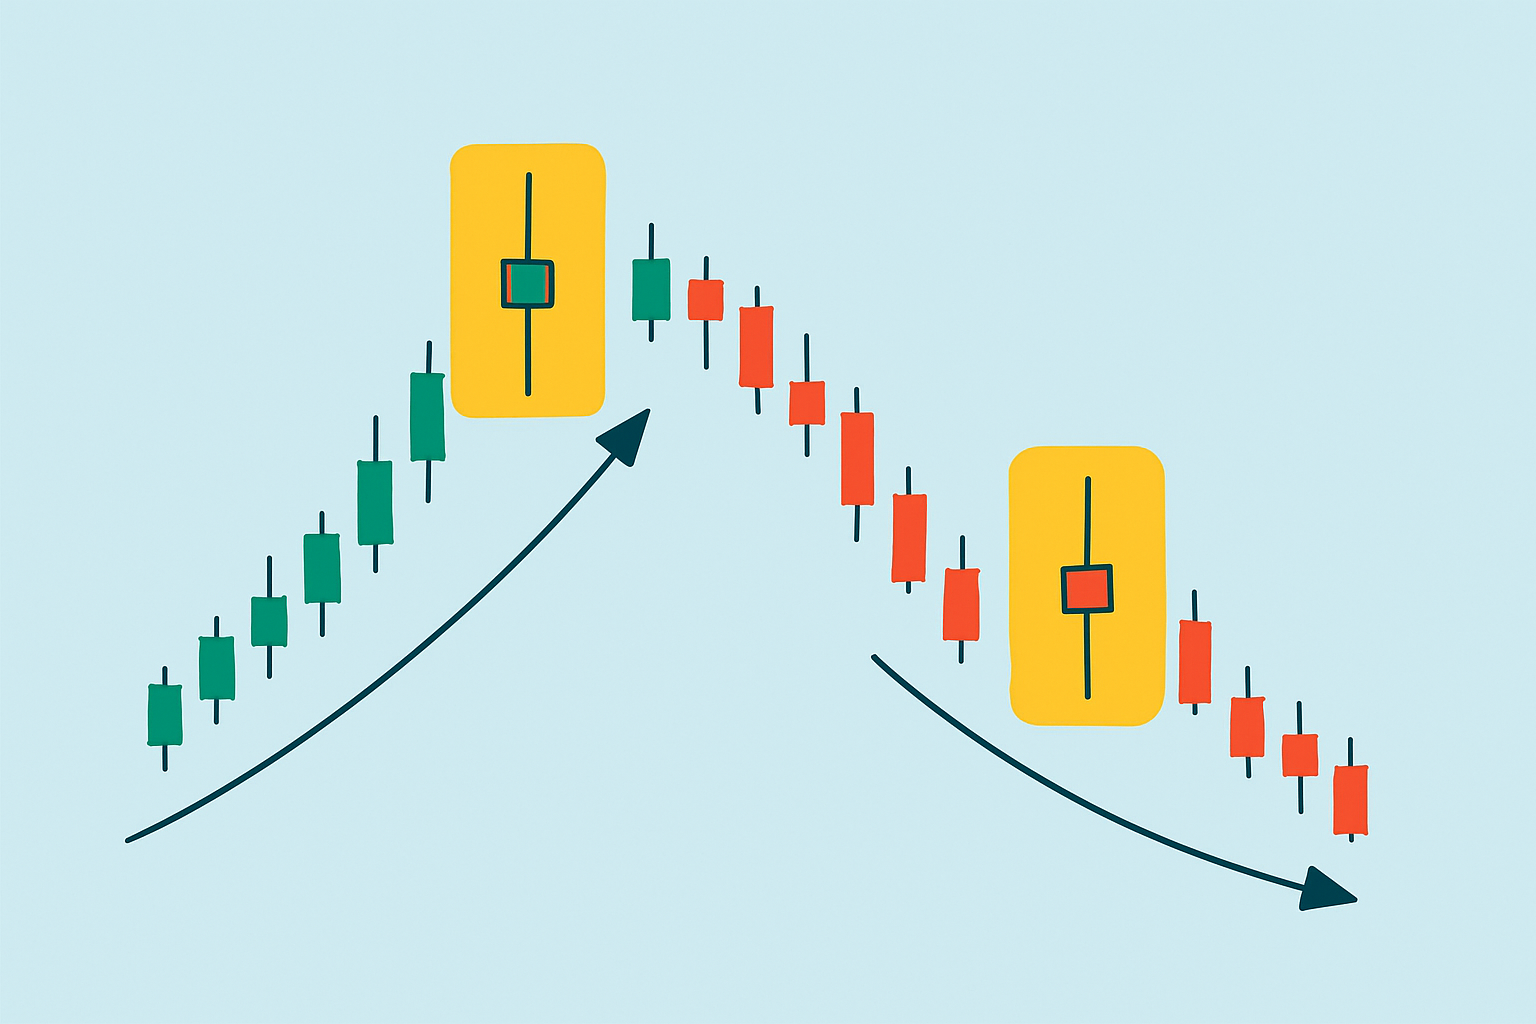
Example chart image showing clear spinning top candlestick patterns in an uptrend and downtrend to visually demonstrate spotting
The spinning top pattern offers some handy clues about potential reversals, though it rarely gives you the full picture by itself. When you pair it with other technical indicators, it usually does a much better job of confirming signals and helps cut through the noise of false alarms.
Interpreting a spinning top alongside these tools usually paints a clearer picture. For instance, when a spinning top pops up near resistance and works with an RSI divergence it often signals a potential reversal. This helps traders step in with more confidence.
Using spinning top patterns in real trading usually means mixing sharp pattern recognition with solid risk management and good old-fashioned confirmation steps. It is easier when you have a clear game plan for entries and know exactly where to place your stop-loss orders. Having a solid exit strategy helps lock in profits.
Keep an eye out for a spinning top candle that appears after a well-established trend. It is like the market catching its breath before doing something interesting.
Take a peek at indicators such as RSI, volume and moving averages to see if a reversal might be quietly sneaking up.
Enter near the close of the spinning top candle or wait for the next candle to confirm that reversal.
Place a stop-loss just beyond the latest swing high or low to keep your risk comfortably in check. It is better to be safe than sorry.
Set your profit targets based on recent support or resistance levels or rely on sensible risk-to-reward ratios. It’s all about playing it smart.
Keep one eye on the trade and be ready to adjust your stops if the trend shifts as expected because protecting gains is half the battle won.
It is key to keep solid risk management front and center and not lean too heavily on spinning tops alone. Platforms like TradingView or TrendSpider often step up your game by mixing pattern recognition with advanced indicators and alerts
Traders often fall into the trap of assuming that every spinning top candlestick pattern spells a reversal, without taking a step back to look at the bigger market picture or the volume data. Misreading these candles or zooming in on the wrong timeframes can easily lead to some less-than-stellar decisions.
"Spinning tops often behave like yellow traffic lights in trading—nudging you to hit the brakes or at least proceed with a wary eye, rather than slamming on the brakes for a full stop. In my experience, blending these signals with a wider market perspective can really help you navigate the twists and turns with a bit more confidence and a lot less guesswork."

Are you tired of juggling multiple tools for your trading needs? TradingView is the all-in-one platform that streamlines your analysis and decision-making.
With its powerful charting capabilities, real-time data, and vibrant community, TradingView empowers traders like you to stay ahead of the market. Join thousands who trust TradingView for their trading success.

Driven by a passion for democratizing financial markets, he creates accessible trading education content that bridges the gap between complex strategies and retail investors.
Read PostsHidden bullish divergence is a key technical indicator revealing strong buying pressure beneath unce...
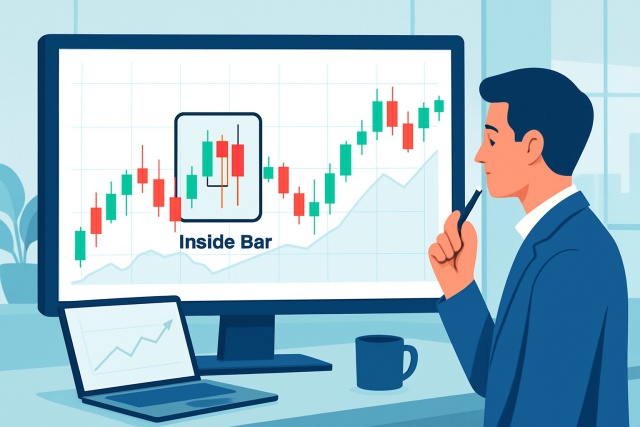
Discover how inside bar patterns signal key market pauses and possible breakouts or reversals. This...
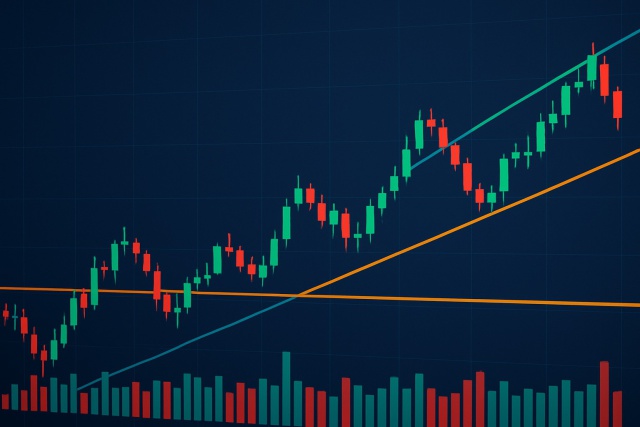
Trend lines are essential tools in technical analysis that help traders identify market direction an...

Discover how to recognize the evening star candlestick pattern—a powerful signal highlighting potent...