


Technical Analysis
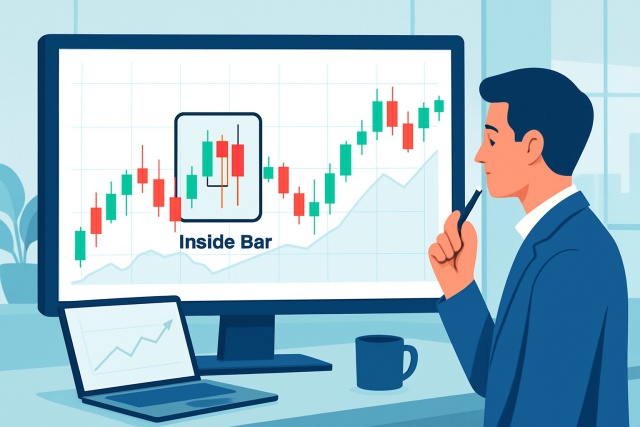
Inside Bar Pattern To Spot Breakouts And Reversals
Discover how inside bar patterns signal key market pauses and possible breakouts or reversals. This...
Triangle patterns are among the most trusty and well-known chart formations in technical analysis. They give traders and investors handy hints about potential price moves by highlighting moments of consolidation that usually precede a big breakout or breakdown. Recognizing these patterns can help market participants predict trends and manage risk more effectively and make smarter trading decisions.
Triangle patterns pop up on price charts when price movements begin to squeeze tighter, forming trendlines that come together to create a neat little triangle shape. These patterns typically signal times when the market is feeling a bit indecisive or just taking a breather, often leading up to a big price move—either soaring upward or dropping down.
Triangle patterns pop up when trendlines traced over price highs and lows converge, outlining the triangle’s edges. You’ll often notice volume quietly drying up as the pattern forms, only to burst back onto the scene when the breakout finally unfolds. Breakouts tend to happen near the triangle’s apex, though this can shift depending on how far along the pattern is across various timeframes.
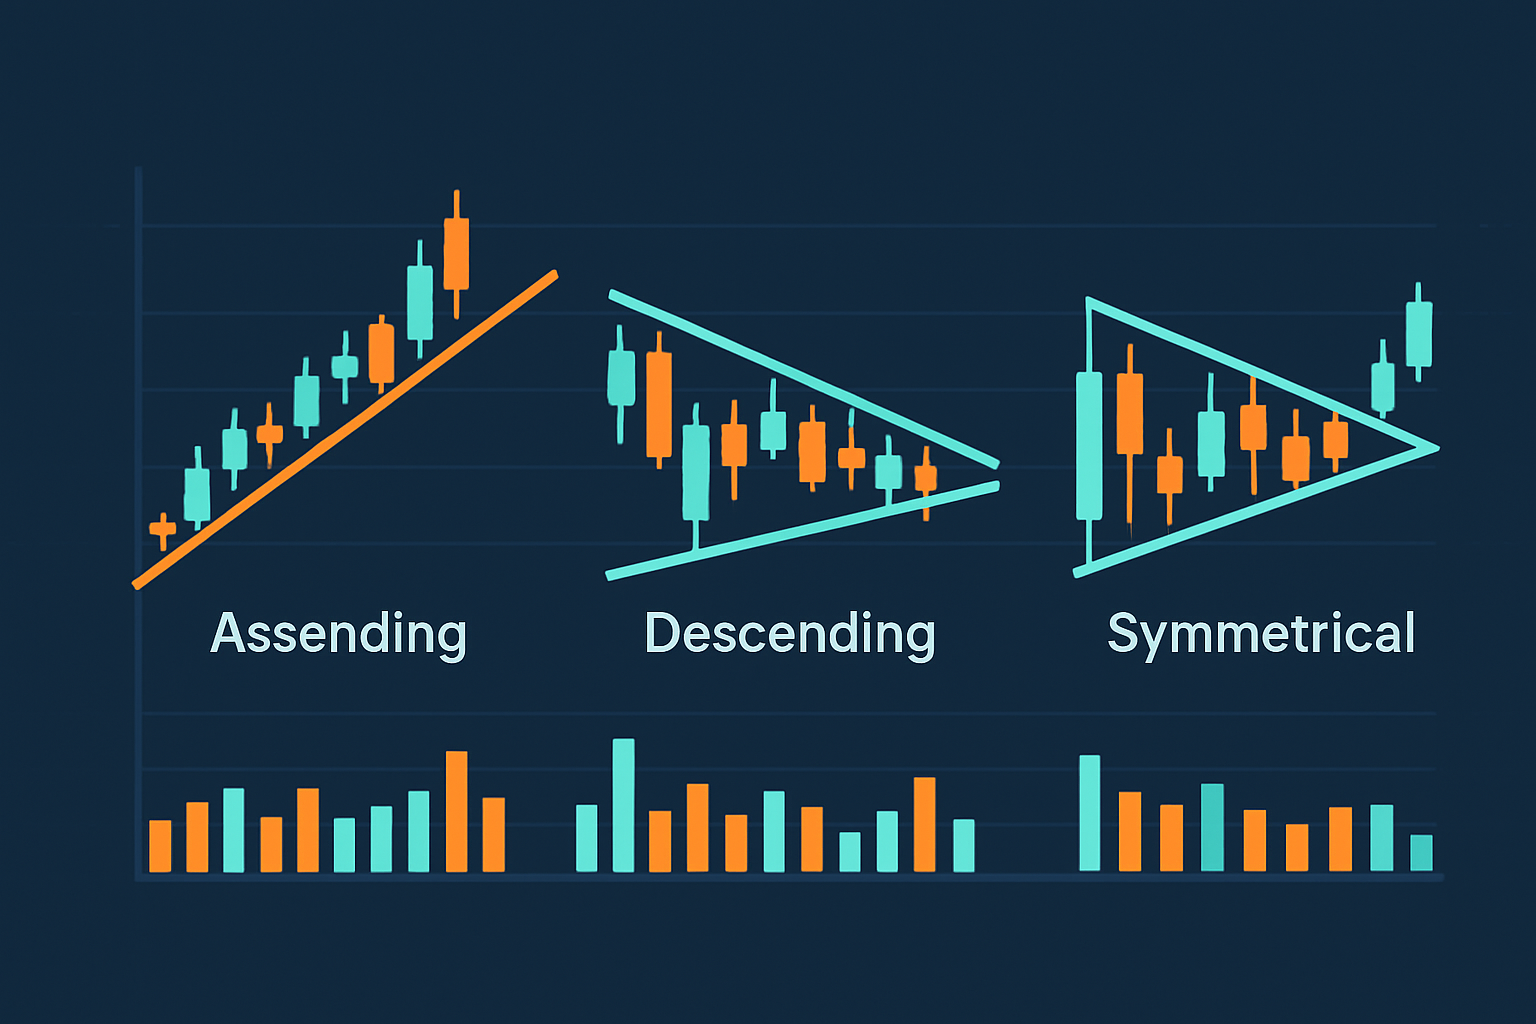
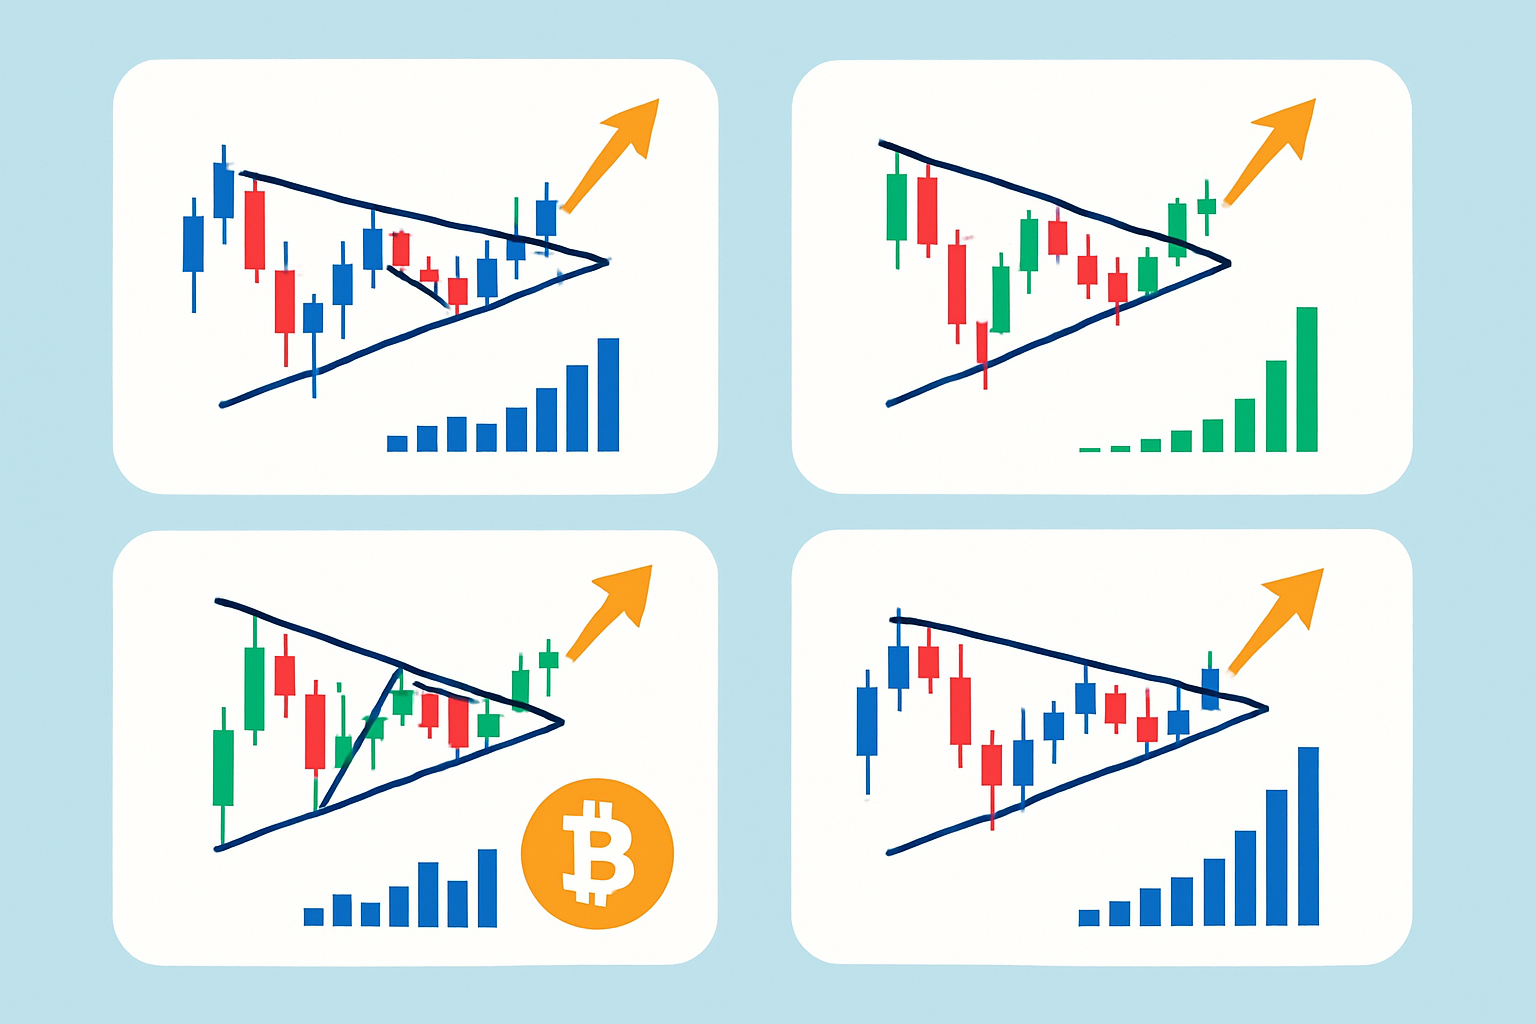
Illustration of the three main triangle patterns with annotated trendlines and volume indications
Knowing the unique traits of each triangle pattern gives traders a leg up in anticipating likely market moves. Each pattern reflects different market temperaments and momentum and serves as a handy visual clue on whether a trend is poised to stick around or take a sharp turn.
An ascending triangle appears when the price action clamps down on a flat resistance level while the lows steadily creep higher toward that line. Key clues to watch for are tightening price ranges and a noticeable uptick in volume as the pattern nears a breakout.
Descending triangles pop up when you have a steady horizontal support line paired with a resistance trendline that’s steadily marching downward, pushing the highs lower each time. This setup often signals that the bears are starting to call the shots.
Let's dive into the world of symmetrical triangles—a pattern that’s as classic as it gets in technical analysis. Picture a tug-of-war where the bulls and bears are pulling with almost equal strength, creating a shape where the price highs and lows start to squeeze closer together. It’s a setup that often signals a big decision point is near, and traders keep a keen eye on this pattern, hoping to catch the next big move.
Symmetrical triangles pop up when the support and resistance trendlines converge at roughly the same angle, signaling a tug-of-war between buyers and sellers. This pattern usually hints at market uncertainty or a period of consolidation, with the breakout ready to swing either way.
Identifying triangle patterns requires a careful step-by-step approach that works across different chart types like candlestick, line and bar charts. Traders need to keep a close eye on price action and spot those highs and lows that start to crowd together. Then they double-check for confirmation by watching how the pattern matures and how volume trends play out.
Check out the current trend leading up to the pattern—it’s often the best clue to guess which way the breakout might swing.
Draw trendlines that connect at least two key highs and lows that come together like puzzle pieces toward a single point.
Keep a close eye on volume—it usually takes a nosedive as the pattern shapes up then spikes right when the breakout shows its face.
Make sure the pattern is really fleshed out with clear price compression and a range that’s tightening nicely.
Breakouts tend to happen near the apex but stay on your toes since they can pop off a little earlier before the triangle fully settles in.
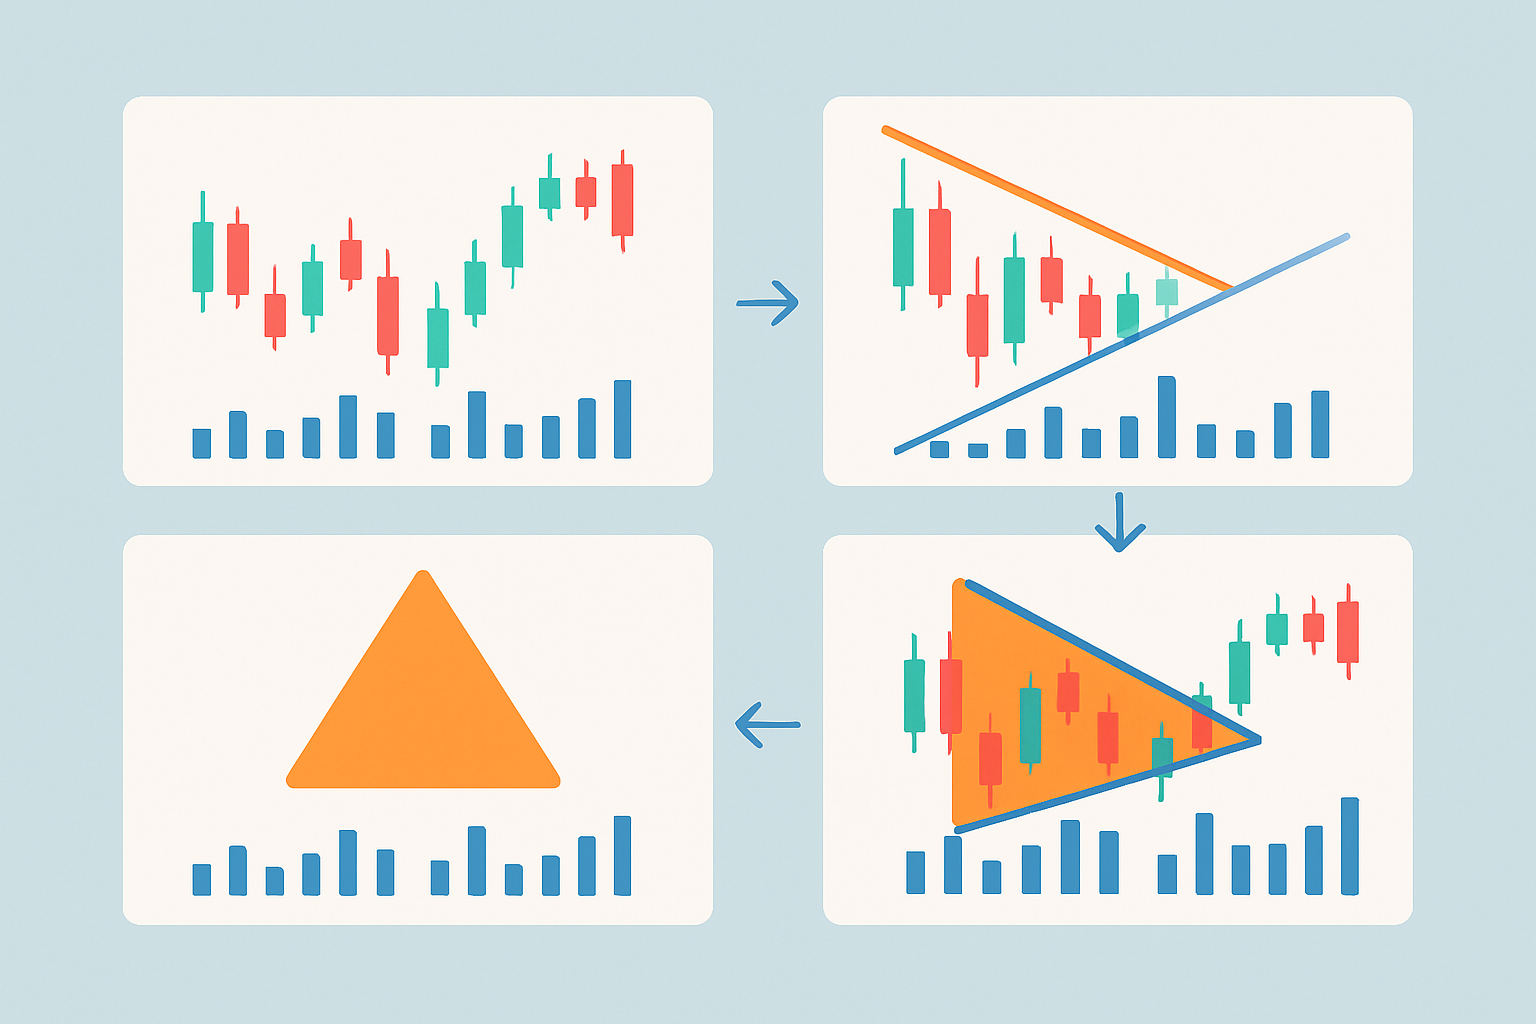
Visual guide demonstrating the identification and confirmation of triangle patterns on a candlestick chart
Volume often plays an important role in confirming triangle patterns and sizing up how powerful a breakout might be. Usually you’ll notice volume taking a bit of a nosedive as the pattern develops, signaling a market lull. When volume revs back up at those breakout points, it’s a solid hint that real momentum is kicking in.
When it comes to triangle patterns, traders often find themselves at a crossroads, trying to decode the subtle signals these shapes send. These patterns, while seemingly simple, can actually be quite the puzzle—but with a bit of patience and a dash of savvy, they reveal some pretty useful clues about potential market moves. So, whether you’re a seasoned pro or just dipping your toes in the trading waters, understanding how to approach these triangle formations can make a noticeable difference in your strategy.
Effective trading strategies shine when they make the most of triangle patterns by combining them with clear entry and exit rules and careful risk management. Once a triangle appears on the chart, most traders patiently wait for a convincing breakout before jumping in. After that, they usually size up potential price targets based on the pattern's dimensions and thoughtfully set stop losses to protect themselves from false signals or unexpected reversals.
Hold off until the breakout from the triangle pattern is supported by a noticeable uptick in volume before jumping into a trade. Patience pays here.
Size up your potential price target by measuring the height of the triangle at its widest spot. This gives you a rough idea of where things might head.
Set your stop losses just below the breakout point if you’re going long or just above it if you’re taking a bearish stance. Little cushions can save you big headaches.
Always check volume to confirm the strength behind the breakout and tweak your position size based on that to make all the difference.
And don’t forget to keep your trading timeframe front and center. Adjust your targets and stops to fit the overall market vibe and volatility because context really is king.
Stepping into or out of any situation smoothly can make all the difference—it's one of those little details that often go unnoticed, but trust me, individuals notice when you get it right. Whether you’re making an entrance or quietly slipping away, there’s a knack to it that’s worth paying attention to. After all, first and last impressions tend to stick around longer than we expect. So, buckle up and let’s dive into some tips that’ll help you master the art of comings and goings, without breaking a sweat.
You should only jump into a trade once the price has clearly broken above resistance or dropped below support and when that move is supported by a noticeable spike in volume. This little trick goes a long way in cutting down those pesky false signals. Typically, it is a smart move to place stop orders just a tad beyond the breakout point to keep risks comfortably in check.
The foundational ideas that keep projects on track and prevent surprises from knocking you sideways.
Managing risk is absolutely key when trading triangle patterns if you want to keep your capital safe. Typically, your position size hinges on the gap between your entry point and stop loss with the goal of risking a small slice of your account on each trade. Stops should be placed thoughtfully just beyond critical reversal levels to avoid getting stopped out by usual market jitters. Discipline is your best friend. It means resisting the urge to jump on impulsive trades during early breakouts and staying laser-focused on ever-changing market conditions so you can tweak your risk on the fly.
Although triangle patterns might seem straightforward at first glance, many traders trip up when trying to spot them correctly due to common slip-ups. Mistakes usually come from drawing trendlines too subjectively, ignoring volume confirmation, or expecting breakouts too early. Confusing wedges or flags with triangles adds to the confusion and can lead to regrettable trade decisions.
"Successful technical analysis usually boils down to two biggies: precision and a whole lot of patience. I have found that waiting it out for crystal-clear confirmation and taking a good, hard look at patterns like triangles often pays off with way better trade results. It’s like they say, slow and steady gets the trade winning." – Jane Smith, Certified Market Technician
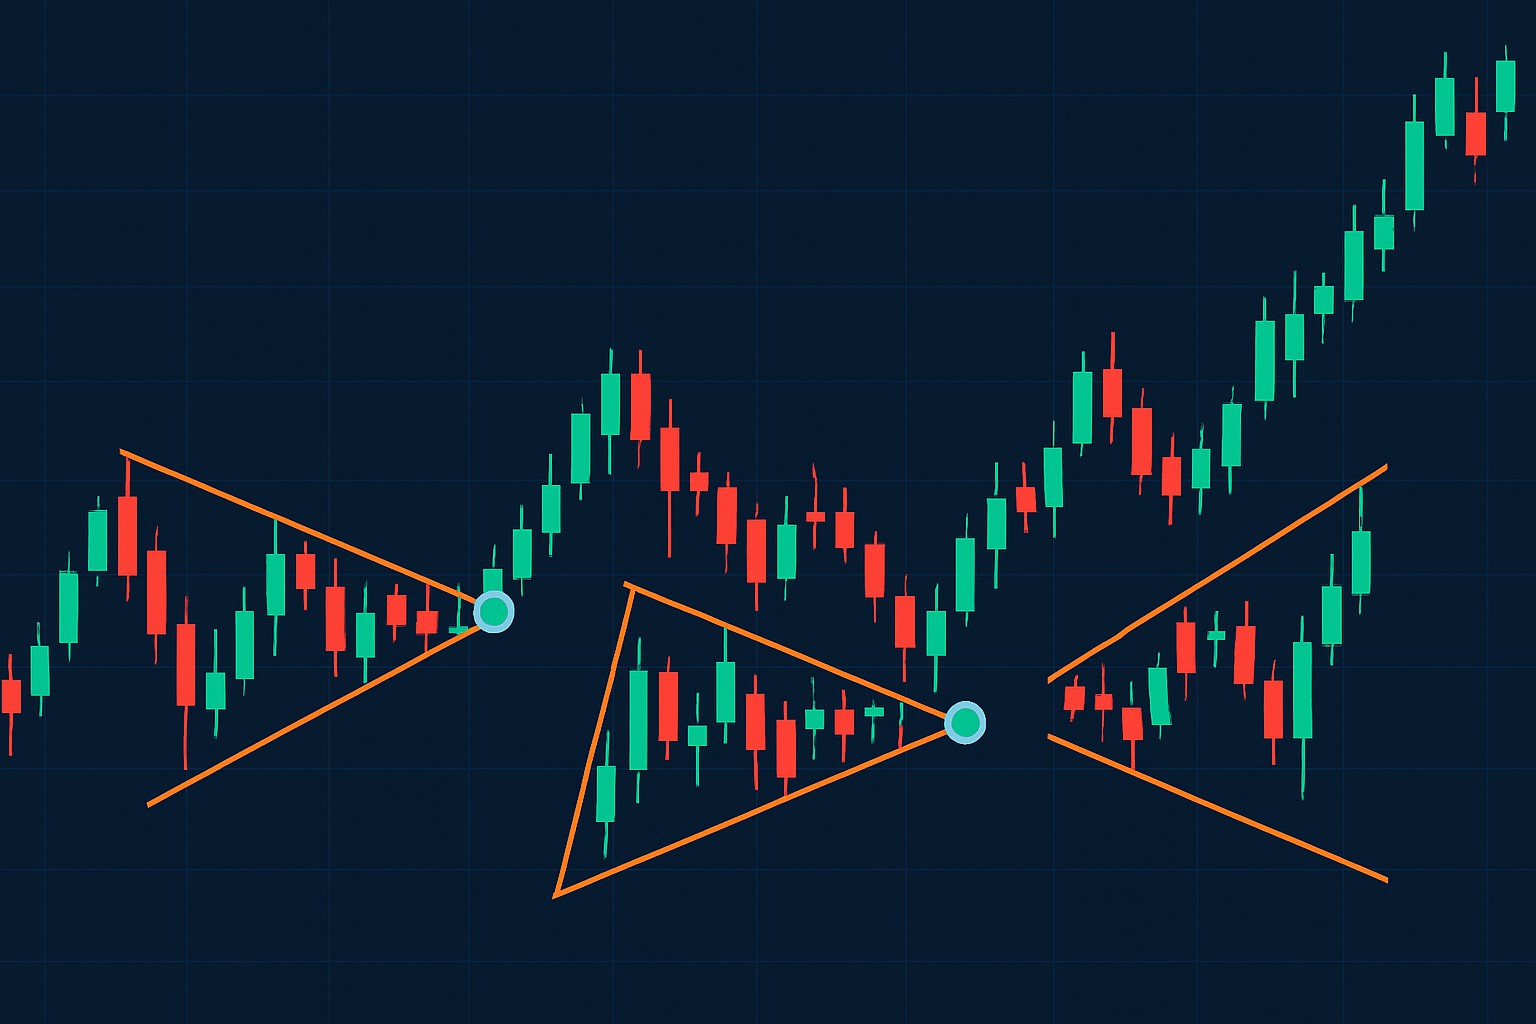
Triangle patterns often pop up as trusty signals pointing to major price moves across the board whether you’re diving into stocks, forex or cryptocurrencies. Take a well-known ascending triangle in a big tech stock that sparked a pretty impressive bullish rally and delighted investors. On the flip side, descending triangles in forex pairs have a solid track record of foreshadowing serious breakdowns.
Examples of ascending, descending, and symmetrical triangle patterns identified in real-world markets with breakout highlights
Sometimes, when you are wrestling with those tricky triangle patterns, pairing them up with other indicators can be a real game-changer. It’s like having a trusty sidekick in your trading toolkit—offering clarity when things get murky. In my experience, combining these patterns with complementary signals often paints a fuller picture and helps dodge those sneaky false alarms. So buckle up, because blending these tools just might be the secret sauce you have been looking for.
Combining triangle patterns with other technical indicators usually packs a stronger punch for trading signals. Oscillators often confirm momentum and moving averages clarify the trend direction. Indicators based on volume and Fibonacci retracement levels add solid extra confirmation to fine-tune the strategy and keep risk in check.
Several charting platforms and tools help traders nail down triangle patterns with more precision thanks to features like slick drawing tools and automatic pattern detection. TradingView shines here with robust charting capabilities, built-in social networking, and a treasure trove of technical indicators. It is a top pick for those who want both deep market insights and a lively community vibe. TrendSpider takes things up a notch with AI-powered pattern recognition and the ability to analyze multiple timeframes at once. This can save a ton of time when setting up trades.

Are you tired of juggling multiple tools for your trading needs? TradingView is the all-in-one platform that streamlines your analysis and decision-making.
With its powerful charting capabilities, real-time data, and vibrant community, TradingView empowers traders like you to stay ahead of the market. Join thousands who trust TradingView for their trading success.

Transforming the field of forex trading through his systematic approach to currency pair analysis, he focuses on macroeconomic indicators and central bank policy impacts.
Read PostsDiscover how inside bar patterns signal key market pauses and possible breakouts or reversals. This...

Discover the wedge falling pattern's secrets and learn step-by-step how to trade this powerful techn...
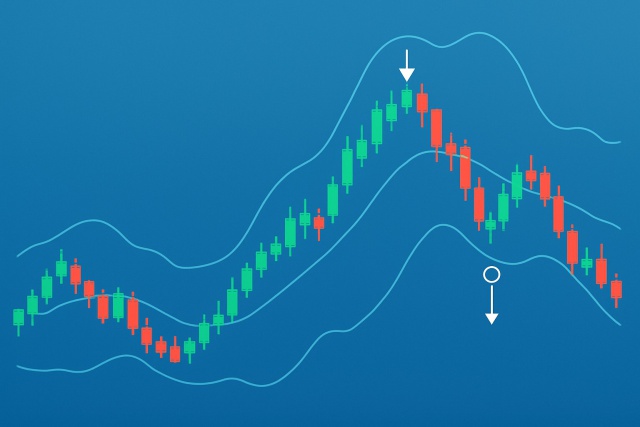
Master trading with Bollinger Bands by understanding volatility, setup patterns, and risk management...
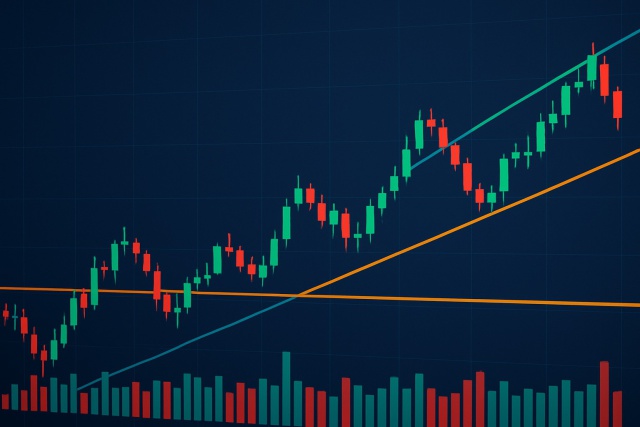
Trend lines are essential tools in technical analysis that help traders identify market direction an...