


Technical Analysis
How to Trade a Wedge Falling Pattern
Discover the wedge falling pattern's secrets and learn step-by-step how to trade this powerful techn...
Hammer and inverted hammer candlestick patterns are classic go-to tools in technical analysis that often hint at potential market reversals when you least expect it. This article dives into what these candlesticks mean, why they matter more than you might think and how traders—whether you are a newbie or a seasoned pro—can put them to good use.
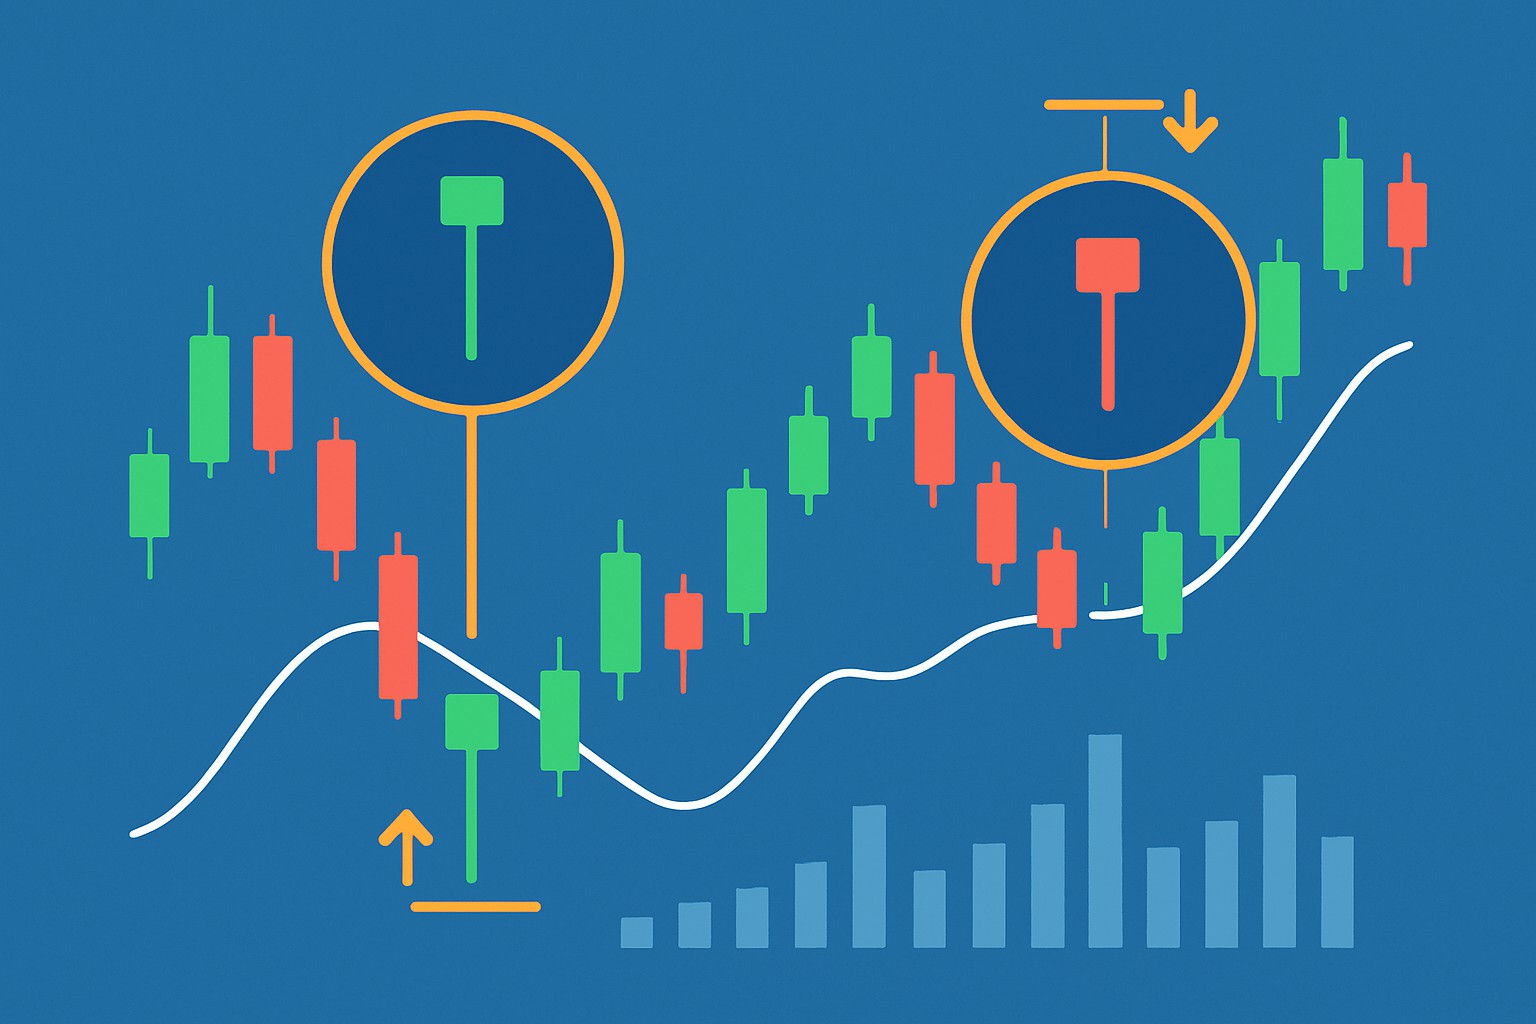
Candlestick charts are the bread and butter of technical analysis and offer a clear snapshot of price movements over various stretches of time—whether minutes, hours, days or weeks. Each candlestick is like a little story spotlighting four key price points: the open, close, high and low. The candle's body shows the space between the open and close while the little shadows capture price extremes like the market’s mood swings. When you string these candles together, patterns start to form that can hint at the market’s sentiment and momentum or potential turning points. They lay bare the ongoing tug-of-war between buyers and sellers.
The hammer and inverted hammer are single-candle patterns famous for their distinctive shapes that often hint at a possible price reversal. Both sport a small real body paired with a long shadow, but the key difference lies in where that shadow makes its appearance. The hammer features a long lower shadow with the tiny body perched near the top, while the inverted hammer flips that idea showing a long upper shadow with the small body hanging out close to the bottom. You typically see these patterns popping up after a downtrend, quietly suggesting the market momentum could be shifting gears from bearish to bullish.
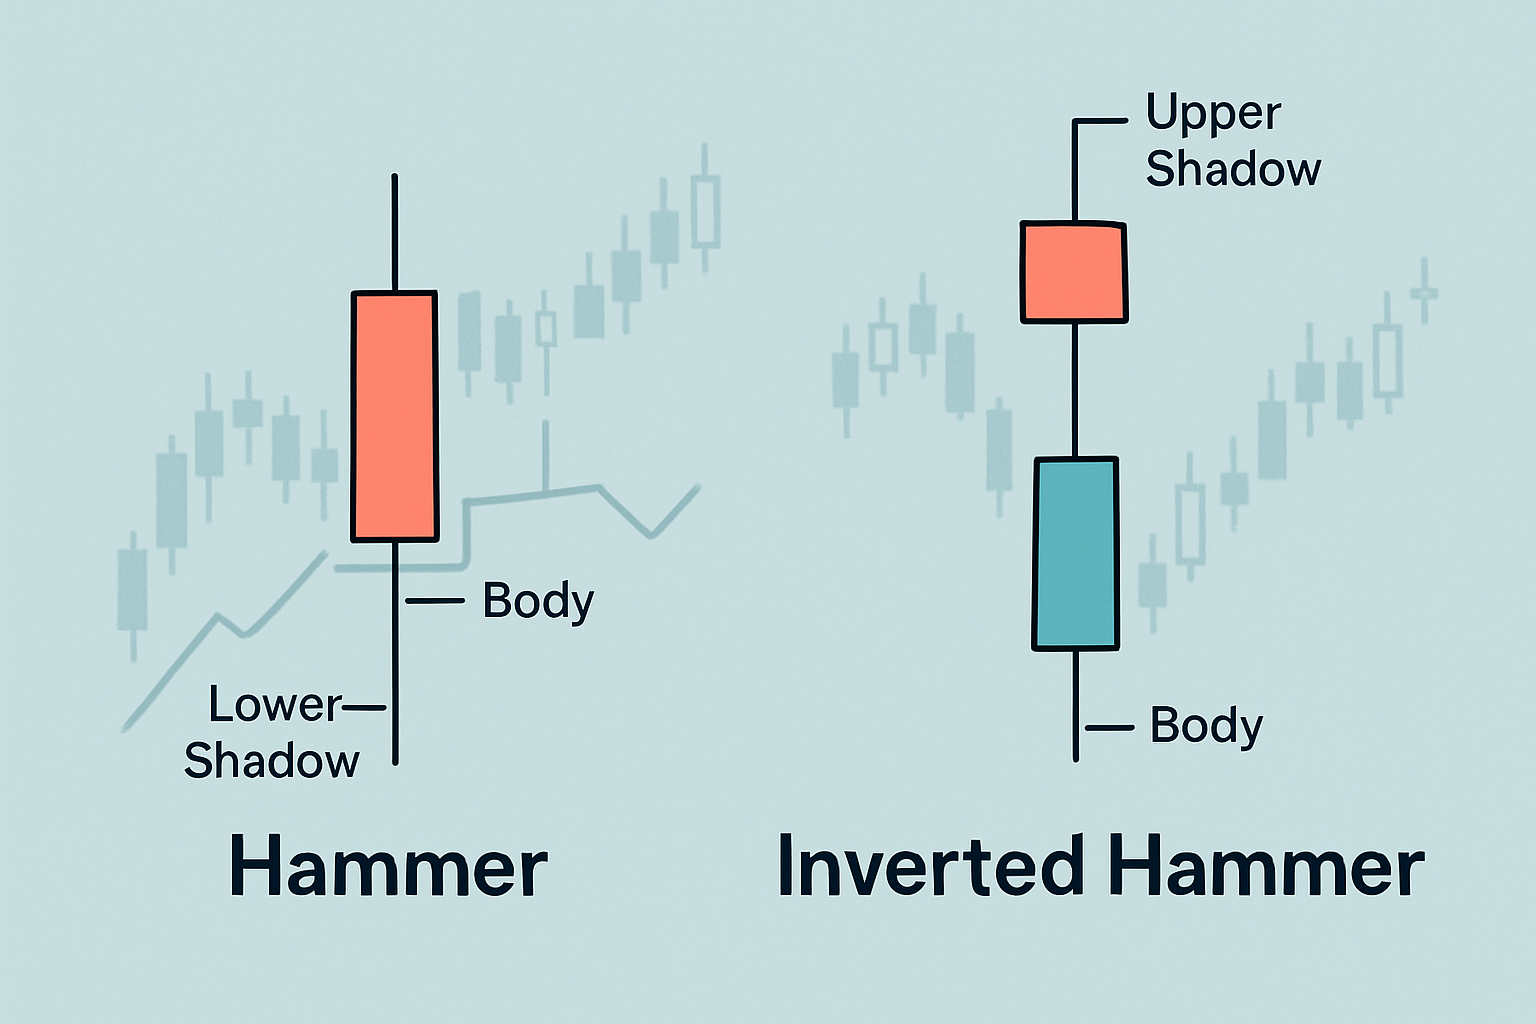
Visual comparison of hammer and inverted hammer candlestick patterns highlighting body and shadow differences.
A hammer candle sports a long lower shadow that is at least twice the length of its small real body. The body tends to perch near the top of the price range. More often than not it comes with little or no upper shadow to speak of. This pattern tells a story: sellers pushed the price down sharply during the session but buyers jumped in and shoved it right back up, closing close to where it all started.
The inverted hammer features a long upper shadow that stretches at least twice the length of its small real body, which tends to sit stubbornly near the bottom of the price range. You will typically find little to no lower shadow hanging around. This pattern suggests that buying pressure initially tried to push prices higher, but sellers quickly barged in and dragged the price back down close to where it all started. That long upper wick is like early optimism throwing a party that fizzles out pretty fast, hinting at a bit of market hesitation.
Hammer and inverted hammer patterns tend to pop up right at the tail end of a downtrend, often flashing a hint that a bullish reversal might be just around the corner. They capture this subtle tug-of-war where selling pressure starts to ease, and buyers cautiously begin to tiptoe into the arena. These candles tell a little story: even though prices took a dive earlier, buyers are now stepping up and pushing back against those lower levels. It’s like the market is quietly testing the waters to find its footing. Traders keep a keen eye on these patterns because they reveal important shifts in sentiment—often signaling a turning point, especially when confirmed by the price moves that follow.
Hammer and inverted hammer candles mark those key moments when buyers seem to step back into the ring after a price dip, often hinting at a potential swing back toward bullish momentum. It’s like spotting a subtle change in the market’s mood, where control quietly shifts hands.
Both patterns hint at possible reversals but the hammer usually packs more punch. It shows stronger buying pressure as buyers fight back to push prices up after a drop. Meanwhile, the inverted hammer tells a different story. Early buyer interest meets seller resistance, giving off a vibe of hesitation before buyers might eventually take charge.
| Feature | Hammer | Inverted Hammer |
|---|---|---|
| Shape | A small body perched near the top, with a long lower shadow stretching down below | A small body tucked near the bottom, sporting a long upper shadow reaching up high |
| Shadow Location | Noticeably long lower wick that really grabs your eye | A long upper wick that stands out, almost like it is trying to wave hello |
| Body Placement | Sitting close to the top of the price range, as if it is trying to hold its ground | Nestled near the bottom of the price range, hanging on quietly |
| Psychological Meaning | Buyers took charge, firmly wresting control away from sellers | Buyers bumped into resistance from sellers, but the selling pressure was clearly losing steam |
| Typical Volume Behavior | Volume often spikes when the reversal gets the green light | Volume tends to be moderate at best and usually waits around for a confirming nod |
A common slip-up is confusing hammer or inverted hammer candles with lookalikes like shooting stars or hanging man patterns, each carries its own story depending on where it crops up in the trend. Traders often have to take a step back and peek at the earlier price action. They also lean on other indicators or price moves to avoid getting tripped up by false signals.
Using hammer and inverted hammer patterns in trading really calls for a bit of patience and a steady hand while waiting for confirmation. Traders typically keep a close eye on the candle that follows these patterns, hoping it closes higher—signaling that buyers might be stepping up to the plate. Taking a peek at the volume can make this signal even more convincing, since rising volume often tags along with stronger reversals.
Keep an eye out for a hammer or inverted hammer candle appearing after a solid downtrend because it often signals the market's intentions.
Hold your horses until the next candle closes above the hammer's close since that move usually confirms a potential reversal.
Watch for a spike in trading volume as it can indicate that buyers are entering the market.
Check nearby support or resistance levels to see if they align with this pattern.
Play it safe by placing stop-loss orders just below the candle’s low to manage your risk.
Traders who skip proper confirmation and risk controls such as stop-loss orders often find themselves tangled in false signals, leading to avoidable losses.
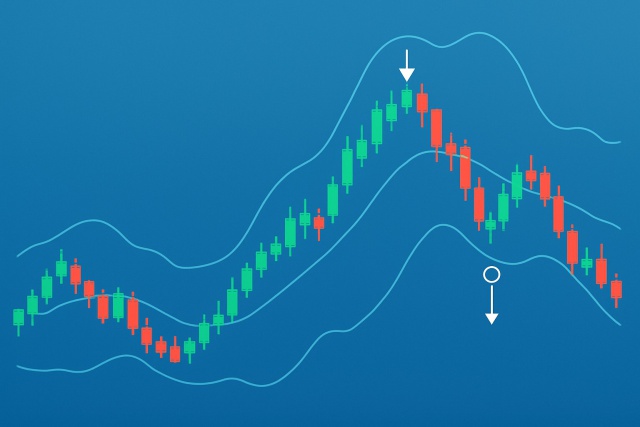
Picture a stock that is been sliding downwards for a few days straight. Suddenly a hammer candle pops up with its long lower wick and tiny body stealing the show. Then the very next day the price closes higher and volume picks up. This is a clear sign buyers might be getting off the sidelines. Jumping into a trade after that kind of confirmation often pays off with a nice reversal. Flip the script to an inverted hammer that shows up all alone without trend or confirmation in sight and it usually flops. For example if the candle right after it closes lower it’s a dead giveaway that selling pressure still holds the reins.
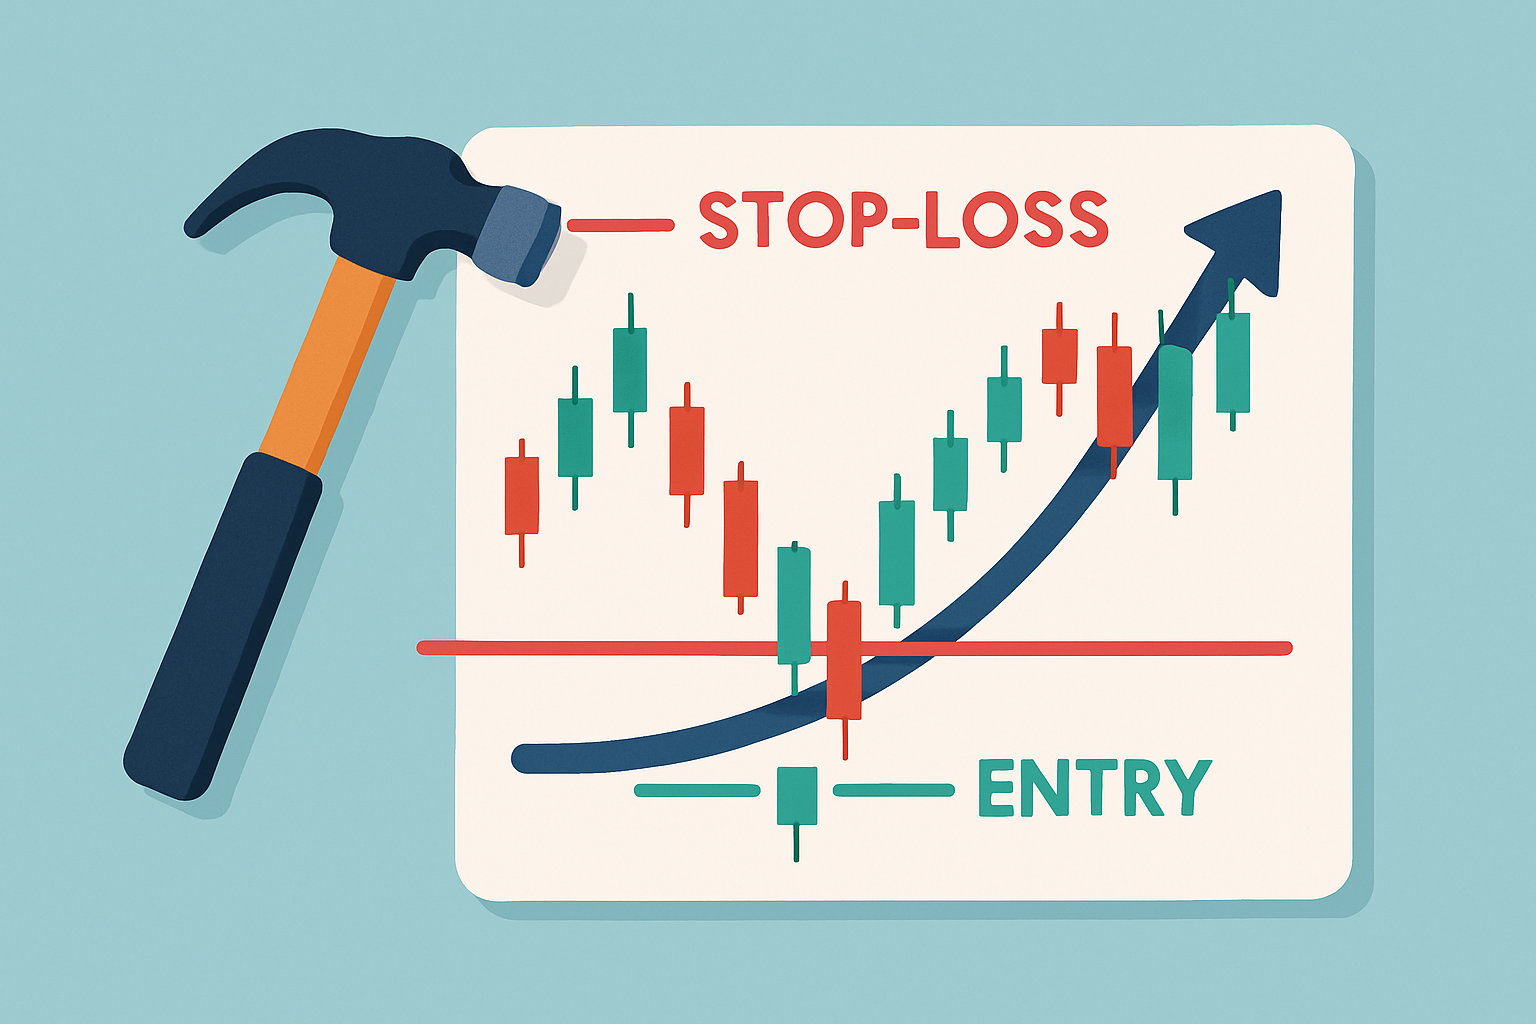
Example trading charts featuring hammer and inverted hammer candles with trade setups.
Hammer and inverted hammer patterns can be quite useful but seldom shine when you rely on them alone. They’re no magic bullet for quick reversals or instant profits. These candlesticks hint at possible turning points but need to be weighed alongside the bigger picture. Think overall trend, volume signals and a handful of other indicators. I’ve noticed many individuals jump the gun expecting prices to leap the moment these patterns pop up. More often than not, the market takes a breather or pokes around those levels a bit more.
Technical indicators like RSI, MACD and moving averages or support and resistance levels often come in handy to make hammer signals more trustworthy. For example, when an oversold RSI coincides with a hammer pattern it usually increases the odds of a reversal. Similarly, spotting a hammer near a important support level or alongside a bullish MACD crossover can pack a punch as a trade signal.
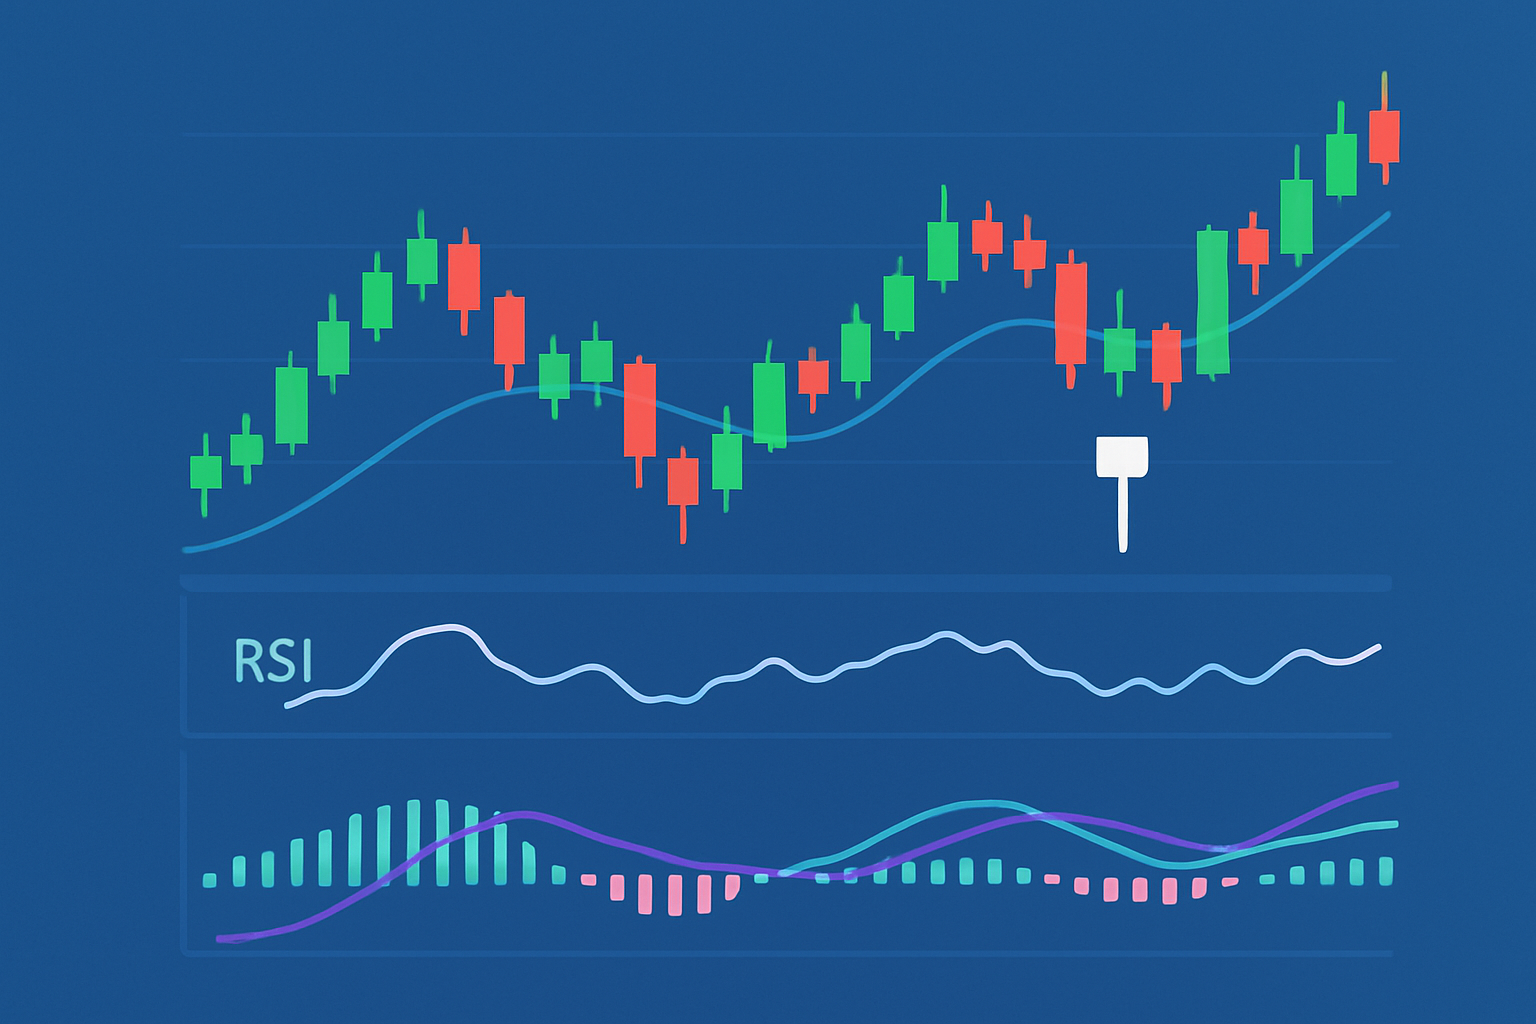
Chart showing hammer candlestick confirmed by RSI and MACD technical indicators.
Modern charting platforms like TradingView and TrendSpider come packed with nifty tools that make spotting and confirming hammer and inverted hammer patterns almost effortless. TradingView’s sophisticated charting features and vast indicator library give traders a leg up by letting them spot these patterns and double-check signals through interaction with others. Then there’s TrendSpider which relies on AI-powered pattern recognition and lets you customize indicators to highlight these candlesticks automatically. This is handy for boosting your efficiency and confidence.

Are you tired of juggling multiple tools for your trading needs? TradingView is the all-in-one platform that streamlines your analysis and decision-making.
With its powerful charting capabilities, real-time data, and vibrant community, TradingView empowers traders like you to stay ahead of the market. Join thousands who trust TradingView for their trading success.

Driven by a passion for democratizing trading knowledge, she focuses on behavioral finance and psychological aspects of market decision-making.
Read PostsDiscover the wedge falling pattern's secrets and learn step-by-step how to trade this powerful techn...
Master trading with Bollinger Bands by understanding volatility, setup patterns, and risk management...
Discover how inside bar patterns signal key market pauses and possible breakouts or reversals. This...

Discover how to recognize the evening star candlestick pattern—a powerful signal highlighting potent...