


TrendSpider
Is TrendSpider Software Worth the Price?
Discover if TrendSpider software’s advanced automated technical analysis tools justify the cost for...
This article breaks down how TrendSpider's advanced charting features can help traders work smarter and speed up market analysis.
TrendSpider offers a suite of advanced charts that traders at any stage can really take advantage of. These TrendSpider charting tools help fine-tune your analysis and minimize those all-too-common slip-ups.
Charts in TrendSpider lay out price movements across various timeframes and really hold the spotlight in technical analysis.
TrendSpider offers traders a suite of savvy charting tools, featuring automated trendline detection and customizable indicators that feel like a trusty sidekick. These handy features help cut through the noise, making analysis less of a chore and boosting the accuracy and timing of trades
Automated Trendline Detection quickly picks up and sketches trendlines based on how prices move—saving you from the guesswork.
Multi-Timeframe Analysis lets you see various timeframes all cozy together on one chart, making comparisons a breeze.
Raindrop Charts mix volume and price data in a way that really peels back the layers of market behavior—like getting the inside scoop.
Dynamic Price Alerts can be fine-tuned just the way you like, so you’re always in the loop when key price shifts happen.
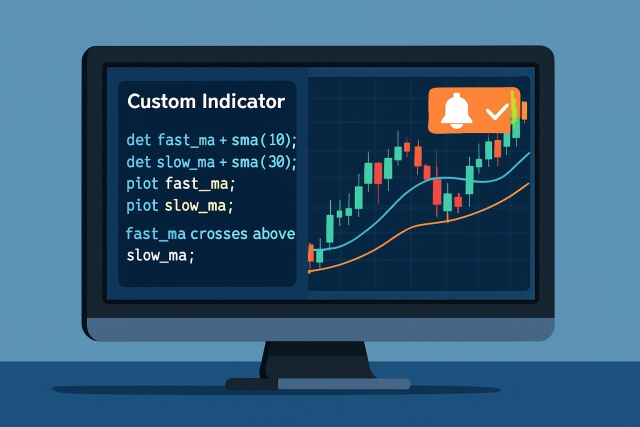
Custom Indicators can be crafted using TrendSpider's scripting engine, letting you tailor your analysis to fit like a glove.
Backtesting with Chart Patterns helps you play out your strategies by simulating past trades—think of it as a dress rehearsal for the market.
Smart Watchlists Integration hooks your watchlists right up to chart data, making tracking a bit less of a juggling act.
Each tool fits like a glove with a variety of trading styles. Automated trendlines are a real time-saver, helping to cut through the noise and reduce bias when spotting patterns—something I have come to appreciate more than once. Multi-timeframe analysis opens up a wider lens on the market, giving you that extra bit of perspective that can make all the difference. Raindrop charts add a splash of volume info that deepens your grasp on how prices move, which can feel like unlocking a secret layer. Dynamic alerts keep you one step ahead for smarter risk management. Custom indicators let traders put their own spin on strategies, adding a personal touch. Backtesting is like a dress rehearsal against historical data, giving you a safer way to try out ideas before going live. Smart watchlists are the unsung heroes that help you keep track of what truly matters without breaking a sweat.

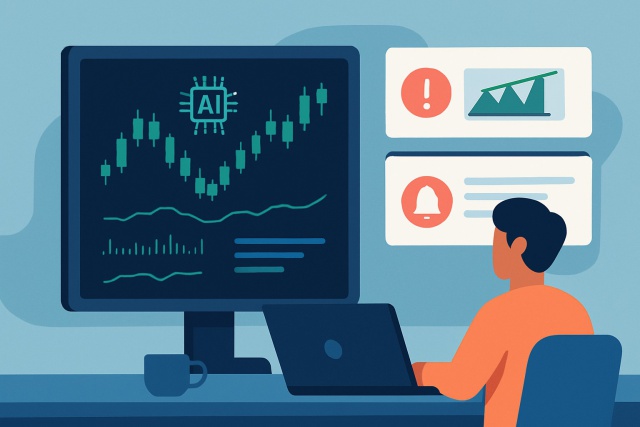
Screenshot showcasing TrendSpider's advanced charting interface with automated trendlines and multi-timeframe analysis in action.
TrendSpider's charting tools really lean into automation and smart pattern recognition, which tends to give it an edge over platforms like TradingView that are more about social collaboration and offering a buffet of indicators.
Knowing the differences in pricing, features, and user focus really helps when deciding between these two popular charting and analysis platforms geared towards traders.
| Key Differences |  |  |
|---|---|---|
| Pricing | Pro $14.95/mo, Pro+ $29.95/mo, Premium $59.95/mo | Basic $39.99/mo, Pro $59.99/mo, Premium $99.99/mo |
| Automated Technical Analysis | Does not offer automated trend or pattern detection | Provides automated trendlines, support/resistance levels, and pattern identification |
| Customization & Indicators | Large selection of technical indicators and drawing tools | Allows for custom technical indicators and tailored chart setups |
| Charting Capabilities | Offers many chart types along with advanced drawing tools | Supports multi-timeframe charts, Fibonacci retracements, and dynamic alerts |
| Social & Community Features | Strong social network for sharing ideas and collaborating | Does not include social networking or community features |
| Platform Accessibility | Available on desktop, mobile devices, and tablets | Accessible via web on desktop and mobile devices |
| Target Audience | Covers everyone from beginners to experienced traders looking for community input | Designed for active traders and professionals who focus on automation |
| Pros & Cons Highlights | Pros include a tight-knit community and seamless access across multiple devices; cons are the premium price tag for advanced features and the occasional slowdown that can test your patience | Strengths lie in its automatic analysis and clever pattern recognition; downside is a steeper learning curve and a pricier tag, which might make you think twice before diving in |
| Visit TradingView Site | Visit TrendSpider Site |
TrendSpider really catches your eye with its automatic trendline detection and clever AI-powered pattern recognition—tools that feel like having a sharp-eyed assistant right by your side. On the flip side, TradingView pulls people in with its bustling community and an impressive smorgasbord of indicators to choose from.
Spot high-probability trades using TrendSpider by getting cozy with the automated trendline tools and the multi-timeframe features.

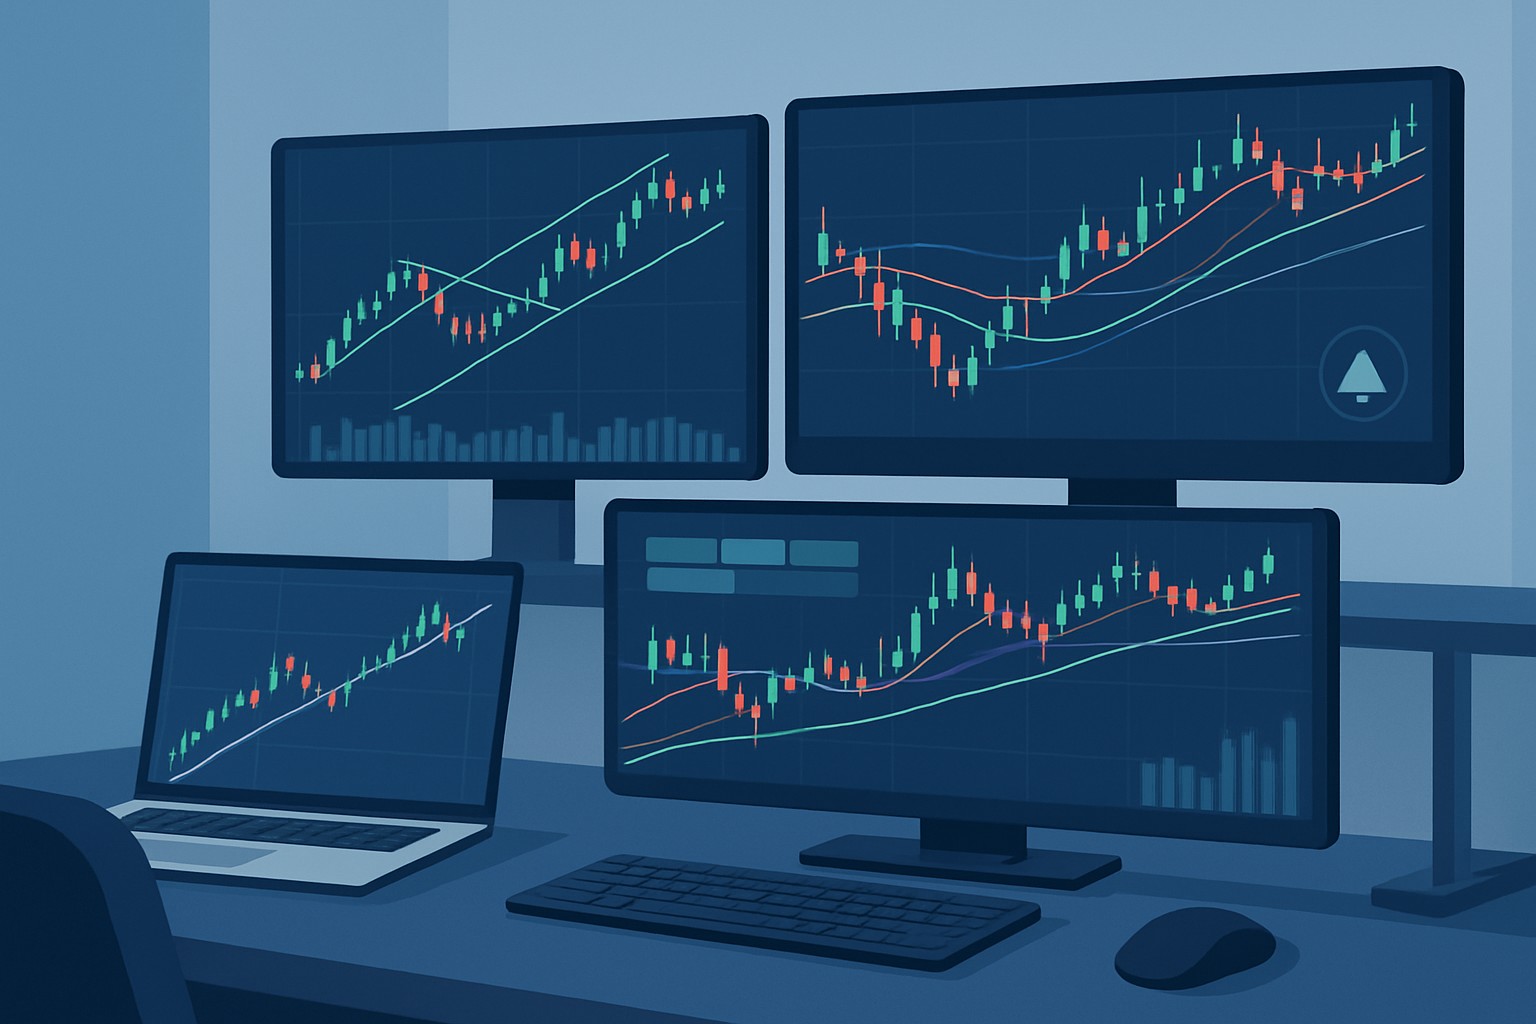
Visual example of TrendSpider’s chart featuring automated trendlines overlaid with multi-timeframe data and volume indicators.
Raindrop charts are one of TrendSpider's standout features that cleverly combine detailed volume and price data to give traders a clearer picture of market sentiment. TrendSpider's scripting tools give traders the flexibility to whip up custom indicators tailored to their own strategies.
TrendSpider’s automated tools make backtesting chart patterns a breeze, so traders can quickly check if their strategies really stand the test of time.
Pick out specific chart patterns like head and shoulders or double bottoms using TrendSpider’s backtesting tool—it's handy for zeroing in on what matters.
Run simulations with historical data to see how profitable and risky those patterns really are.
Set up dynamic price alerts so you get a heads-up the moment prices hit key support, resistance or trigger levels—no need to keep staring at the screen all day.
Keep tweaking those alert settings to filter out the noise and make sure you’re only getting the truly important ones.
Weave these alerts into your overall trading plan to stay on top of timely moves and keep your execution sharp and disciplined.
Make your workflow a breeze by customizing TrendSpider’s workspace with saved layouts. Pick up a few handy keyboard shortcuts and add watchlists tailored to your needs.
"Getting the hang of TrendSpider’s charting tools really flipped the script on how I trade. It tossed out the guesswork, helped me stick to my strategy like glue, and gave me a solid boost of confidence when the markets started acting all unpredictable." – Professional Trader
What You Get
Sophisticated charts deliver multi-timeframe analysis and customizable visual overlays, helping traders spot market trends and patterns with greater clarity — because sometimes, seeing really is believing.
Lets users visualize market data with precision, supporting smarter, better-informed trading decisions.
Harnesses artificial intelligence to automatically detect complex trading patterns and signals, unearthing opportunities that might easily slip past even the keenest human eye.
Boosts both speed and accuracy in picking out profitable trades, all while cutting down on those pesky human errors.
Delivers highly customizable alerts based on user-defined technical conditions, ensuring traders stay in the loop on vital market shifts — because timing really is everything in trading.
Empowers users to act swiftly on market changes, helping them seize golden opportunities and keep risks in check.
Lets users put their trading strategies through the wringer against historical data to see how they might have performed — a little rehearsal before the big show, if you will.
Helps fine-tune and validate strategies, boosting confidence and dialing down financial risk.
Offers three subscription tiers — Standard, Pro, and Elite — each with its own set of features and support geared to fit different experience levels and needs. Something for everyone, really.
Makes advanced tools available at varying price points, catering to both novices and seasoned pros.
Crafted for smooth navigation and straightforward use, whether you’re just starting out or have been around the trading block a few times.
Shortens the learning curve and streamlines workflow, so users can trade smarter, not harder.
Supports analysis across a broad range of global exchanges and asset types, letting traders manage diverse portfolios without missing a beat.
Allows users to operate on the international stage and diversify their strategies with ease.
Includes a comprehensive set of automated tools to perform technical analysis, making trend identification simpler and generating actionable insights that traders can really sink their teeth into.
Saves time by taking care of routine analysis, freeing users up to focus on strategy and execution — because time is money, after all.
Getting started with TrendSpider and its charts is pretty straightforward—start by creating an account, then dive into exploring the various chart types. Once you're comfortable, switch on those automated trendlines—they really take the guesswork out of spotting key market movements. Along the way, make good use of alerts and backtest reports to maximize your experience with TrendSpider charts.
Kick things off by creating your TrendSpider account and choose the plan that matches your trading style.
Take some time to get familiar with the different chart types available such as candlestick and raindrop. There are a few others worth exploring.
Activate the automated trendlines on your charts because they save you time when spotting key market structures.
Set up price alerts that update automatically for the stocks or cryptocurrencies you are watching. Think of them as your personal market watchdog.
Make it a habit to check your backtest reports regularly. That’s where you can fine-tune your trading strategies.
Don’t miss the community webinars and tutorials TrendSpider offers. They’re a great way to sharpen your skills and maybe pick up a tip or two along the way.

Struggling to improve your trading performance? Edgewonk's advanced analytics tools are designed to give you the edge you need.
With detailed trade journaling, robust strategy analysis, and psychological insights, you'll gain a comprehensive understanding of your strengths and weaknesses. Don't miss out on this game-changing opportunity.

Transforming the field of commodities trading through sustainable investing principles, she bridges traditional finance with ESG considerations.
Read PostsDiscover if TrendSpider software’s advanced automated technical analysis tools justify the cost for...
Wondering if TrendSpider is worth it for swing trading? This detailed pros and cons guide breaks dow...
Unlock faster, smarter trading with the TrendSpider Chrome Extension. Learn how it integrates automa...
Discover how to create custom indicators on TrendSpider with this step-by-step guide. Tailor your tr...