


TradingView
Some of the Best Indicators on TradingView for Trend Traders
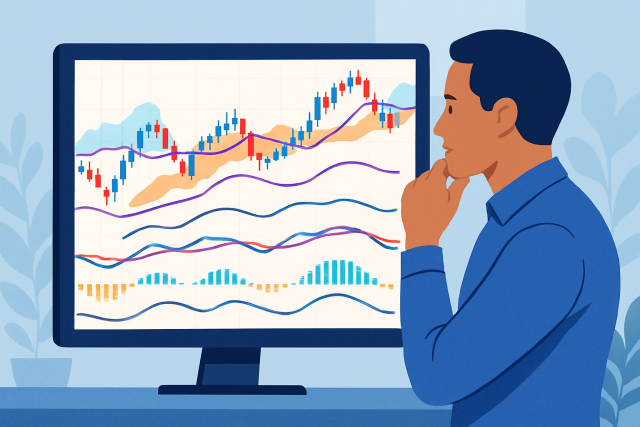
Explore the top trend-trading indicators on TradingView that empower traders to identify strong mark...
TradingView has earned its stripes among traders and investors thanks to its powerful charting capabilities and real-time market insights. Getting the hang of TradingView is absolutely vital if you want to make informed, data-driven trading choices.
Get started with TradingView by creating a free account on their website and filling in your details—it’s pretty straightforward. Once you’re logged in you’ll see a clean no-fuss dashboard featuring watchlists and chart tools plus an ideas feed and your profile settings all within easy reach. I’ve found the interface refreshingly user-friendly making it a good fit whether you are just dipping your toes in or you’re a seasoned pro.
Once you register, take some time to personalize your profile by adding a display name and adjusting your notification settings to fit your trading style.
Start crafting your first watchlist by adding stocks, forex pairs, cryptocurrencies or indices you want to monitor regularly. This way nothing slips through the cracks.
Get comfortable with the main navigation bar because it serves as your gateway to charts, screens, markets and interesting ideas shared by the community. Think of it as your trading command center.
Use the customizable sidebar to quickly switch between saved charts, alerts and messaging. It helps save time and keeps everything running smoothly.
Let's dive into making those TradingView charts work harder for you. Whether you are a newbie or a seasoned trader, these tips can help you squeeze out every drop of insight from those colorful lines and squiggly patterns.
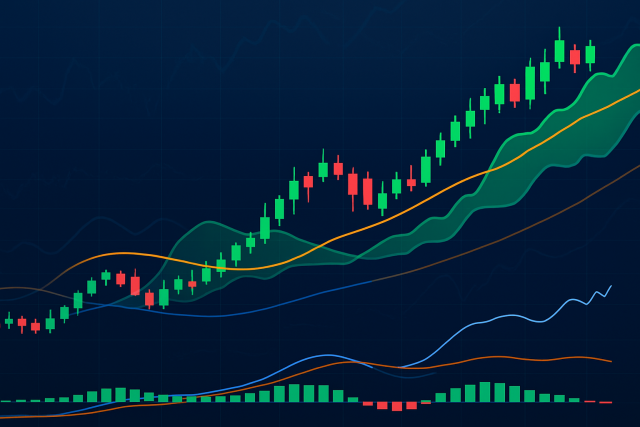
TradingView offers a handful of chart types to bring your market data to life including candlestick, line and bar charts. Switching between these views is a breeze and gives you the flexibility to tailor your analysis to various trading styles and market conditions
You can zoom in and out on charts using your mouse or trackpad and glide smoothly across different timeframes. You can also tweak view settings like grid lines or color themes to better zero in on the assets or periods that really matter for your strategy.
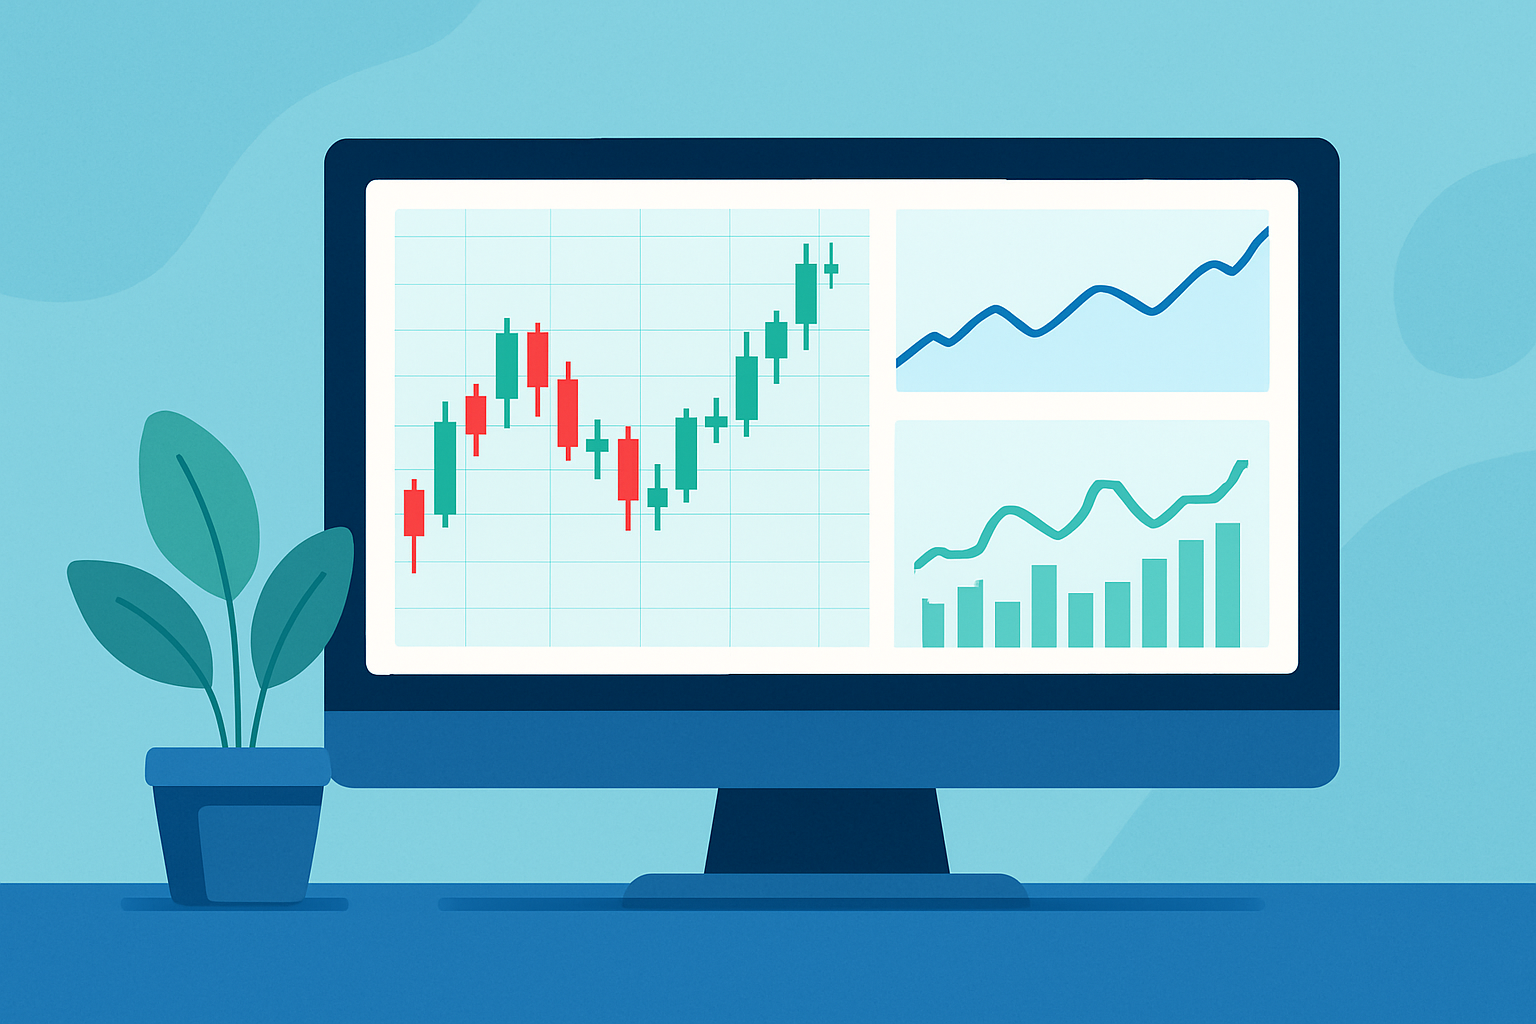
Screenshot of TradingView platform displaying candlestick and line charts with customizable interface
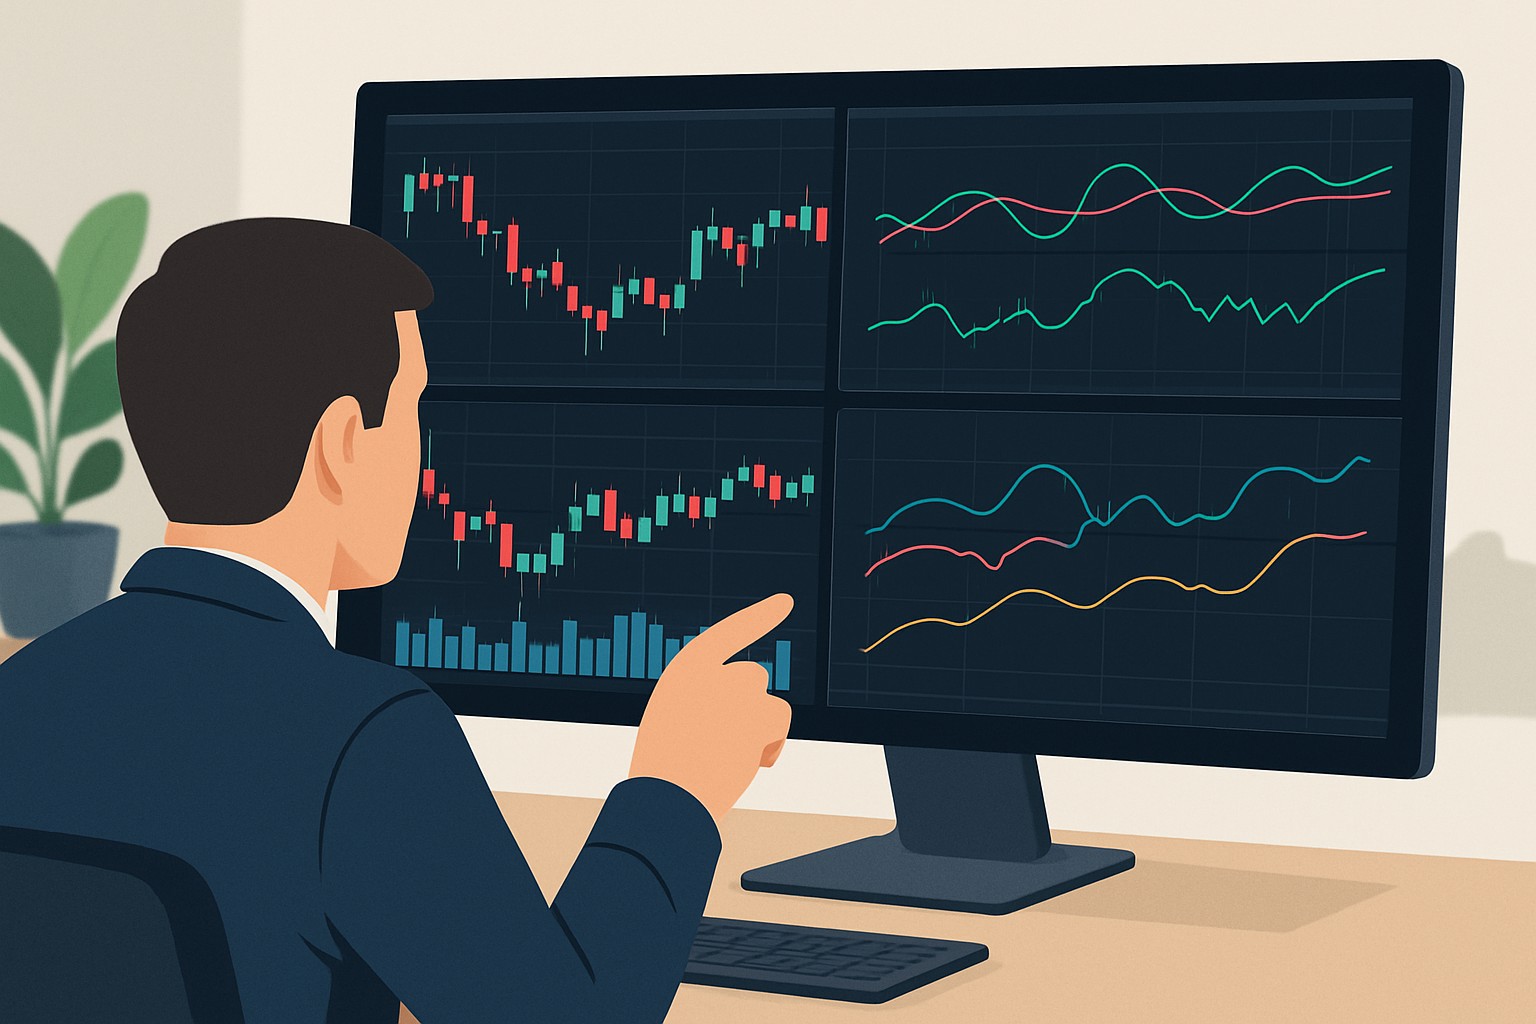
TradingView comes packed with a handy lineup of built-in technical indicators and drawing tools that are absolutely essential for digging deep into market analysis.
Tweak each indicator’s settings to fit your strategy like a glove. Save your chart templates for quick and easy access and combine multiple tools to perform thorough analyses that bring entry and exit signals into sharp focus.

What You Get
Offers a wide range of chart types, drawing tools, and customizable layouts that let users dive deep into technical analysis with precision and detail that even the most meticulous traders will appreciate.
Helps traders clearly see market trends, giving them a solid edge to make smarter, more confident decisions through thorough analysis.
Includes a treasure trove of built-in technical indicators and even allows users to craft their own with Pine Script, tailoring the analysis exactly to their style and needs.
Assists users in spotting those all-important market signals and patterns, boosting the timing and accuracy of trade entries and exits like hitting the bull’s eye more often than not.
Features a lively community platform where users can swap charts, strategies, and market insights with millions of traders worldwide — because sometimes two (or a thousand) heads really are better than one.
Encourages learning and sharpens strategies through crowd-sourced ideas and lively discussions, helping users deepen their market savvy in a way that’s both fun and insightful.
Functions seamlessly across desktop, mobile, and tablet, so users can keep their finger on the market’s pulse anytime, anywhere — because opportunities don’t wait and neither should you.
Supports continuous market monitoring and quick reactions to events, offering much-needed flexibility for traders who are always on the go.
Connects effortlessly with major brokerages, delivering up-to-the-second data and allowing orders to be placed directly within the platform—no need to juggle multiple apps or lose precious seconds.
Simplifies the trading hustle, cutting down execution time and complexity for active traders who truly value efficiency and speed.
Lets users tailor alerts based on price moves, indicators, or custom triggers, sending timely nudges via app, email, or SMS — so you never miss those potentially game-changing moments, even when life gets busy.
Keeps users in the loop on key market swings promptly, enabling smart, timely decisions without the need to be glued to the screen.
Offers tiered subscriptions—Pro, Pro+, and Premium—with varying feature sets, chart layouts, indicators, and alerts designed to fit a range of trading styles and skill levels.
Gives options that cater to everyone from rookies to seasoned pros, allowing users to grow their toolkit as their trading savvy matures, without breaking a sweat.
TradingView lets you set up custom alerts based on price levels or indicator signals, so you’re not stuck staring at the screen all day hoping not to miss important market moves.
Open the chart and pick the price level or indicator line where you’d like to set an alert. Think of it as choosing your spot to keep an eye on.
Hit the Alert button on the toolbar or, if you’re feeling quicker, right-click directly on that chart element to set up your alert.
Choose the alert condition, whether it’s crossing a certain value or sitting above or below a particular threshold that suits your style.
Personalize how you want to get notified, whether through the app, email or SMS so it fits right into your daily groove.
Swing by the alerts manager panel to review and tweak your alerts anytime. Adjust triggers or expiration settings whenever you feel like it.
TradingView's paper trading feature is a nifty little tool that lets you dip your toes into the markets without risking a dime. Simply link paper trading from your account settings, and you’re off to the races—placing virtual trades and tweaking your strategies to your heart's content.
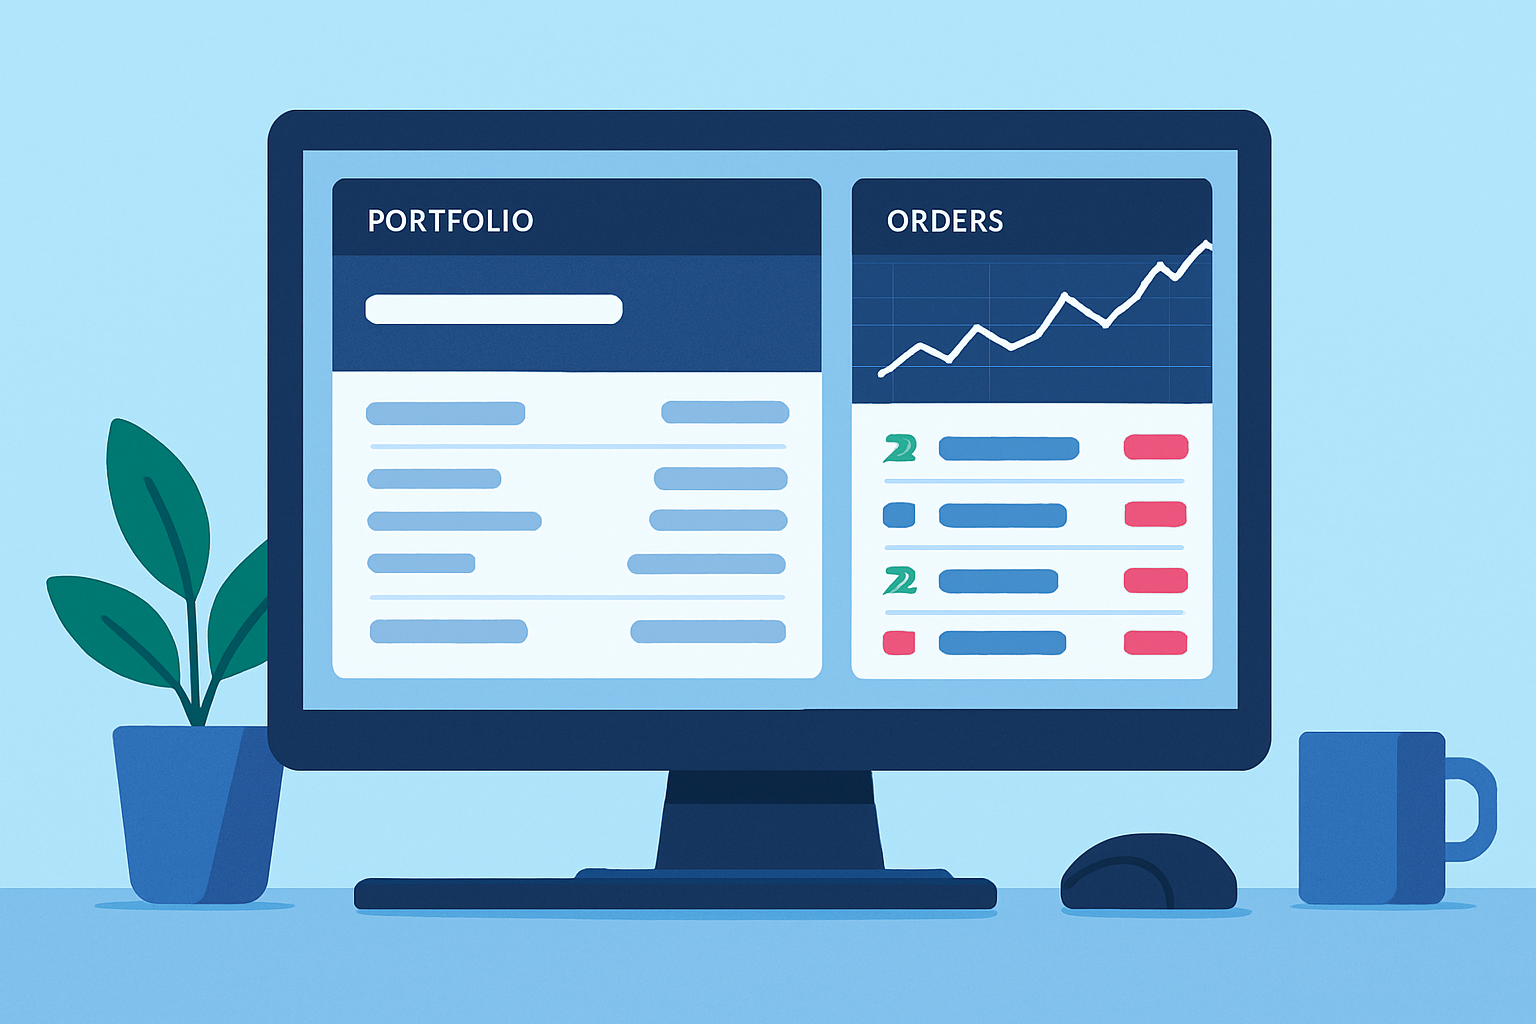
Example of TradingView’s paper trading simulator with portfolio overview and open simulated trades
TrendSpider is a well-known charting platform that leans heavily on automation and AI-powered analysis. It’s especially appealing for traders hunting advanced pattern recognition and spot-on backtesting tools. Unlike TradingView which blends social networking with charting, TrendSpider zeroes in on automated insights and technical efficiency.
Taking a close look at the key differences and standout features of top chart analysis platforms can really help traders zero in on tools that match their skills and trading ambitions.
| Key Differences | |  |
|---|---|---|
| Pricing | Pro: $14.95/mo, Pro+: $29.95/mo, Premium: $59.95/mo — options to suit casual users all the way up to heavy hitters. | Basic: $39.99/mo, Pro: $59.99/mo, Premium: $99.99/mo — pricier, but packing some serious horsepower under the hood. |
| Key Features | Advanced charting, loads of technical indicators, social networking vibes, plus brokerage integration to keep you trading seamlessly. | Automated analysis, customizable indicators, and AI-driven pattern recognition that feels like having a personal assistant who never sleeps. |
| Ease of Use | A moderate learning curve that can trip up newcomers here and there, especially since some goodies are locked behind premium subscriptions. | The learning curve is steeper here — not for the faint of heart, but great for those who love diving deep into advanced tools. |
| Technical Analysis Tools | Packed with tons of chart types, versatile drawing tools, and a sprawling library of indicators that’ll keep the serious analysts busy. | Features automatic trend analysis, multi-timeframe charts, and dynamic alerts that keep you on your toes without needing constant babysitting. |
| Community & Social Features | A robust social hub where sharing ideas and strategies with traders worldwide feels as easy as chatting with a buddy. | Doesn’t put much stock in social bells and whistles, focusing instead on giving you a tailored, data-driven experience. |
| Integration & Accessibility | Works like a charm across multiple devices and hooks you up with major brokers so you can trade without breaking your stride. | Available on desktop and web, though you won’t find direct brokerage integration here — it’s more about the analysis itself. |
| Target Audience | From greenhorns testing the waters to seasoned pros hungry for community insights and flexible, powerful tools. | Tailored for active traders and pros who appreciate automation and AI-powered insights more than social chatter. |
| Visit TradingView Site | Visit TrendSpider Site |
TradingView really shines thanks to its lively community-driven platform and broad selection of indicators. It also offers hassle-free access on almost any device you use. TrendSpider pulls ahead with more sophisticated automation, especially its clever AI-based pattern detection and backtesting features that handle much of the heavy lifting. TradingView is a solid pick for traders who thrive on collaboration and bouncing ideas around. Plans start at about $14.95 per month. TrendSpider suits those who want to dive deep into data-driven automation and don’t mind spending more for cutting-edge tools.
Beginners often pile on charts with too many indicators which usually muddies the waters instead of making things clearer. It’s smarter to keep things simple at first and build your skills one step at a time. TradingView is packed with handy resources and tutorials plus a lively user community ready to lend a hand when you need it.

Struggling to improve your trading performance? Edgewonk's advanced analytics tools are designed to give you the edge you need.
With detailed trade journaling, robust strategy analysis, and psychological insights, you'll gain a comprehensive understanding of your strengths and weaknesses. Don't miss out on this game-changing opportunity.

Transforming the field of forex trading through his systematic approach to currency pair analysis, he focuses on macroeconomic indicators and central bank policy impacts.
Read PostsExplore the top trend-trading indicators on TradingView that empower traders to identify strong mark...
Master trend spotting with the best TradingView indicators carefully selected for accuracy, ease of...
Discover top TradingView alternatives designed for traders seeking advanced automation, enhanced ale...
Discover how to set up Automated Trade Management (ATM) in TradingView with this comprehensive step-...