

TrendSpider
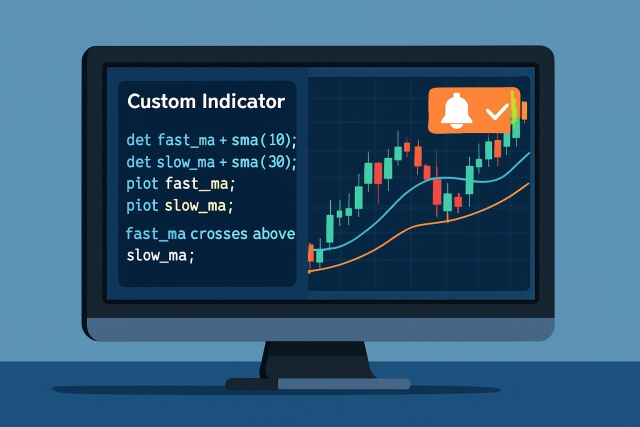
How to Create TrendSpider Custom Indicator from Scratch
Discover how to create custom indicators on TrendSpider with this step-by-step guide. Tailor your tr...

Volume indicators play a important role in technical analysis by shining a light on the strength or weakness lurking behind price movements. They’re the go-to tools that help traders tease apart whether a price shift is backed by genuine market momentum or just a flimsy signal that’s easy to overlook. The TrendSpider volume indicator neatly combines detailed volume data with intuitive visual tools and handy alerts, turning it into a trusty companion for both rookies finding their footing and seasoned traders sharpening their edge.
It’s worth taking a moment to get a solid handle on volume indicators in general. These handy tools keep tabs on the total number of shares or contracts traded over a given stretch of time. Traders often lean on volume indicators to double-check just how powerful a price move truly is or to sniff out potential turning points.
TrendSpider’s volume indicator is more than your run-of-the-mill volume histogram. It blends raw volume data with advanced analytics, customizable features and handy alerts to put traders firmly in the driver’s seat with sharper insights. By tying volume data to price movement, it helps users catch key volume patterns alongside their technical setups.
To really get a feel for what TrendSpider’s volume indicator can pull off, it’s best to dive into its key features.
Volume Histogram: Displays raw volume data as bars just below the price chart making it easier to spot volume trends that might otherwise fly under the radar.
Color Coding: Uses a clever palette of colors to compare current volume against an average benchmark, highlighting times of strong hustle or when things have gone quiet.
Volume Weighted Average Price (VWAP): Crunches an average price weighted by volume and gives you a handy flexible reference point to navigate the twists and turns of a trading session.
Volume Profile: Paints a picture of volume traded at different price levels rather than over time. It reveals important support and resistance zones that traders swear by.
Alerts & Notifications: Allows you to set up custom signals that buzz you when volume patterns shift noticeably, helping you stay ahead and make timely well-informed decisions.
Sometimes, the numbers alone just don’t tell the whole story, and that is where volume histograms step in to give us a colorful nudge. These handy charts break down trading activity like a lively conversation at a bustling café, showing not just how much was traded, but also painting the scene with colors that hint at the market’s mood. Whether you’re a newbie trying to wrap your head around market dynamics or a seasoned trader looking for that extra edge, mastering volume histograms and their color coding can feel a bit like learning a new language—one that actually talks back if you listen closely.
TrendSpider displays trading volume as a histogram right below the price chart. Each bar’s height gives you a straightforward glimpse of how many shares or contracts changed hands during that period. The bars come in handy colors too—green usually signals volume that’s above average, while red flags a dip below the norm—making it much easier for traders to catch bursts or lulls in activity.
VWAP is a key indicator that TrendSpider relies on to make sense of volume. It works by calculating the average trading price weighted by volume over the trading day or any period you choose. Think of VWAP as a trusty reference point showing where most of the trading action has taken place price-wise.
TrendSpider’s volume profile tool highlights the total traded volume at various price levels rather than tracking it over time. This clever visual setup lets traders quickly spot where the bulk of market action and attention has landed, often uncovering those important support and resistance zones that tend to steer future price movements.
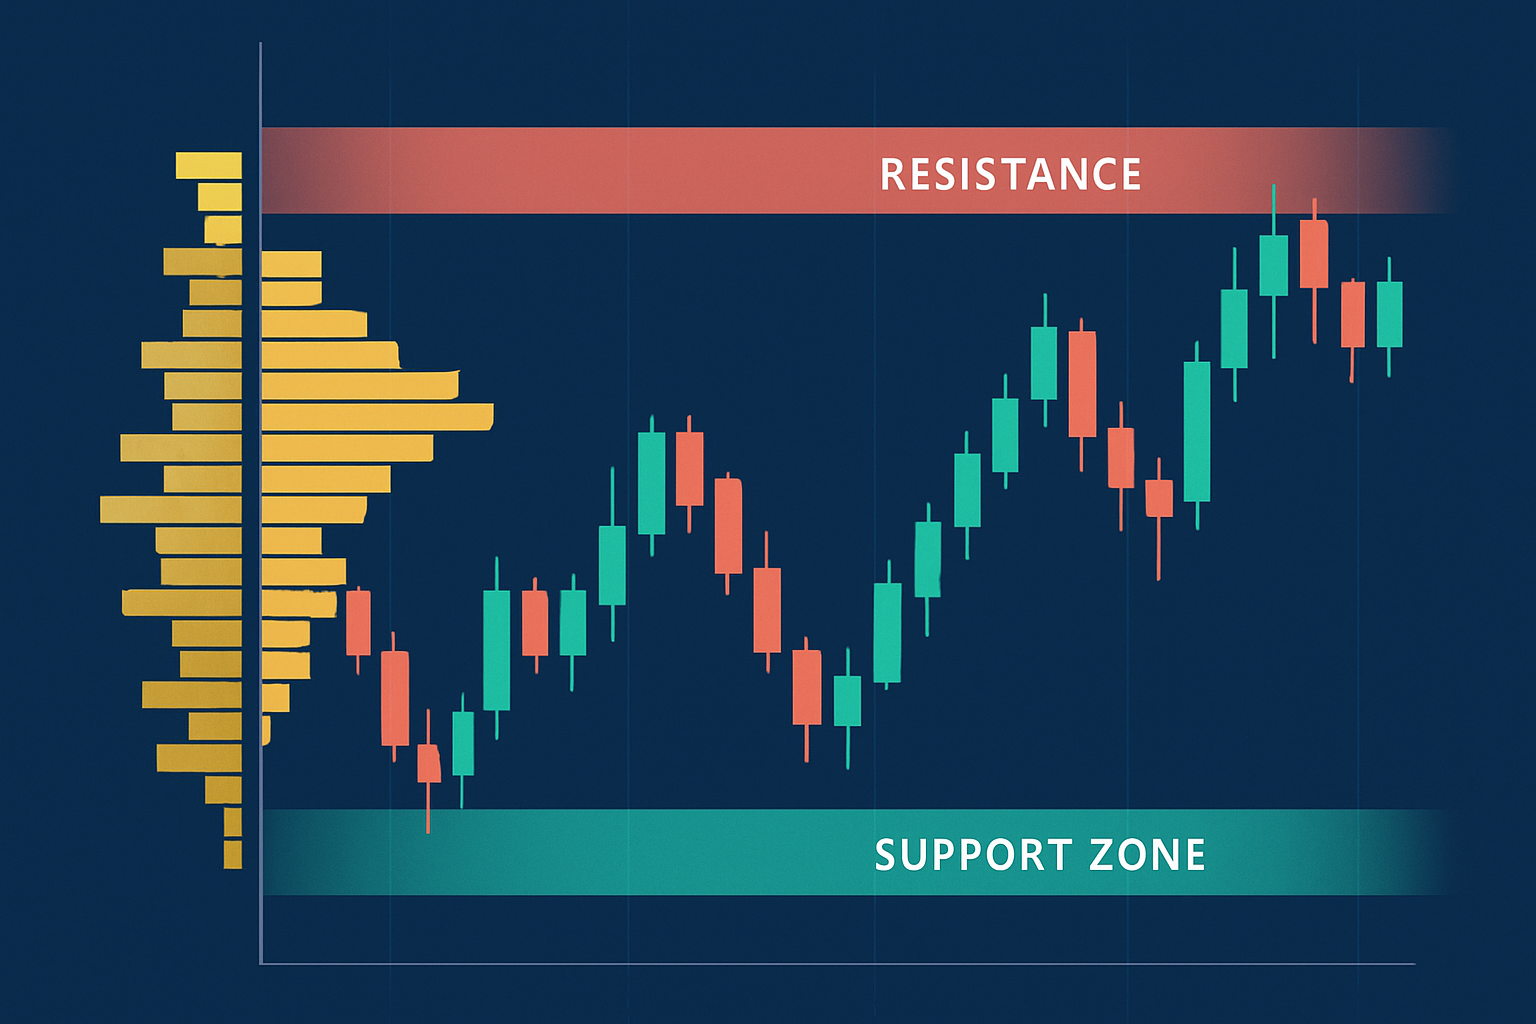
Volume Profile visualization on a stock chart showing volume distribution across price levels.
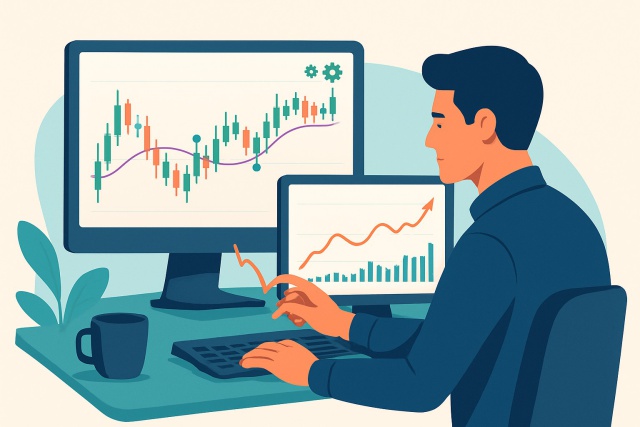
It’s one thing to get your head around the technical nitty-gritty of the volume indicator, but seeing it come alive in actual trading scenarios—that’s where the rubber meets the road.
When prices climb in TrendSpider along with rising volume, it is often a pretty solid sign of genuine buying interest and really drives home that uptrend is in play. On the flip side, seeing prices edge higher without volume backing them up tends to scream caution.
When traders take a peek at the volume profile in TrendSpider, they can easily zero in on price areas where the most trading action has gone down. These levels often act like trusty anchors, serving as solid support or resistance since a whole bunch of traders have been busy there.
One of the standout perks of TrendSpider is how customizable it is. Traders can tweak the volume indicator settings to fit their trading style, the securities they prefer and the time frames they like to analyze. This flexibility means the tool can adapt to a variety of market conditions.
Volume indicators can be surprisingly powerful tools, yet many traders often misinterpret what they’re really about or place way too much faith in their signals.
Imagine volume as the buzz from a crowd at a sports event. Loud cheers often spill over with excitement, though they don’t always give away which way the game is leaning or what the final score might turn out to be. It’s a bit like hearing the roar without knowing the play—exciting, but still a bit of a mystery.
If you’re new to the TrendSpider volume indicator, getting it set up and figuring out how to read it doesn’t have to feel like rocket science. Just follow these simple steps to easily bring volume analysis into your trading toolkit.
Fire up a chart for the security you want to dig into using TrendSpider.
Head over to the indicator menu and pick the volume indicator to add it to your chart for a clear view of the volume data.
Tweak the settings by adjusting colors, average periods and alerts so they fit your trading style.
Keep a close eye on the volume histogram and VWAP as they move with price changes. That is where interesting patterns show up.
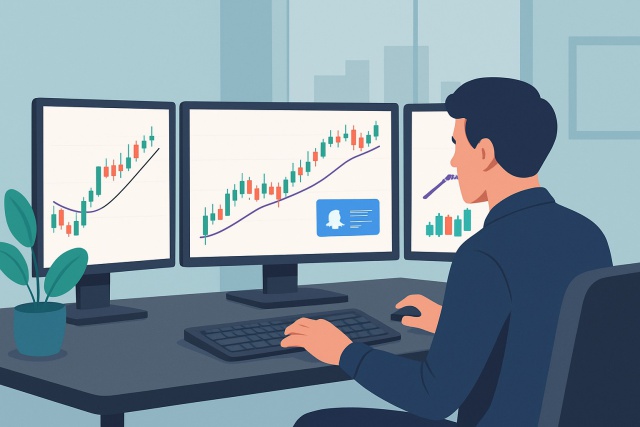
Set alerts for unusual volume spikes because they might be early signs of major market moves.
Combine volume insights with other technical clues like RSI or trendlines to create a clearer picture before you make your move.

Tired of missing opportunities and making suboptimal trading decisions? TrendSpider's cutting-edge platform automates complex technical analysis, saving you time and reducing human error.
With multi-timeframe analysis, dynamic alerts, backtesting, and customizable charting, you'll gain a competitive edge in identifying trends and making informed trades across global markets.

Transforming the field of forex trading through his systematic approach to currency pair analysis, he focuses on macroeconomic indicators and central bank policy impacts.
Read PostsDiscover how to create custom indicators on TrendSpider with this step-by-step guide. Tailor your tr...
Wondering if TrendSpider is worth it for swing trading? This detailed pros and cons guide breaks dow...
Wondering how much TrendSpider costs and how it stacks up against other platforms? This comprehensiv...
Unlock faster, smarter trading with the TrendSpider Chrome Extension. Learn how it integrates automa...