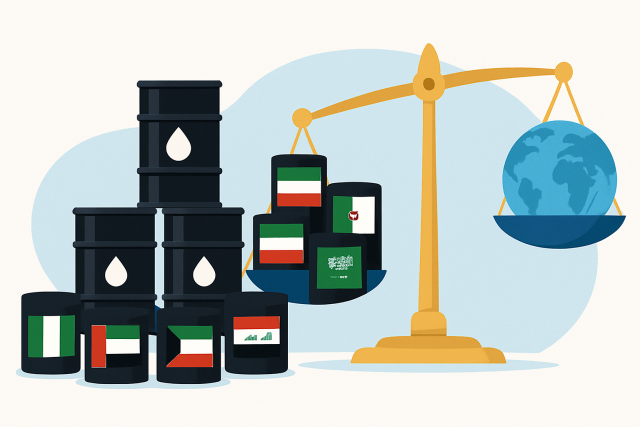
Understanding the meaning of Non Farm Payroll (NFP) is essential for traders, as it's one of those key economic indicators that traders worldwide tend to keep a sharp eye on. It reveals the number of jobs added or lost in the U.S. economy.
Non Farm Payroll covers the total number of paid workers in the United States but skips certain groups like farm employees, government workers, private household staff and nonprofit organization employees—those places where the usual payroll rules tend to bend a bit. Payroll here refers to the number of jobs on business payrolls—that is employees who earn wages—so independent contractors and self-employed individuals don’t make the cut.
Farm workers and certain other sectors often get left out because agricultural jobs tend to be highly seasonal and a bit unpredictable—making it tricky to get a clear read on the bigger economic picture. Similarly, government and nonprofit jobs usually don’t move the needle much when the economy shifts.
Gathering nonfarm payroll data is not just a walk in the park—it's a detailed process that involves a good deal of coordination and some well-timed teamwork. Basically, the individuals behind the scenes collect data from a wide swath of employers across the country, making sure they cover various industries except for farming, of course. Once the numbers are in, they go through a thorough vetting process to ensure accuracy before being released to the public. It is fascinating how this data snapshot, fresh off the presses, can ripple through markets and conversations almost instantly, shaping how everyone from economists to your next-door neighbor thinks about the economy.
The Non Farm Payroll data is pulled together by the U.S. Bureau of Labor Statistics who dig into detailed monthly surveys. Their main event, called the Current Employment Statistics (CES), casts a wide net covering about 142,000 businesses and government agencies. This adds up to nearly 689,000 individual worksites.
The NFP report drops every month, typically on the first Friday at 8:30 AM Eastern Time like clockwork. But it’s not just the headline payroll number that grabs attention. You’ll also get the unemployment rate and average hourly earnings plus revisions to past months’ data.
The NFP report is a big deal when it comes to sizing up just how strong the U.S. economy and labor market really are. It often steers the chatter around economic growth forecasts and the Federal Reserve’s next moves on monetary policy.
Traders keep a keen eye on the NFP report since it frequently sparks serious volatility across forex, equities and futures markets right after it drops. Prices can swing wildly as investors scramble to reassess economic trends and shuffle their positions.
The NFP report zeroes in on a handful of key numbers that really tell the story. The headline jobs figure shows the net change in employment since last month and it’s not set in stone—updates often come as new data trickles through. Then there’s the unemployment rate, which tells us what slice of the labor force is actively hunting for work but hasn’t landed a gig. Lastly, average hourly earnings give us a peek at wage growth that can nudge traders to read between the lines on inflation pressures and how much individuals might be willing to spend.
Component | What It Measures | Why It Matters for Traders | Typical Market Impact |
---|---|---|---|
Headline Jobs Number | The net change in non-farm jobs | Offers a snapshot of how robust the economy’s growth really is and just how much demand there is for workers | Often gives the US dollar a noticeable lift and steers stock market trends |
Revisions | Updated data from previous months | Can either confirm the story we thought we knew or throw a curveball, shifting recent patterns and market mood | Usually prompts a bit of market shuffle once released |
Unemployment Rate | The percentage of workers without jobs | Reveals the breathing room in the labor market and serves as a pulse check on overall economic health | Plays a key role in shaping interest rate expectations and stock market moves |
Average Hourly Earnings | Changes in workers’ average wages | Sheds light on creeping inflation risks that might nudge Fed decisions down the line | Moves currency values and bond prices, keeping traders on their toes |
Traders usually put a good deal of thought into gearing up for the NFP release because they know it can spark sharp price swings. They roll out strategies that aim to ride the wave of volatility and keep a tight leash on risk. More often than not this means carefully combing through forecasts, timing their orders just right and placing protective stops to avoid unpleasant surprises.
Take a good look at analysts' forecasts and past trends to get a feel for what the market’s likely expecting before the release hits.
Stay alert for news updates and sneaky early data leaks—they can be the first clues to surprises in the report.
Set clear entry and exit points keeping in mind how jumpy the market might be and your own comfort zone on risk.
Use stop-loss and limit orders—they’re your safety net against sudden price jolts during and right after the release.
Once the dust settles, dig into how the market reacts to see if it’s playing by the report’s rules and be ready to tweak your game plan accordingly.
Nailing a successful trade around the NFP really comes down to keeping a keen eye on the bigger economic picture and sensing how the market's mood is shifting.
Clearing up these misunderstandings really helps traders make smarter, more nuanced choices that actually stick.
Really get the most out of the meaning of non farm payroll data in trading by thinking of it as just one piece in a much bigger puzzle. Blend those NFP insights with solid technical analysis, and stay flexible enough to pivot as the market's mood swings with volatility.
Tired of missing opportunities and making suboptimal trading decisions? TrendSpider's cutting-edge platform automates complex technical analysis, saving you time and reducing human error.
With multi-timeframe analysis, dynamic alerts, backtesting, and customizable charting, you'll gain a competitive edge in identifying trends and making informed trades across global markets.
As a dedicated trader, you know the power of technical analysis in navigating the financial markets. TrendSpider is the cutting-edge tool you need to take your trading strategies to new heights. With its advanced charting capabilities and automated pattern recognition, TrendSpider empowers you to make informed decisions faster.
17 articles published
Transforming the field of technical analysis through innovative charting techniques, Scarlett specializes in pattern recognition and momentum trading strategies for equity markets.
Read Posts