


Financial Analysis
How The CBOE Put Call Ratio Shows Market Sentiment
Learn how the CBOE Put Call Ratio serves as a powerful indicator of market sentiment, helping invest...
Understanding the retail sales meaning gives us a vital economic barometer, offering a snapshot of how shoppers are opening their wallets at retail stores. When you keep an eye on retail sales, economists and policymakers can better gauge consumer confidence and catch the rhythm of economic momentum. They can even spot upcoming shifts in financial markets before they fully unfold.
Retail sales represent the total value of goods sold directly to consumers by retail businesses over a specific period, usually monthly or quarterly. This data often provides a fascinating glimpse into consumer spending habits, showing just how much households are shelling out for everything from clothing and electronics to food and cars.
Retail sales data often gets tangled up with wholesale sales or broader sales figures found in economic reports. Retail sales track what consumers actually buy for themselves while wholesale sales focus on goods passed between businesses or retailers and not the end customer.
You might think retail sales data is just another dry number on an analyst's spreadsheet, but trust me, it’s actually a key piece of the economic puzzle. This data gives us a real-time snapshot of consumer behavior—basically a way to peek under the hood of the economy and see how people are spending their hard-earned cash. Whether people are splurging on the latest gadgets or tightening their belts, these trends can signal bigger shifts ahead. It’s one of those things that, while it might seem straightforward, actually tells a pretty rich story once you know how to read between the lines.
Retail sales data serves as a timely and trusty barometer of consumer spending, which typically accounts for a big chunk of Gross Domestic Product (GDP) in many economies. Analysts tend to keep a sharp eye on retail sales, using them as an early heads-up for economic growth or slowdown—kind of like reading the room before the party gets going.
Retail sales numbers often punch above their weight by playing a key role in shaping monetary policy and guiding stock market trends and corporate strategies. They offer a window into the ebb and flow of demand and spending power across the economy and reveal patterns that are hard to ignore.
Retail sales data often acts as the economy’s pulse, giving us a real-time snapshot of whether things are cruising along smoothly or if some bumps are starting to show up on the road.
In the United States, the Census Bureau rolls up its sleeves each month to gather retail sales data from a wide spectrum of retailers. We are talking everything from cozy little boutiques to sprawling department stores, all pitching in their sales figures. Once collected, this data gets a careful once-over—compiled and seasonally adjusted—before being published regularly.
The Census Bureau handpicks a diverse mix of retail businesses to join the survey.
Retailers provide detailed sales reports usually broken down by category or product type so nothing gets lost in the shuffle.
The data spans a wide range of retail sectors including autos, apparel, electronics, and food stores.
Reports roll out every month keeping pace with the economic ups and downs and seasonal swings.
Seasonal and holiday adjustments smooth out the bumps and let the main trends shine through.
Retail sales usually fall into the big buckets you’d expect like autos, clothing, electronics and groceries. Breaking down sales by these categories helps analysts spot which sectors are rising, which are fading and how consumer tastes shift over time.
| Retail Category | Example Products | Approximate Sales Weight (%) |
|---|---|---|
| Autos | Cars, motorcycles, vehicle parts | Hovering around 20% |
| Apparel | Clothing, shoes, accessories | Sitting at about 15% |
| Electronics | TVs, computers, smartphones | Coming in at roughly 10% |
| Food and Beverage | Grocery items, dining out | Clocking in near 12% |
| Home Goods | Furniture, appliances | Just about 8% |
| General Retail | Department stores, online sales | We’re looking at approximately 35% |
Note: These percentages are just a ballpark and can shift depending on the country and when the data’s been gathered.
Retail sales reports touch on a handful of important metrics that are definitely worth keeping an eye on. These usually include monthly percentage changes and year-over-year comparisons as well as values adjusted for inflation.
One common mistake people often make is overreacting to changes in just a single month, which could simply be the result of seasonal quirks or fresh data updates. It’s an easy trap to fall into.
Retail sales data often spark noticeable shifts in markets and the economy and give everyone something to chew on. For example, when holiday sales come in strong they usually boost investor confidence and send stock markets climbing—kind of like a warm nudge in the right direction. Conversely, sudden drops tend to ring alarm bells about a possible economic slowdown and make people a bit jittery.
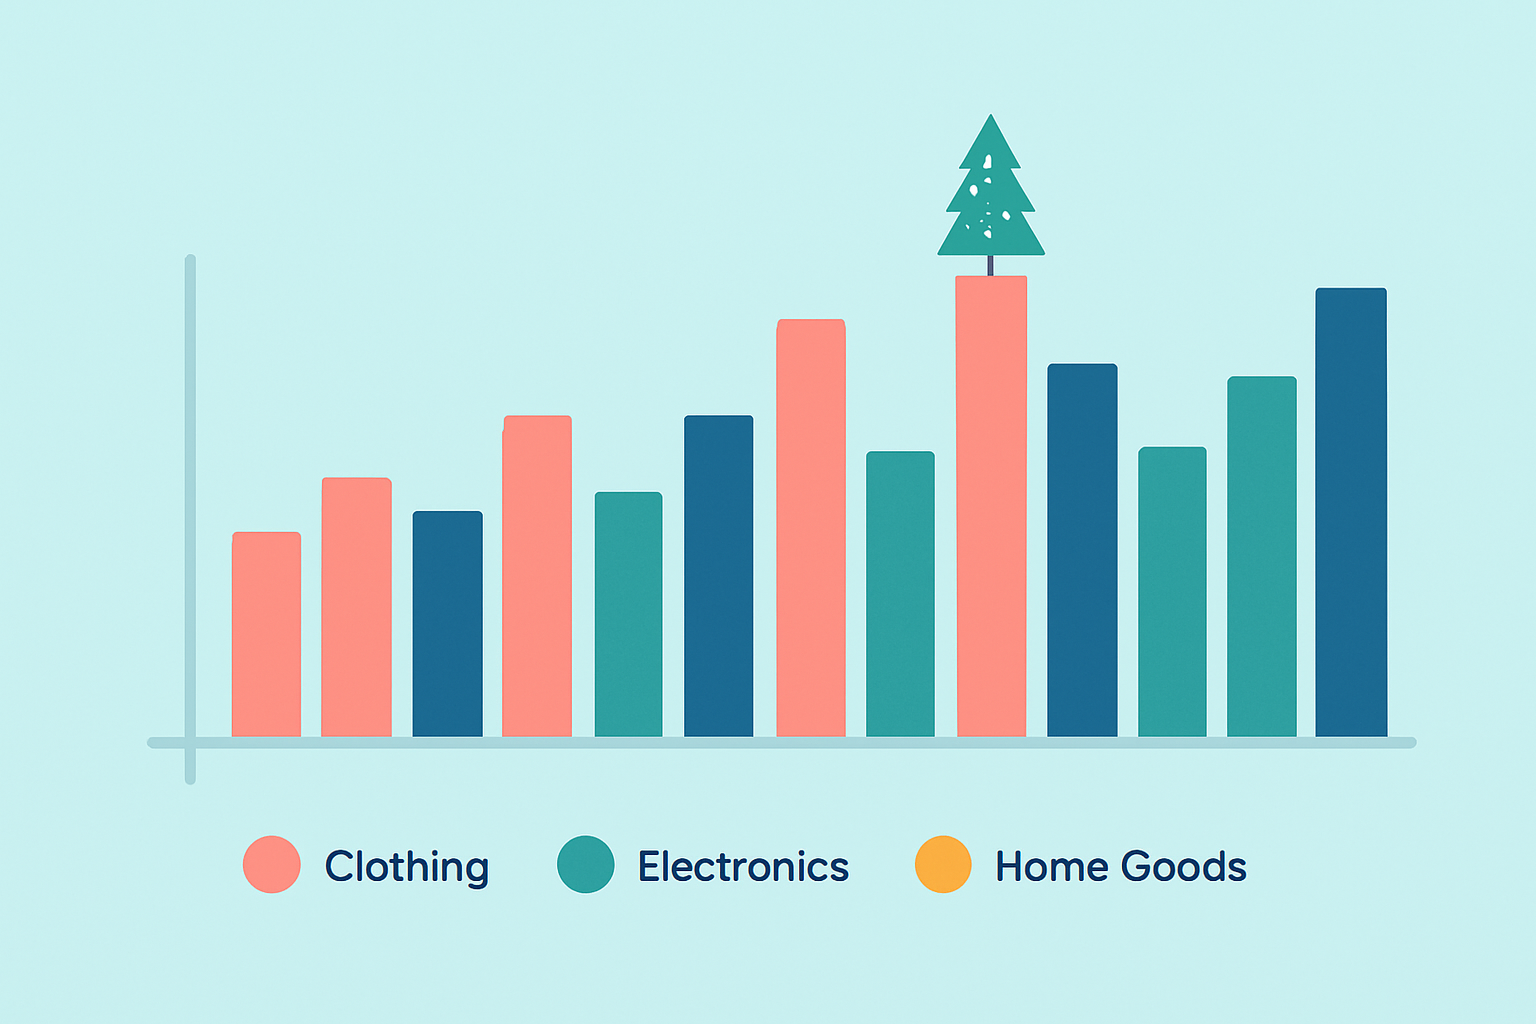
A bar graph illustrating monthly retail sales growth by category, highlighting seasonality such as holiday spikes.
Investors often keep a close eye on retail sales data to figure out the best moments to jump into stocks and to sniff out which sectors are steaming ahead or starting to stall. Businesses rely on this intel to map out strategies, keep their inventory from piling up and craft marketing campaigns that actually connect.
Investors keep a close watch on retail sales trends to get a real sense of the economy’s pulse, tweaking their portfolios here and there as the situation calls for it.
Companies don’t just guess—they forecast quarterly revenues and adjust their supply chain moves based on what they expect consumers to want.
Retail sales reports are like the secret sauce behind stock trading strategies, especially when it comes to consumer discretionary and retail sectors.
Businesses carefully fine-tune inventory levels and tailor their marketing efforts to keep pace with the ever-changing buying habits of customers.
Analysts dig into sector performance to uncover fresh market opportunities or to steer clear of looming risks, trying to stay one step ahead.
It’s no secret that diving into retail sales data can feel a bit like trying to read tea leaves—tricky and full of surprises. While this data offers valuable insights, it comes wrapped in a bundle of challenges and limitations that can trip up even the most seasoned analysts. From inconsistencies in data collection to the ever-changing whims of consumer behavior, navigating this landscape requires a blend of patience, savvy, and a pinch of skepticism. So, let’s roll up our sleeves and unpack what makes retail sales data both a treasure trove and a bit of a headache.
Understanding the retail sales meaning is useful but not without quirks. There can be annoying delays in reporting and it overlooks sales from the service sector. Every now and then transactions slip through the cracks unreported and this can affect accuracy. Seasonal adjustments might gloss over oddball events.

Struggling to improve your trading performance? Edgewonk's advanced analytics tools are designed to give you the edge you need.
With detailed trade journaling, robust strategy analysis, and psychological insights, you'll gain a comprehensive understanding of your strengths and weaknesses. Don't miss out on this game-changing opportunity.

With 20 years experience in commodity trading, Jasper provides insights into energy markets, precious metals, and agricultural futures with a focus on macroeconomic trends.
Read PostsLearn how the CBOE Put Call Ratio serves as a powerful indicator of market sentiment, helping invest...
Retail sales data is a key economic indicator that impacts trading decisions. This guide breaks down...

The JOLTS report reveals crucial labor market dynamics often missed by headline employment data. Lea...

The Non Farm Payroll report is a key economic indicator shaping trading strategies worldwide. This a...