


Tutorials
Getting Started with TrendSpider University Training
Unlock the full potential of TrendSpider with this authoritative guide to TrendSpider University tra...
TrendSpider is an automated technical analysis platform designed to take the headache out of charting and sharpen your trading decisions. This TrendSpider tutorial will show you how it saves buckets of time that would otherwise be spent slogging through manual data analysis.
TrendSpider lends a helping hand to traders no matter where they stand on the experience ladder by automating those fiddly, complicated technical analysis tasks—saving you from making silly mistakes along the way. It also offers some pretty clever tools like pattern recognition that really make a difference.

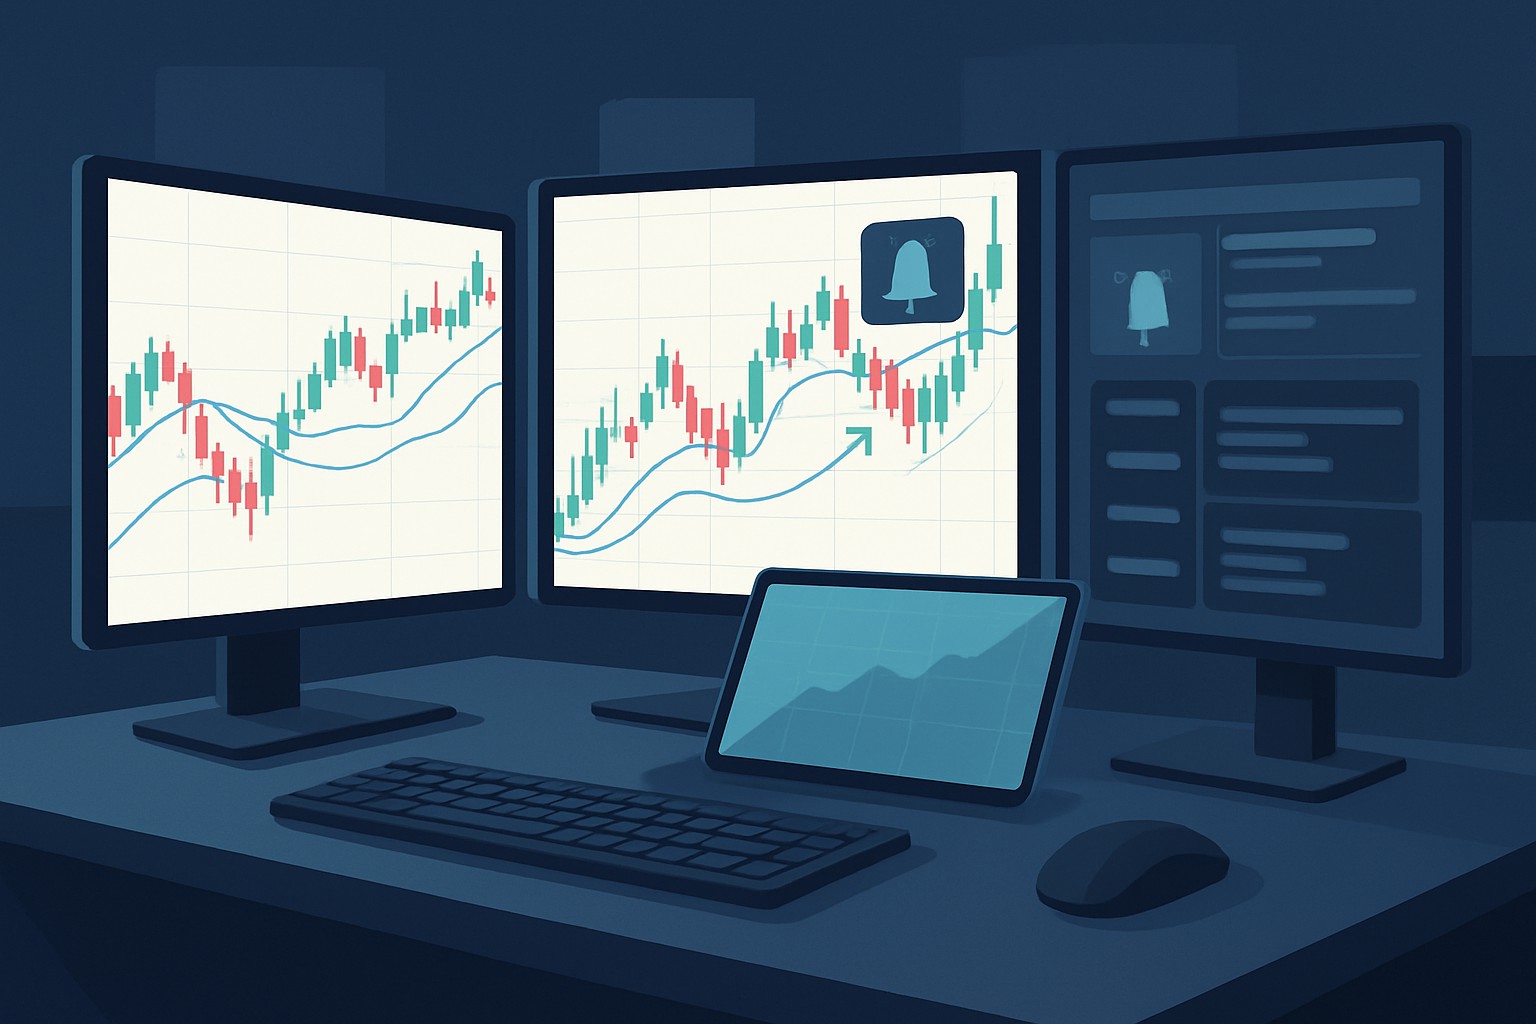
TrendSpider platform dashboard highlighting automated charting and technical analysis features
Kick things off with TrendSpider by creating an account on their website. Choose a subscription plan that actually fits your trading style—no one-size-fits-all here. Then, set up your default watchlists and fine-tune those notifications.
Head over to the TrendSpider website and hit the "Sign Up" button to create a fresh account using your email address.
Pick a subscription plan—Basic, Pro or Premium—depending on which features catch your eye and what fits comfortably in your wallet.
Set up your default watchlists by adding the stocks or assets you want to keep a close watch on without breaking a sweat.
Tweak your notification settings like email or SMS alerts so you’re always in the loop and won’t miss a beat.
If you are feeling adventurous, link your brokerage account to make trading straight from TrendSpider a breeze.
TrendSpider's interface is crafted to keep your analysis smooth and efficient. On the main dashboard you’ll find a charting area perfect for technical analysis and panels for scanning and alerts. Plus there’s a watchlist manager to help you keep a close eye on your favorite assets.

Comprehensive view of TrendSpider’s charting environment with scans and alerts panels
Let's dive into how you can really squeeze the juice out of TrendSpider's Smart Scans to spot those trading opportunities that might otherwise slip through the cracks. Whether you are a seasoned trader or just dipping your toes in, these tips can help you sharpen your edge and maybe even enjoy the ride a bit more.
Smart Scans take the headache out of complex technical stock screening by juggling multiple indicators and patterns all at once.
Open the Smart Scan feature from the main menu where you’ll find both preset and custom scans waiting for you.
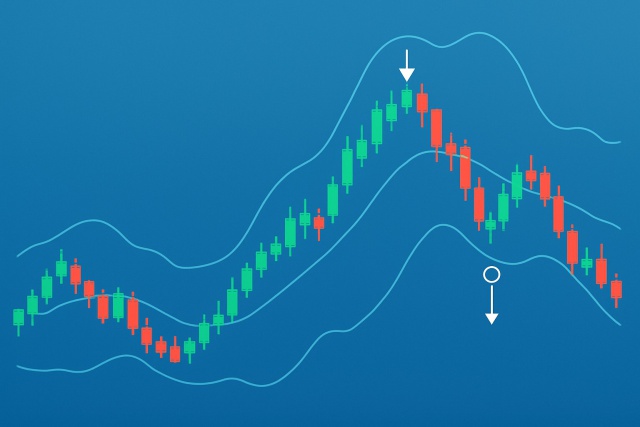
Choose from preset scans like Moving Average Crossovers or Bollinger Band Breakouts—these are all set up and ready to go.
Tweak the scan criteria by adding or swapping indicators, timeframes or asset filters until it feels just right for what you need.
Take a close look at the scan results and check the charts linked to each stock that pops up—they often tell the real story.
Save your scans for quick access down the road and set up alerts from these results so you’re always in the loop without lifting a finger.
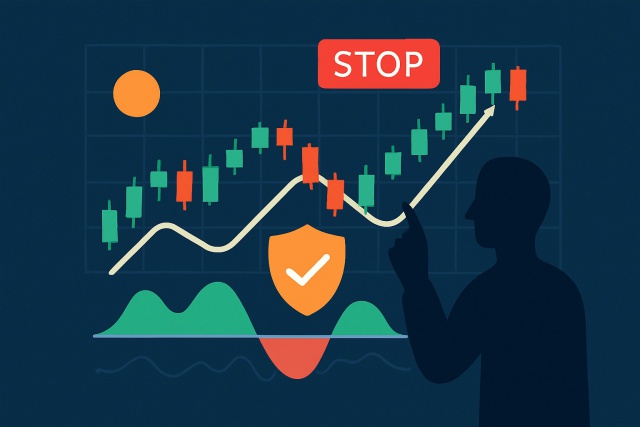
Automated alerts are a real lifesaver when it comes to staying on top of market shifts without being glued to your charts 24/7. You can easily set triggers based on indicators or specific price points and get instant notifications that keep you in the loop.
Head over to the Alerts section and click the "set up a new alert" button.
Pick a trigger condition that catches your eye—think RSI crossing or price smashing through support or resistance or spotting a candlestick pattern.
Decide how you want to get pinged: Email, app push, or good old SMS; it’s totally up to you.
Keep your alerts fresh by tweaking or deleting them when needed. Staying organized pays off in the long run.

What You Get
Powerful charting tools that let users clearly spot market trends without breaking a sweat. It supports a wide range of indicators and customizable interfaces, making it a breeze to interpret market movements even on the busiest trading days.
Helps traders catch key patterns and trends more effortlessly, paving the way for smarter, better-informed decisions.
Harnesses artificial intelligence to automatically pick up trading patterns and signals as they happen. This nifty feature cuts down on the manual grunt work and shines a light on potential trade opportunities right when they pop up.
Gives your trading a serious boost by rapidly identifying high-probability setups without you having to babysit the process.
A highly customizable alert system that nudges users based on complex criteria they set themselves — whether it’s price shifts, indicators, or specific patterns making their debut.
Keeps traders in the loop about important market moves as they happen, enabling quicker reactions and smarter risk control—because timing is everything.
Lets users run their trading strategies through the wringer against historical market data to get a clear sense of how these might play out before putting real money on the line.
Reduces risk by giving traders a chance to fine-tune and verify their strategies based on what’s happened in the past, before stepping into the live arena.
A comprehensive suite of automated tools that take the headache out of technical analysis. These tools deliver sharp, reliable insights while saving you hours compared to doing it all by hand.
Boosts trading efficiency and consistency by cutting down on manual calculations and minimizing human slip-ups.
An intuitive and neatly organized platform designed with ease in mind, so new users can hit the ground running without getting bogged down in complexity.
Lets traders of all stripes—especially beginners—dive straight into key features quickly and without the usual frustration.
Offers access to a rich assortment of global market data and securities, opening up a world of trading possibilities far beyond local borders.
Supports well-rounded trading strategies by bringing insights from a variety of markets and asset classes right to your fingertips.
TradingView offers robust manual charting tools that really click with hands-on traders who like to take the reins themselves. On the flip side, TrendSpider’s automated features—think Smart Scans and dynamic alerts—tend to give beginners a leg up by slashing analysis time and smoothing out the decision-making process.
New users often set alert parameters so sensitive they end up swimming in a sea of false signals. In a TrendSpider tutorial, you'll learn that starting with broader criteria and then tightening things as you gain confidence usually works best. To avoid scan overload, it’s smart to keep filters simple at the get-go because piling on too many can either cause you to miss good trades or turn decision-making into a real headache.

Struggling to improve your trading performance? Edgewonk's advanced analytics tools are designed to give you the edge you need.
With detailed trade journaling, robust strategy analysis, and psychological insights, you'll gain a comprehensive understanding of your strengths and weaknesses. Don't miss out on this game-changing opportunity.

Driven by a passion for democratizing trading knowledge, she focuses on behavioral finance and psychological aspects of market decision-making.
Read PostsUnlock the full potential of TrendSpider with this authoritative guide to TrendSpider University tra...
Master the art of risk control in momentum trading. Discover step-by-step strategies to safeguard yo...
Master trading with Bollinger Bands by understanding volatility, setup patterns, and risk management...

Learn how the True Range indicator captures market volatility and price swings, empowering traders t...