IAO Alliance
  • Trade Insights
    • Technical Analysis
    • Financial Analysis
  • Trading Strategies
    • Swing Trading
    • Short-Term Trading
    • Algorithmic Trade Execution
  • Toolkit
    • Charting Software
    • Trade Execution
    • Backtests
    • Data Advantage
  • Markets
    • Foreign Exchange
    • Options Strategies
    • Futures Trading
    • Cryptocurrencies
    • Stocks
  • Risk Management
    • Position Sizing
    • Stop Losses
  • Knowledge Base
    • Trading Terminology
    • Tutorials
  • Products
    • TradingView
    • TrendSpider
  • Brokerages

Using The True Range Indicator To Spot Price Swings

Using The True Range Indicator To Spot Price Swings

The True Range indicator is a powerful yet often underestimated tool in technical analysis that helps capture the full scope of market volatility, including those sneaky gaps and limit moves.

What Exactly Is the True Range Indicator, Anyway?

The True Range indicator measures volatility by picking the largest of three figures: the difference between the current period's high and low, the gap between the current high and previous close and the gap between the current low and previous close. This approach cleverly catches price gaps and limit moves and often paints a sharper picture of market activity than relying on the daily range alone.

  • The difference between the current high and the current low giving you a quick snapshot of the day's range.
  • The absolute difference between the current high and the previous close which helps track how far prices have moved upward since last time.
  • The absolute difference between the current low and the previous close showing just how far the price has dipped compared to the previous close.

Unlike your run-of-the-mill daily range that simply eyeballs the difference between a period's high and low, the True Range digs a bit deeper by factoring in those pesky price gaps that sneak in when markets open. You often see this kind of action popping up after big news events or during wild, rollercoaster-like market swings.

Step-by-Step Guide on Calculating the True Range Indicator just straightforward steps to get you there.

Calculating the True Range begins by examining three values for each period. The high hit $55 and the low dipped to $48. Next, you figure out three differences: high minus low (7), the absolute value of high minus the previous close (5) and the absolute value of low minus the previous close (2). The True Range is simply the largest of these numbers—so in this case, it’s 7.

DayHighLowPrevious CloseHigh - LowHigh - Prev CloseLow - Prev CloseTrue Range
15548507527
25653553123
35450564266
45149542355
55352511212

Why Does the True Range Really Matter When You’re Tracking Price Swings?

The True Range indicator gives traders a clearer picture of how wild and intense price swings can get by capturing the entire range of price movement including jumps. This handy tool helps traders better anticipate sneaky breakouts, read market momentum, and adjust their risk management tactics.

  • It uncovers those sneaky gaps and boundary shifts that your typical daily ranges tend to miss, putting a spotlight on volatility you might have otherwise overlooked.
  • It paints a clear picture of just how actively prices are dancing beyond the usual ranges within a given period.
  • True Range often shines a light on the muscle behind potential breakouts or reversals, giving you a better sense of their strength.
  • It’s pretty handy for setting stop-loss levels that actually reflect real market jitters, helping you avoid being caught off guard.

"> Measuring volatility accurately can be the secret sauce that takes you from shooting in the dark to making trades with real confidence—trades that actually catch genuine market moves. The True Range indicator usually plays a handy role in bridging that gap."

How Traders Typically Use the True Range Indicator in Practice (and Why It Matters More Than You Might Think)

Traders lean on the True Range indicator across a variety of strategies whether they are in it for swing trading or crunching the numbers intraday. It is a handy tool for sizing up volatility and helping them tweak position sizes just right. It also confirms the punch behind breakouts and sharpens stop-loss and take-profit levels as the market dances along.

1

Adjust your position size by watching True Range values. When the True Range is large it signals wider price swings. Dialing down your position size can help keep risk in check.

2

Watch for sudden spikes in True Range as they often confirm the strength of a breakout when prices pass resistance or support levels.

3

Use True Range to set your stop-loss and take-profit points. This trick can save you from exiting too soon when the market gets wild.

4

Notice when True Range values tighten up, indicating low volatility. These quiet moments often hint that a breakout is near and ready to stir things up.

When a trader notices a sudden spike in True Range for a cryptocurrency on a platform like Binance they usually tighten their stop-loss to lock in those hard-earned profits. Conversely, when the True Range is low they start gearing up for a potential breakout and tweak their position size to stay in sync with the market's mood.

How True Range Really Measures Up Against Other Volatility Indicators

True Range is a vital piece of the puzzle when it comes to grasping volatility. It’s usually considered alongside trusty sidekicks like the Average True Range (ATR), Bollinger Bands and plain old daily ranges. ATR smooths out True Range values over time to reveal average volatility. This means it’s more laid-back and less likely to freak out over sudden price jumps. Bollinger Bands use standard deviation to wrap volatility bands around the price and make it easier to tell when an asset might be running hot or has cooled off too much. True Range gives you the raw unfiltered picture of volatility, gaps and all while Bollinger Bands add a little direction to the story.

IndicatorCalculation OverviewBest Use CaseStrengthsWeaknesses
True RangeThe largest of (High minus Low), absolute difference between High and previous Close, or Low and previous CloseMeasuring raw volatility including gapsCaptures price gaps and limit moves quite well, even when things get a bit wildCan be pretty jumpy without some smoothing to calm it down
Average True Range (ATR)A smoothed average of True Range values over a set periodTracking average volatility trendsCuts through the noise to give a clearer picture of trendsTends to lag behind sharp spikes, so don’t expect it to react instantly
Bollinger BandsPrice plus or minus (k times the standard deviation of price)Highlighting volatility bands and possible reversal pointsFrames volatility nicely within price trends, showing when things might be stretchedParameter settings need a careful touch—get them wrong and it can mislead
Daily RangeDifference between High and LowBasic measure of intraday volatilityStraightforward and quick to calculate, no fussDoesn’t catch gaps or overnight moves, so can miss some action

True Range serves as the mathematical backbone of the Average True Range (ATR) indicator, which cleverly smooths out the noise to paint a clearer picture of longer-term volatility. Traders often lean on raw True Range when jumping into the fast-paced world of intraday trades or handling gap-sensitive strategies that call for lightning-quick reactions to price jumps.

Common Misunderstandings and Challenges When Working with the True Range Indicator What You Might Not Expect

  • Thinking True Range shows where prices are headed. In reality, it’s more a measure of how jumpy the market is rather than its direction.
  • Relying solely on True Range to nail down exact entry points without double-checking other signals is like trying to cook a fancy meal with just salt.
  • Assuming a high True Range always means the trend will keep chugging along can be misleading. It can also signal a market about to take a breather or make a sharp U-turn.
  • Ignoring the bigger picture such as breaking news or broad market trends when trying to interpret sudden spikes in True Range can cause mistakes. Sometimes the details in the headlines really do matter.

I’ve found it’s usually smarter to buddy up True Range with other technical indicators or chart patterns, like moving averages or support and resistance levels.

Key Tips for Seamlessly Weaving the True Range Indicator into Your Trading Strategy

Start by wrapping your head around how the true range indicator is calculated, and don’t hesitate to tinker with it on charting platforms like TradingView or TrendSpider. These tools come with handy built-in features that make the whole visualization process a breeze. I’ve found that pairing True Range insights with other volatility or trend indicators can give you a much clearer picture. From there, take your time to gently tweak your position sizing and stop loss settings—there’s no rush.

  • Get familiar with the True Range calculation and its main components by diving into charts and real-world examples, so you will find it much clearer that way.
  • Keep an eye on how True Range shifts during different market moods by digging into historical price data. It’s like watching the market's heartbeat.
  • Pair True Range with other trend or momentum indicators to paint a more complete picture because relying on just one indicator rarely tells the whole story.
  • Adjust your position size and stop-loss levels based on the volatility that True Range reveals since it’s a handy way to stay on your toes.
  • Make it a habit to review how your strategy is holding up and don’t be shy about fine-tuning because the market likes to keep us guessing.

Elevate Your Trading Game with TradingView

Are you tired of juggling multiple tools for your trading needs? TradingView is the all-in-one platform that streamlines your analysis and decision-making.

With its powerful charting capabilities, real-time data, and vibrant community, TradingView empowers traders like you to stay ahead of the market. Join thousands who trust TradingView for their trading success.

Discover TradingView
Advertisement

Unleash Your Trading Potential with Binance

Are you ready to elevate your trading game? Binance, the leading cryptocurrency exchange, offers a seamless platform for traders of all levels. With its user-friendly interface and powerful tools, you can navigate the dynamic world of digital assets with confidence.

  • Access a vast crypto marketplace
  • Utilize advanced trading strategies
  • Enjoy secure and reliable transactions
Join Binance Today
Binance + IAO Alliance
Binance
Ad
Coinbase + IAO Alliance
Coinbase
Ad
Freya Hartwell

Freya Hartwell

15 articles published

Known for demystifying complex derivatives trading through accessible education, this former Wall Street trader turned educator empowers retail investors with institutional-level strategies.

Read Posts

Recommended Reading

Inside Bar Pattern To Spot Breakouts And Reversals
Technical Analysis

Inside Bar Pattern To Spot Breakouts And Reversals

Discover how inside bar patterns signal key market pauses and possible breakouts or reversals. This...

Jasper Blackstone • Sep 9, 2025
What Is a Trend Line in Technical Analysis?
Technical Analysis

What Is a Trend Line in Technical Analysis?

Trend lines are essential tools in technical analysis that help traders identify market direction an...

Reginald Thornfield • Sep 3, 2025
Recognizing an Evening Star Candlestick Pattern in Charts
Technical Analysis

Recognizing an Evening Star Candlestick Pattern in Charts

Discover how to recognize the evening star candlestick pattern—a powerful signal highlighting potent...

Scarlett Whitmore • Sep 25, 2025
How to Trade Using a Bollinger Bands Strategy
Technical Analysis

How to Trade Using a Bollinger Bands Strategy

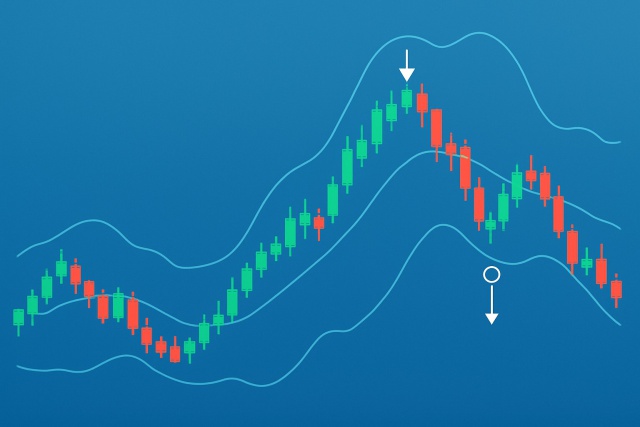
Master trading with Bollinger Bands by understanding volatility, setup patterns, and risk management...

Scarlett Whitmore • Sep 22, 2025
Binance + IAO Alliance
Binance
Ad

Trending Now

How To Set Up Paper Trading in TradingView For Beginners
TradingView • 2 months ago
Best TradingView Indicators Traders Use To Spot Trends
TradingView • 2 months ago
Reading Heikenashi Candles To Understand Trend Strength
Technical Analysis • 3 months ago
Coinbase + IAO Alliance
Coinbase
Ad

Links

  • Contact Us

Trade Insights

  • Technical Analysis
  • Financial Analysis

Trading Strategies

  • Swing Trading
  • Short-Term Trading
  • Algorithmic Trade Execution

Toolkit

  • Charting Software
  • Trade Execution
  • Backtests
  • Data Advantage

Markets

  • Foreign Exchange
  • Options Strategies
  • Futures Trading
  • Cryptocurrencies
IAO Alliance © 2025
[email protected]