

Technical Analysis
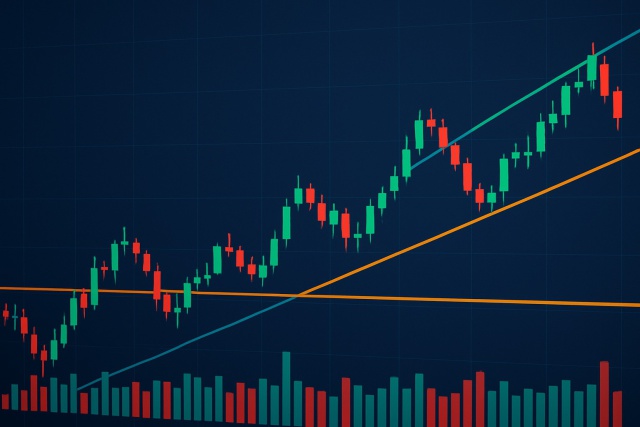
Reading Pattern Triangle To Predict Price Direction
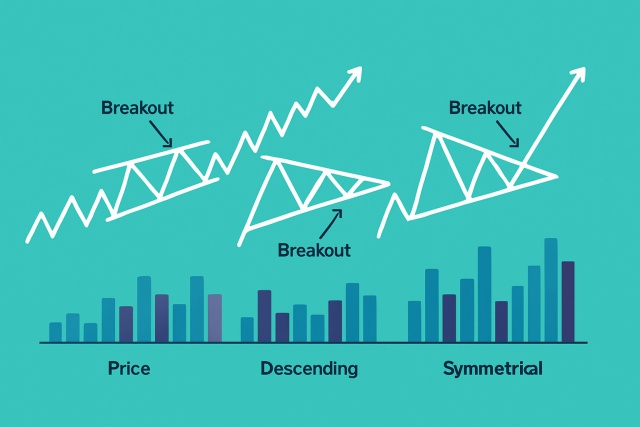
Discover how pattern triangles help traders predict price movements. This guide breaks down triangle...
This guide takes you by the hand to navigate Bollinger Bands and helps you spot trading chances and manage risk like a seasoned trader—even if you’re just getting your feet wet.
The Bollinger Bands strategy has won the hearts of many technical traders since it shines a light on market volatility and hints at those savvy moments to jump in or gracefully step out of trades
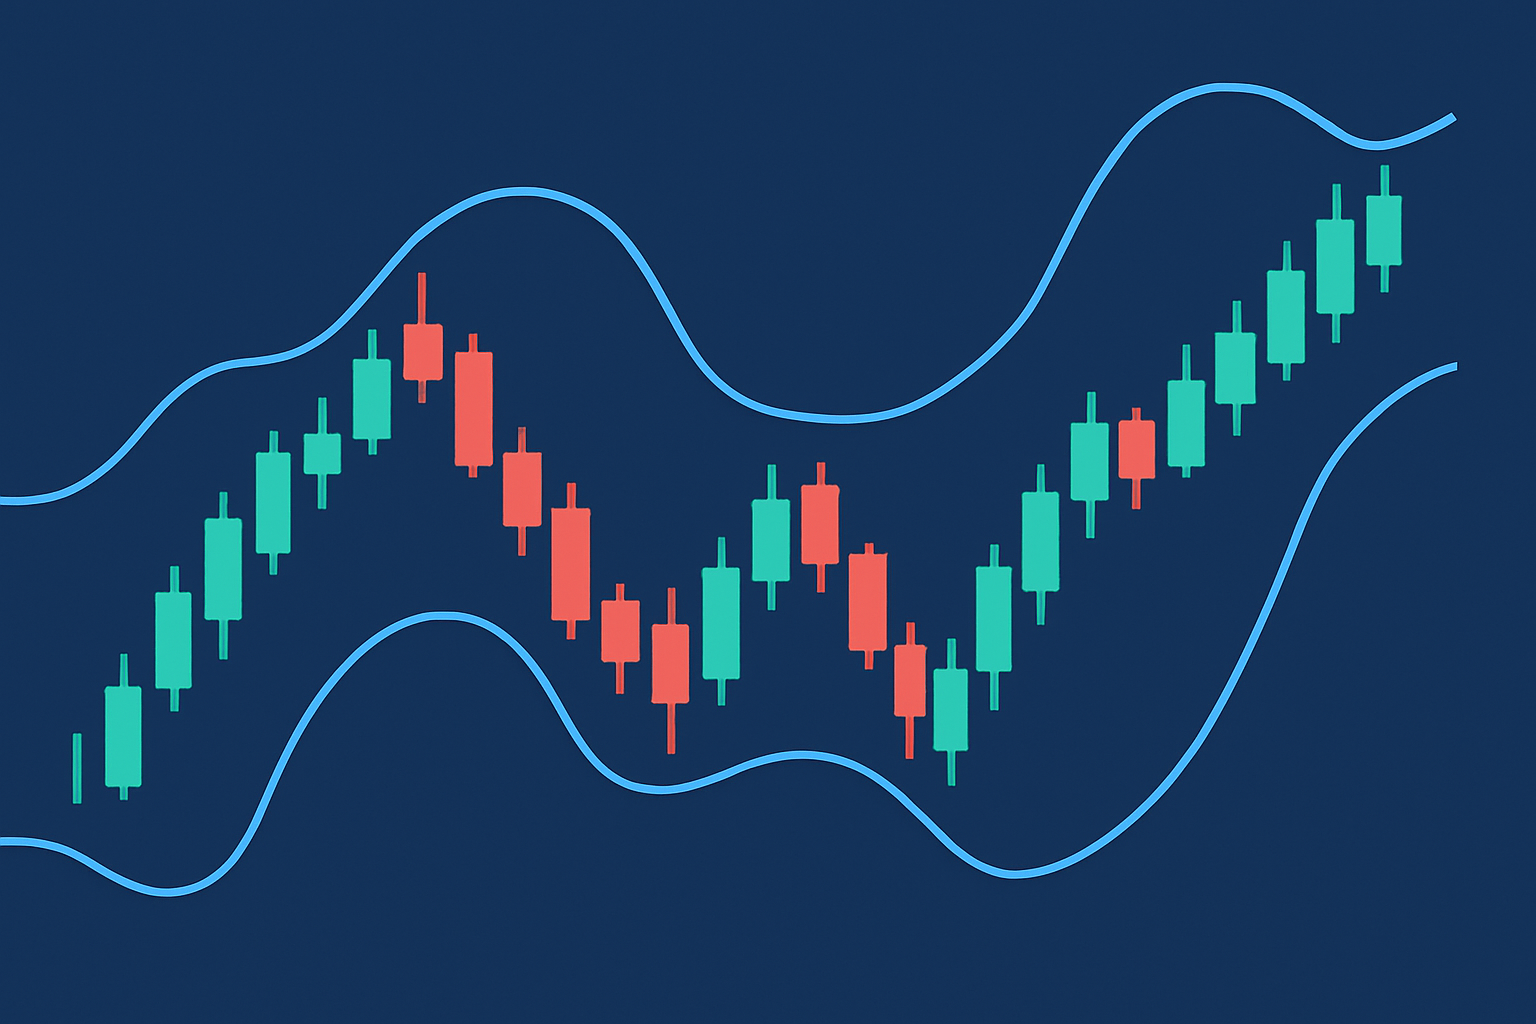
Bollinger Bands are made up of three lines: a central simple moving average (SMA), flanked by an upper band and a lower band. Typically, these bands sit two standard deviations away from the SMA.
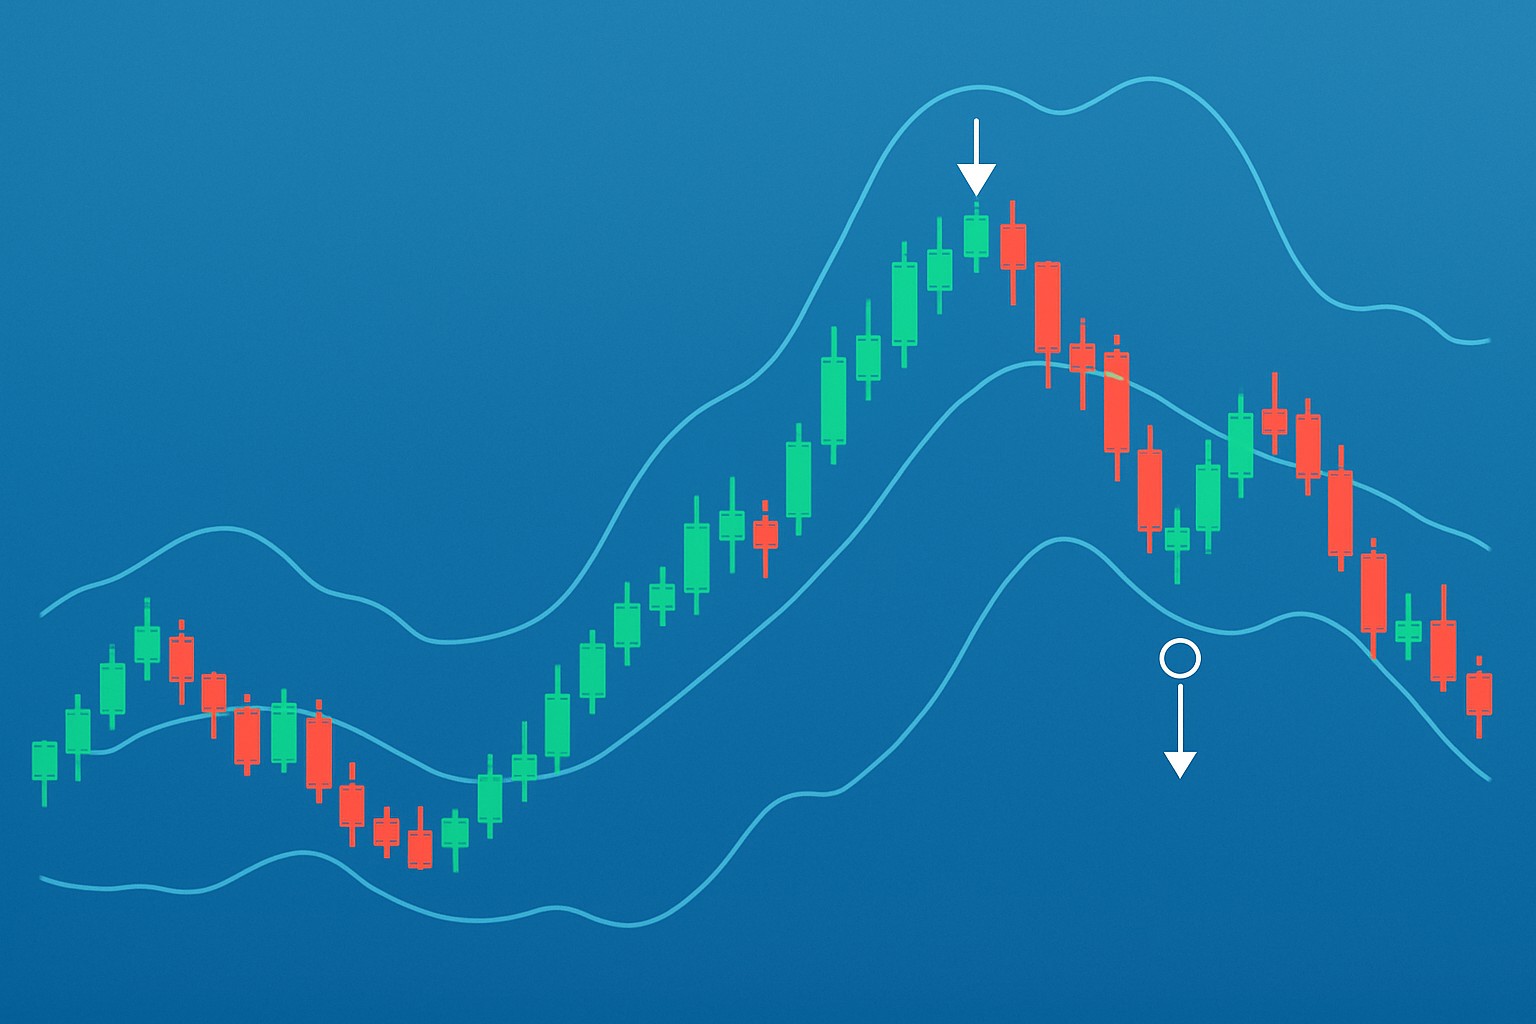
Example of a price chart featuring Bollinger Bands illustrating the upper, middle, and lower bands.
Adding Bollinger Bands to your trading chart is quite straightforward. Most platforms typically come pre-loaded with a 20-period SMA and set the bands at two standard deviations by default. You’re free to tweak these settings to better suit the asset’s volatility or your own unique trading style
Fire up your favorite trading chart and pick the asset you’re keen to analyze.
Navigate over to the indicators section or menu within your trading software—usually where all the magic begins.
Hunt down "Bollinger Bands" in the lineup of available indicators.
Select Bollinger Bands and take a quick peek at the default settings—typically a 20-period moving average paired with 2 standard deviations.
Feel free to tweak those settings based on how the asset tends to behave, then go ahead and apply the indicator to your chart.
A key part of the Bollinger Bands strategy is having the know-how that price tends to swing back toward the middle band, which represents the average. The upper and lower bands serve as handy markers for potential reversal zones.
Ready to dive into the world of Bollinger Bands? This guide will walk you through each step with a steady hand, helping you navigate the twists and turns of trading using this classic strategy. Whether you’re a newbie or just brushing up, stick around we’ll keep things straightforward and maybe even a little fun.
Using Bollinger Bands in live trading typically involves getting a good read on the trend’s direction and keeping a close eye on how prices dance around the bands. You should double-check signals with other indicators to avoid surprises and manage risk carefully with stop-loss and take-profit orders.
Start getting a feel for the overall trend and pay close attention to how the price behaves around the bands—does it usually bounce off or actually break through? It’s a subtle but important detail.
Keep an eye out for a clear entry signal like spotting the price bouncing off the lower band during an uptrend or the upper band in a downtrend. These moments often speak louder than words.
Bring in extra indicators like RSI or volume to back up what you’re seeing and boost your confidence before jumping into the trade.
Be smart with your stop-loss placement—set it just beyond the band opposite your entry point to protect yourself from pesky false breakouts that mess with traders.
Aim for previous support or resistance levels or maybe the band’s midline when taking profits. This way, you’re locking in gains in a smart and measured fashion instead of just hoping for the best.
Traders often keep a keen eye out for specific Bollinger Band patterns like squeezes, breakouts and double tops or bottoms when timing their entries and exits. These patterns usually highlight shifts in volatility and price momentum and can be handy for making informed decisions.
Squeeze out the best results with Bollinger Bands by pairing them with some trusty confirmation indicators. Tweak the settings depending on the asset you’re trading.
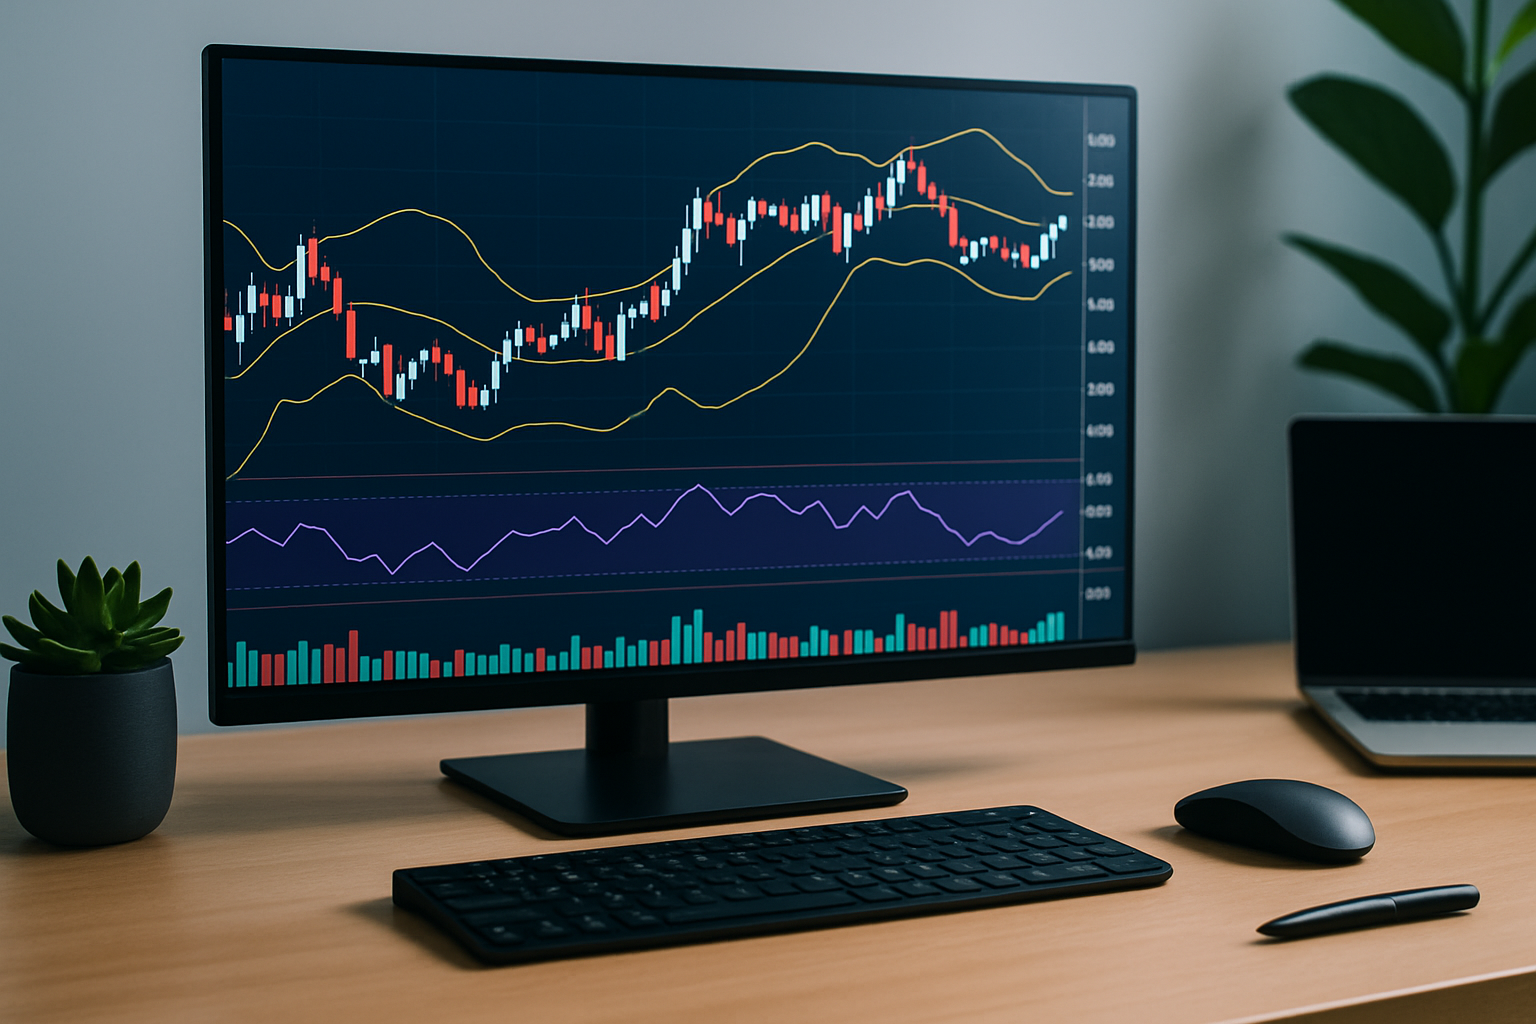
Example of a comprehensive trading setup integrating Bollinger Bands with volume and RSI indicators on a chart.
Picture the price snugly hugging the bands, creating a classic squeeze in this bollinger bands strategy. Then just like clockwork, the bands suddenly widened with a strong breakout above the upper band. The trader jumped in with a long position and thoughtfully placed a stop-loss just below the middle band—resulting in a nice little rally that paid off.

Tired of missing opportunities and making suboptimal trading decisions? TrendSpider's cutting-edge platform automates complex technical analysis, saving you time and reducing human error.
With multi-timeframe analysis, dynamic alerts, backtesting, and customizable charting, you'll gain a competitive edge in identifying trends and making informed trades across global markets.

Transforming the field of technical analysis through innovative charting techniques, Scarlett specializes in pattern recognition and momentum trading strategies for equity markets.
Read PostsDiscover how pattern triangles help traders predict price movements. This guide breaks down triangle...
Trend lines are essential tools in technical analysis that help traders identify market direction an...

Hidden bullish divergence is a key technical indicator revealing strong buying pressure beneath unce...

Discover the wedge falling pattern's secrets and learn step-by-step how to trade this powerful techn...