


Trading Strategies
What Is ICT In Trading Compared To Other Methods?
Discover what ICT trading is and how it differs from other strategies. Learn to decode institutional...
This article guides traders through practical strategies and tools to boost their chances of success with day trading on TradingView.
Day trading is all about making snap decisions and nailing your execution, so having solid trading strategies for day trading in your toolkit is absolutely important if you want to come out ahead. A powerful charting platform like TradingView can seriously up your game by letting you track market movements in real time and jump on profit opportunities as they pop up. We will take you through practical, step-by-step strategies for day trading using TradingView charts covering everything from setting up your workspace just right to making trades with that confident edge.
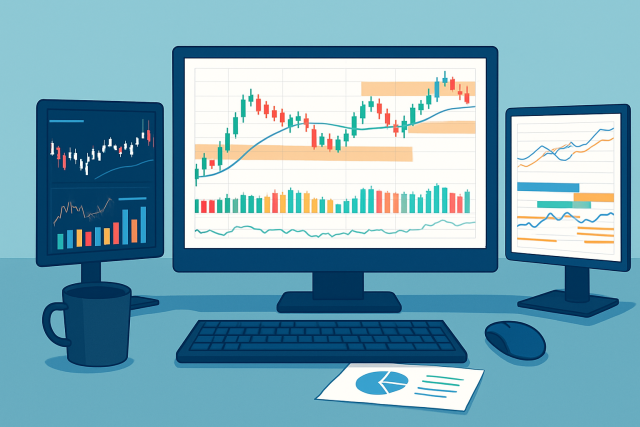
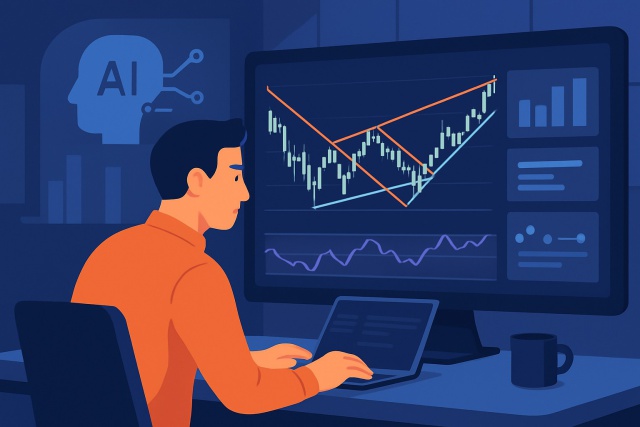
Get started with TradingView by creating a free account on their website—easy as pie. Once you are logged in, spend a little time exploring the interface and customizing your charts the way you like. Get a feel for basic tools like indicators and drawing features.
Customized TradingView chart interface tailored for day trading with key indicators applied
Successful day trading hinges on strategies that can keep up with those fast-moving, often unpredictable markets and the tight timeframes traders face. TradingView’s flexible charts and indicators are like having a trusty toolkit at your side—giving you everything you need to spot those golden opportunities and manage risk like a pro.
Scalping: Snapping up quick trades to cash in on tiny price moves before anyone else blinks.
Momentum Trading: Riding those powerful price waves, hoping to catch fast profits while the trend is still hot.
Breakout Trading: Keeping a close eye on critical price levels and jumping in right when prices decide to break free.
Reversal Trading: Spotting those telltale signs where a trend might take a sharp U-turn and daring to trade against the current flow.
Range Trading: Buying near support and selling close to resistance, making the most while the market just meanders sideways.
Each strategy zeroes in on different market behaviors like having your own playbook for various game scenarios. Scalping aims for quick wins and executes trades in the blink of an eye on short timeframes—it is the sprint of trading styles. Momentum trading rides strong directional moves and often leans on trend indicators to keep you in the groove. Breakout trading waits patiently for prices to bust through key levels you marked on your TradingView charts like a skilled surfer catching the perfect wave. Reversal trading scouts for subtle shifts using oscillators while range trading sticks to its knitting by operating within well-defined support and resistance zones.
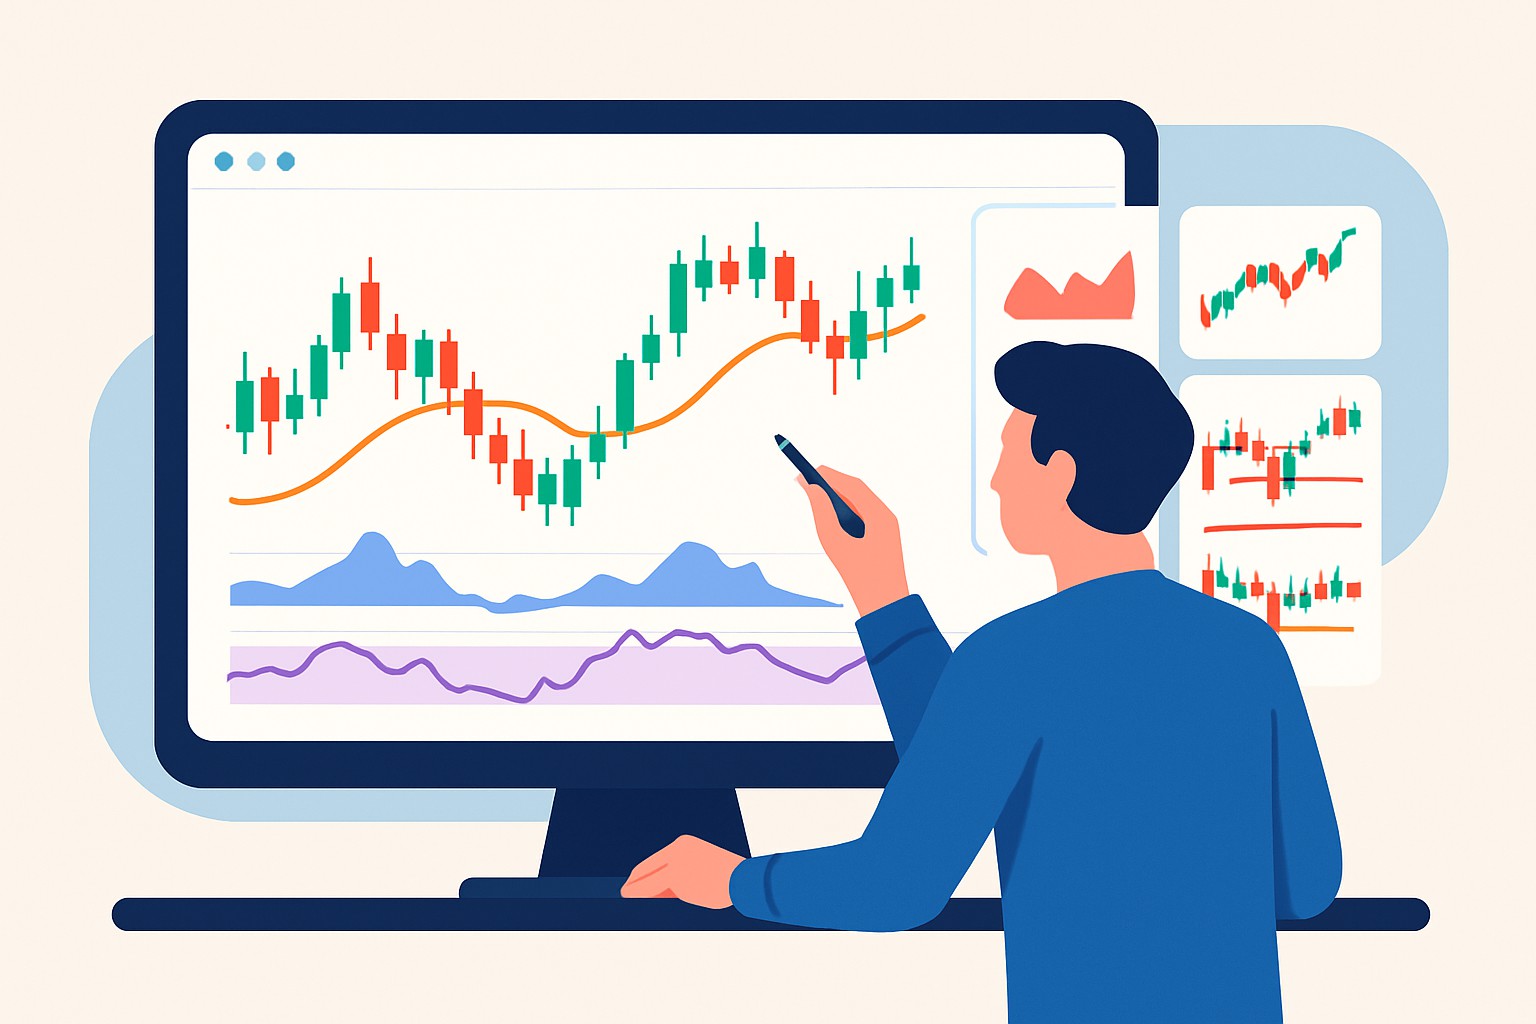
Using these indicators and drawing tools on TradingView charts helps traders zero in on the best moments to jump in or out of trades. Take the RSI for instance—it can hint when a stock is flirting with being overbought or oversold, giving you a little heads-up before things get dicey. Moving averages on the other hand quietly confirm the bigger trend, like a reliable friend nodding along. Bollinger Bands reveal those sneaky periods of low or high volatility that often precede a breakout, so you’re not caught off guard. Volume adds another layer, offering clues about the strength behind price moves—kind of like the cheerleader rallying the crowd. Meanwhile, drawing trendlines and spotting support and resistance zones make managing your trades and setting sensible stop losses feel a lot more straightforward.
Annotated TradingView chart demonstrating multiple indicators and drawing tools in use for strategic trade analysis
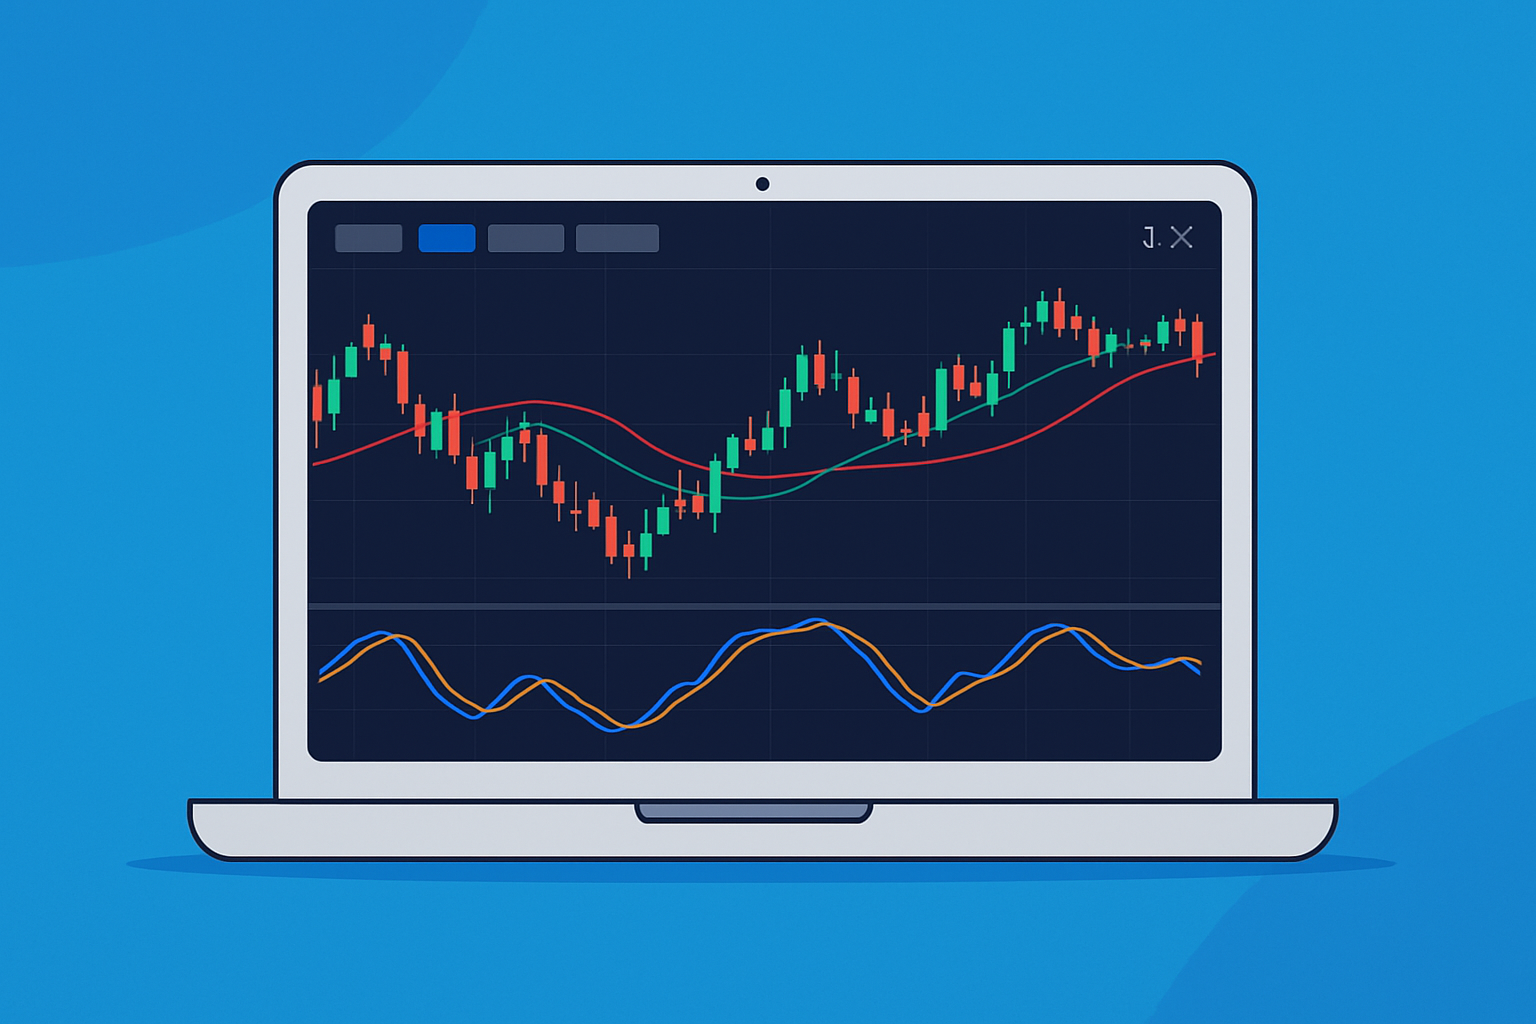
Let us dive into a sample trade using TradingView charts. This hands-on example should make things clearer when analyzing charts and spotting trading signals. It also covers placing orders like a pro and managing risk with stop losses and profit targets.
Carefully scan the chart for your chosen market and timeframe focusing on clear price action signals that are reliable.
Look for specific trading cues like a breakout above resistance or subtle RSI divergence because these hints can make all the difference.
Review your setup using other reliable indicators such as volume spikes or moving average crossovers. This helps you get a second opinion before the big move.
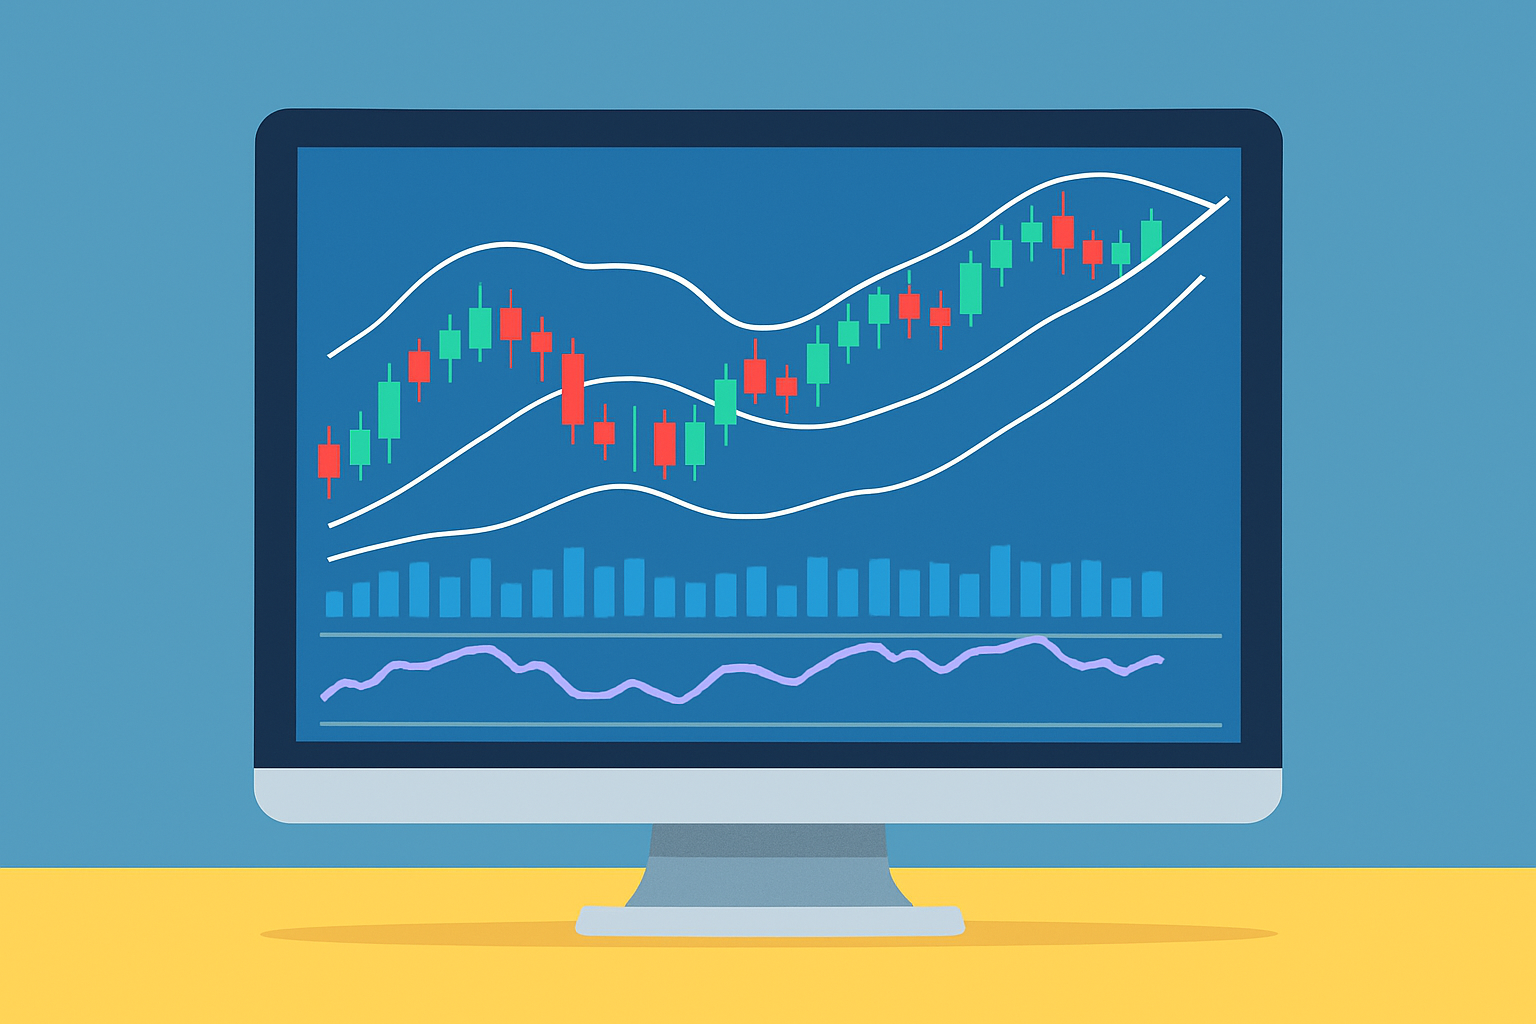
Execute your trade on your preferred platform. Binance is known for its deep liquidity and low fees.
Set your stop loss just below key support levels to manage risk and choose a take profit target that feels appropriate without being greedy or too cautious.
Stay alert and monitor price movements closely ready to close your trade if the market changes direction or you reach your target profit.
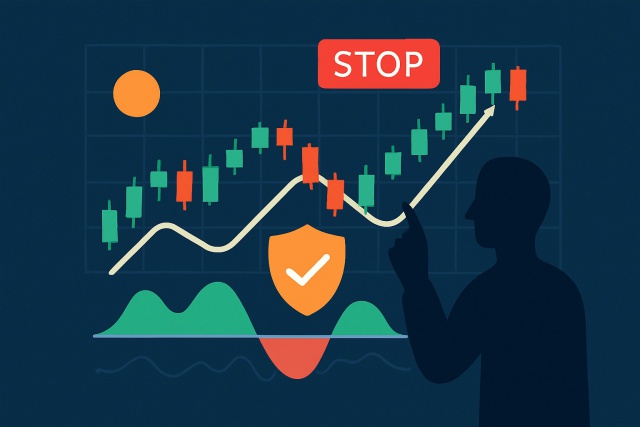
Managing risk is absolutely important when it comes to protecting your capital and keeping your profitability intact over the long haul in day trading. Quite often, the biggest blunders happen when emotions take the wheel or when trading strategies for day trading get tossed out the window like yesterday’s news.
Discipline and risk management really lay the groundwork for successful day trading. In fact, protecting your capital usually plays a much bigger role than rushing headlong into every trade that comes your way.

Struggling to improve your trading performance? Edgewonk's advanced analytics tools are designed to give you the edge you need.
With detailed trade journaling, robust strategy analysis, and psychological insights, you'll gain a comprehensive understanding of your strengths and weaknesses. Don't miss out on this game-changing opportunity.

Transforming the field of commodities trading through sustainable investing principles, she bridges traditional finance with ESG considerations.
Read PostsDiscover what ICT trading is and how it differs from other strategies. Learn to decode institutional...
Master TrendSpider strategies for all market types with this in-depth guide. Learn how to harness au...
Master the art of risk control in momentum trading. Discover step-by-step strategies to safeguard yo...

Discover how to recognize the evening star candlestick pattern—a powerful signal highlighting potent...