


Trading Strategies
What Is ICT In Trading Compared To Other Methods?
Discover what ICT trading is and how it differs from other strategies. Learn to decode institutional...

TrendSpider has truly shaken up the way traders tackle technical analysis by removing the grunt work from tricky parts and offering tools built for pinpoint accuracy and smooth efficiency. Since markets shift between trending, ranging, volatile and consolidating phases, there is no one-size-fits-all strategy that works every time. Understanding these market moods and adjusting your game plan is important to trading like a pro. This guide dives into smart TrendSpider strategies for each market vibe and helps traders lean on automation and sharp analytics to boost profits and keep risk in check with more confidence.
Understanding the current market condition is key when picking your trading strategy. Markets typically fall into four camps. Trending markets have unmistakable momentum and prices steadily march in one direction. Ranging markets mosey sideways and bounce between set boundaries like a well-worn rhythm. Volatile markets are the wild cards because prices dart around with quick or sometimes dramatic swings that keep you on your toes. Then there are consolidating markets that are often the calm before the storm, quietly gathering steam before making a major move. Each phase demands a tailored approach with different ways to jump in and out of trades and a solid game plan for managing risk.
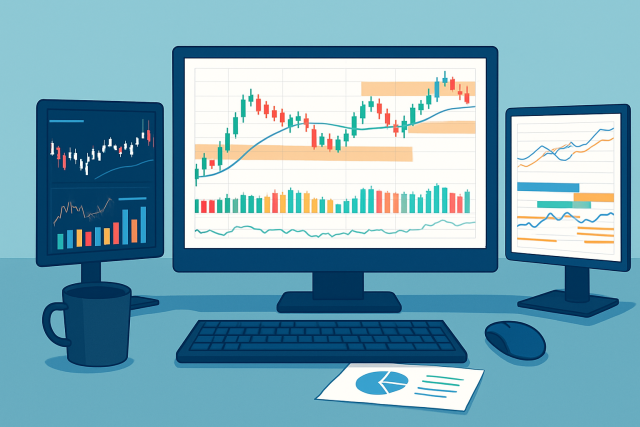
TrendSpider harnesses AI and automation to change how technical analysis is handled by offering traders handy tools that save time and boost accuracy. Features like automated trendline detection, multi-timeframe analysis, dynamic RSI indicators and comprehensive backtesting help traders craft data-driven strategies tailored to their market tastes.

Screenshot of TrendSpider’s automated trendline detection and multi-timeframe technical analysis dashboard
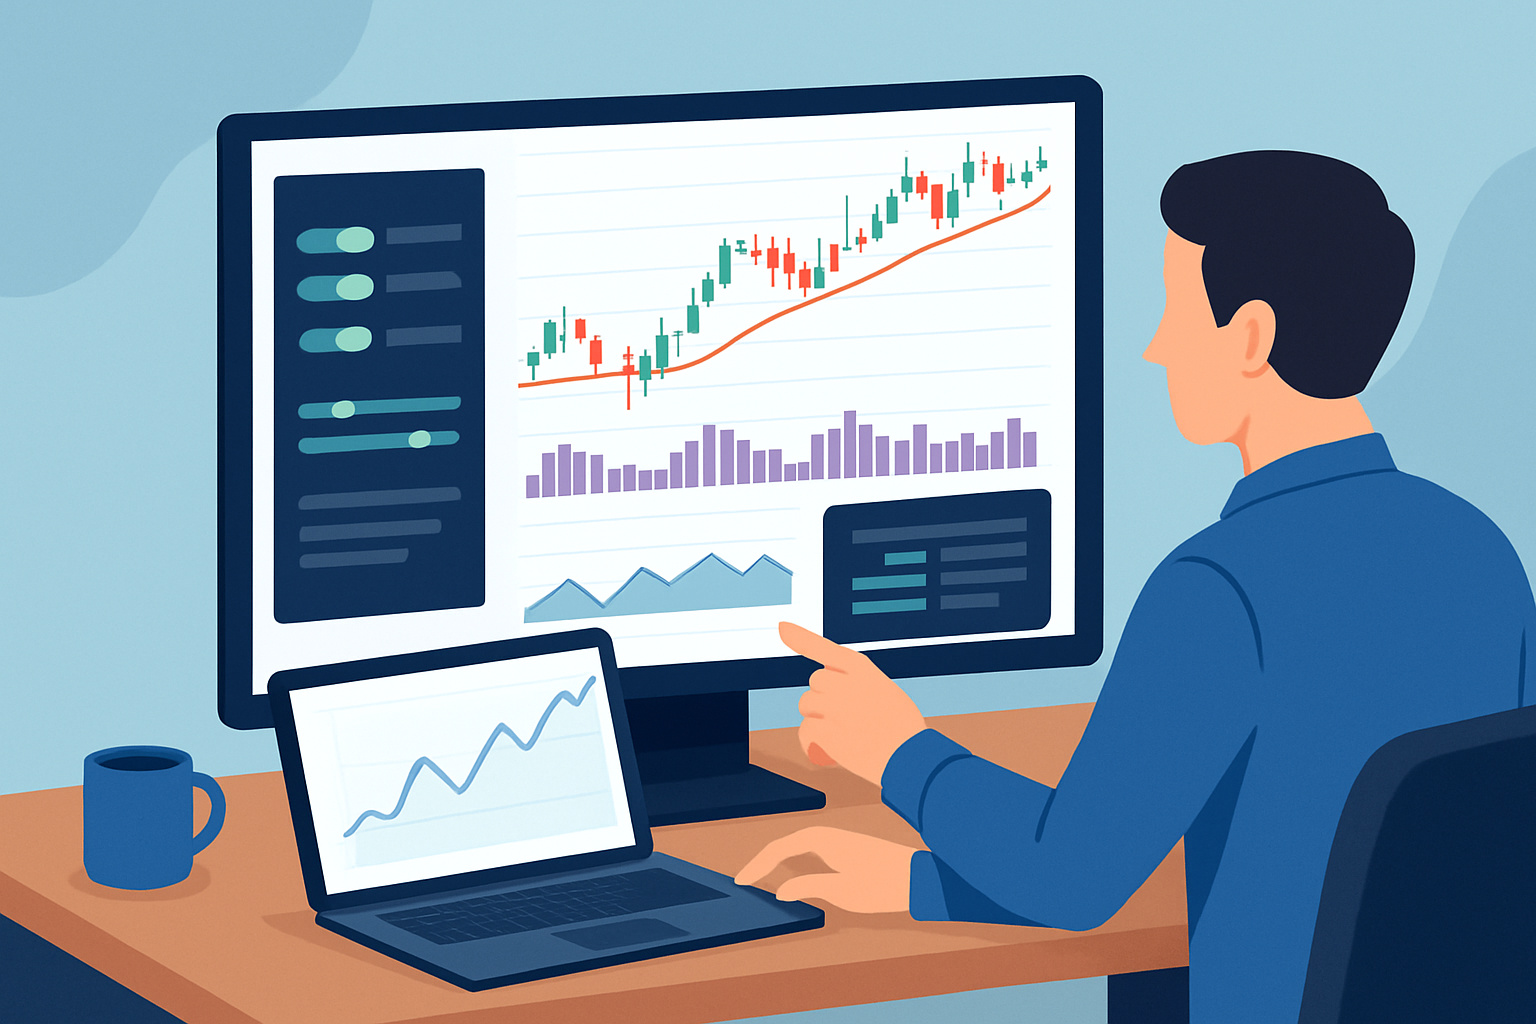
Spotting and jumping on trending markets is where TrendSpider’s automated tools really shine. With handy features like automated trendlines and RSI indicators, traders can feel a bit more confident about confirming the strength of a trend and pinpointing those sweet entry points during pullbacks. Toss in Fibonacci retracement levels and trailing stop losses.
Kick things off with TrendSpider’s automated trendline detection—it's great for spotting clear upward or downward price channels without breaking a sweat.
Get a feel for the trend’s strength by checking out the RSI and volume indicators, which are your trusty sidekicks for filtering out noise and avoiding false alarms.
Zero in on the sweet spot for entry by setting pullback entries that line up nicely with Fibonacci retracement levels, like catching the perfect wave right before the ride.
Use trailing stop losses to lock in your hard-earned gains and give your profits room to breathe and grow when the trend is really cooking.
| Strategy | Risk Level | Entry Signal Type | Exit Strategy |
|---|---|---|---|
| Trendline Breakout | Medium | Spotting a break of an automated trendline, which often signals a fresh move | Rely on trailing stop losses to lock in gains while letting profits run |
| Moving Average Crossover | Low to Medium | When the short and long moving averages cross paths, hinting at a potential shift | Set fixed profit targets to keep things tidy and avoid wishful thinking |
| Pullback Entry (Fibonacci) | Medium | Price takes a little detour back to Fibonacci levels before continuing its journey | Adjust stops dynamically to stay responsive, like a dancer on their toes |
| Volume-confirmed Trends | Medium to High | A noticeable volume spike that gives the nudge confirming the trend shift is legit | Exit triggered by volume levels to catch the wave before it retreats |
Markets stuck moving sideways often call for a different game plan—one that focuses on trading between trusty support and resistance levels. TrendSpider’s clever automation for spotting these zones teamed with oscillator indicators like RSI and Stochastics gives traders a leg up in finding smarter entry points and dodging pesky false breakouts.
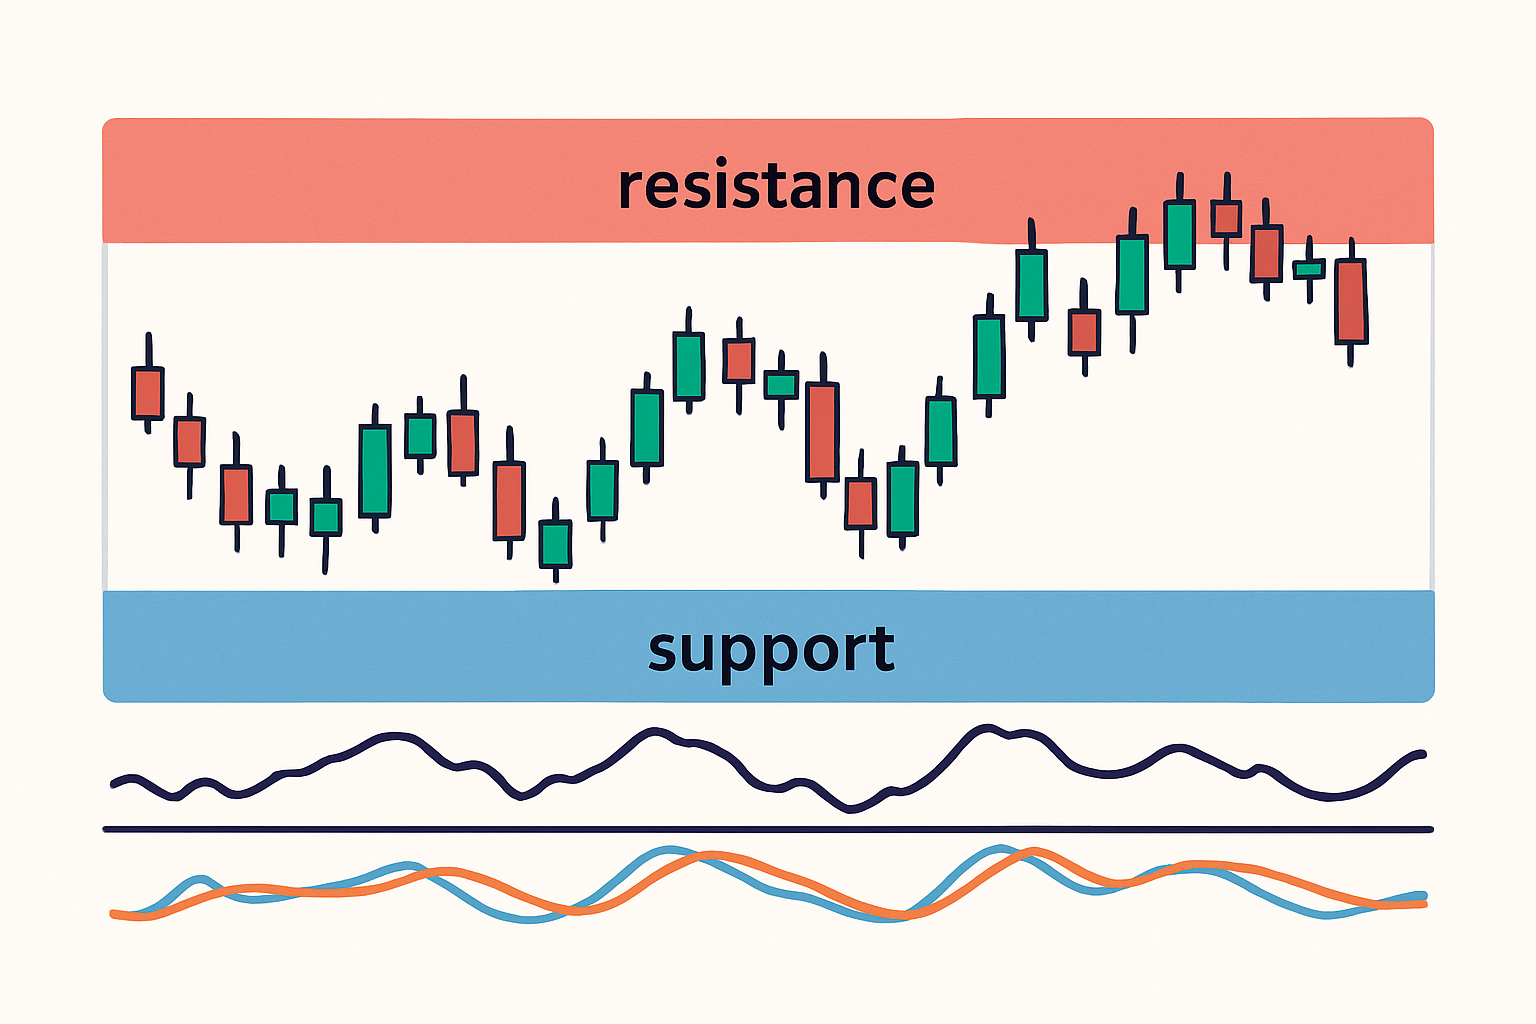
Example of support and resistance zones identified with TrendSpider alongside RSI and Stochastic indicators for ranging market trading
When the market gets wild and unpredictable, TrendSpider does not just throw up its hands. Instead, it rolls up its sleeves with a set of smart tools designed to help traders navigate those choppy waters. In my experience, keeping your cool during volatility is half the battle, and TrendSpider offers some nifty features to keep you steady and focused, no matter how crazy things get.
Markets with high volatility really test a trader's discipline and reaction time. TrendSpider’s volatility filters like the trusty Average True Range (ATR) help gauge how wild and choppy the market can get. Their AI-driven breakout alerts catch those key entry points right when it counts most. Managing trades boils down to locking in profits swiftly, keeping stop losses snug and avoiding the temptation to overtrade by filtering signals based on volume and volatility.
Use volatility indicators like ATR to get a real sense of how the market’s shifting and to figure out what kind of risk actually feels manageable.
Set breakout alerts with TrendSpider’s AI-powered signals to snag those fast price moves when they happen around key levels—because timing really is everything here.
Combine tight stop losses with quick profit-taking to lock in gains before they slip away and keep those losses from sneaking up on you.
Limit excessive trading by using volume filters that help you cut through the noise and focus only on the market’s real signals—less busywork, more smart moves.
Consolidation phases tend to show limited price movement, but they often act as the important calm before the storm of a major breakout. TrendSpider’s clever pattern recognition and trendline contraction tools make it easier to catch these quieter, sneaky moments. Traders usually keep a keen eye on those range squeezes, leaning on trusty Bollinger Bands and RSI to hint at possible entry points before momentum really kicks in.
Tailoring TrendSpider strategies to fit your personal market style and risk tolerance is straightforward thanks to its flexible customization options. You can easily tweak indicators and parameters to craft strategies that shine whether the market is trending or stuck in a range. Running backtests on historical data gives you a good sense of how your strategy holds up and highlights spots where fine-tuning could make all the difference before you take it live.
Pick a base strategy template from the TrendSpider library. It’s like choosing your game plan before hitting the field.
Tweak the main indicators and their settings to better match what the market’s throwing at you right now because one size rarely fits all.
Run backtests with relevant historical data to see if your strategy holds water while keeping an eye on profitability and any pesky drawdowns.
Take a good, close look at those backtest results. This is your chance to fine-tune settings and find smoother entry and exit points.
Finally, set up alerts and automate your strategy triggers so they can jump into action during live trading without you having to babysit them.
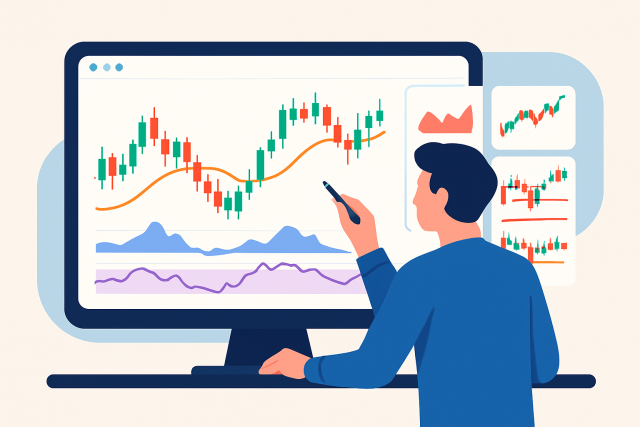
Demonstration of customizing and backtesting trading strategies using TrendSpider's interface
Get the most out of TrendSpider by staying disciplined and making it a habit to regularly check how your strategies are performing. Avoid the pitfall of overfitting to past data.
"Discipline and ongoing evaluation are absolutely key when it comes to automated trading. Sure, tools like TrendSpider can give traders a nice leg up, but at the end of the day, real success boils down to steadily learning the ropes and making thoughtful decisions—not rushing in headfirst." - Professional trader insight
Using tailored TrendSpider strategies effectively across various market types can genuinely boost your trading results. It’s a good idea to start by getting cozy with the automated tools and backtesting your ideas thoroughly because it pays off. Then slot your strategies into a broader and disciplined trading plan that keeps you grounded.

Struggling to improve your trading performance? Edgewonk's advanced analytics tools are designed to give you the edge you need.
With detailed trade journaling, robust strategy analysis, and psychological insights, you'll gain a comprehensive understanding of your strengths and weaknesses. Don't miss out on this game-changing opportunity.

Transforming the field of forex trading through his systematic approach to currency pair analysis, he focuses on macroeconomic indicators and central bank policy impacts.
Read PostsDiscover what ICT trading is and how it differs from other strategies. Learn to decode institutional...
Discover proven day trading strategies using TradingView charts. This guide equips you with practica...
Master the art of risk control in momentum trading. Discover step-by-step strategies to safeguard yo...

Discover how to recognize the evening star candlestick pattern—a powerful signal highlighting potent...