

Technical Analysis
What Is a Trend Line in Technical Analysis?
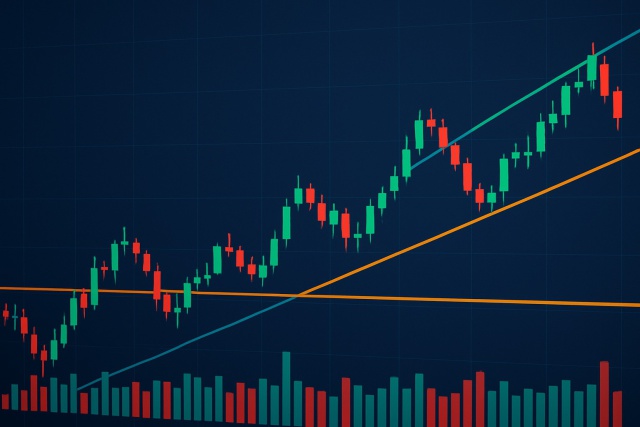
Trend lines are essential tools in technical analysis that help traders identify market direction an...
The evening star candlestick pattern is a cornerstone in technical analysis and often signals a transition from an uptrend to a downtrend. It describes a trio of candlesticks on a price chart that reveals bullish momentum running out of steam and bearish pressure starting to creep in. Getting familiar with this pattern can give traders an early heads-up about potential market shifts and help them adjust their game plan before things get costly or capitalize on the next downward move.
Candlestick patterns give you a snapshot of price movements on a chart and help traders understand what the market is feeling. Each candlestick tells a story about price action over a specific period and shows the opening, closing, high and low prices.
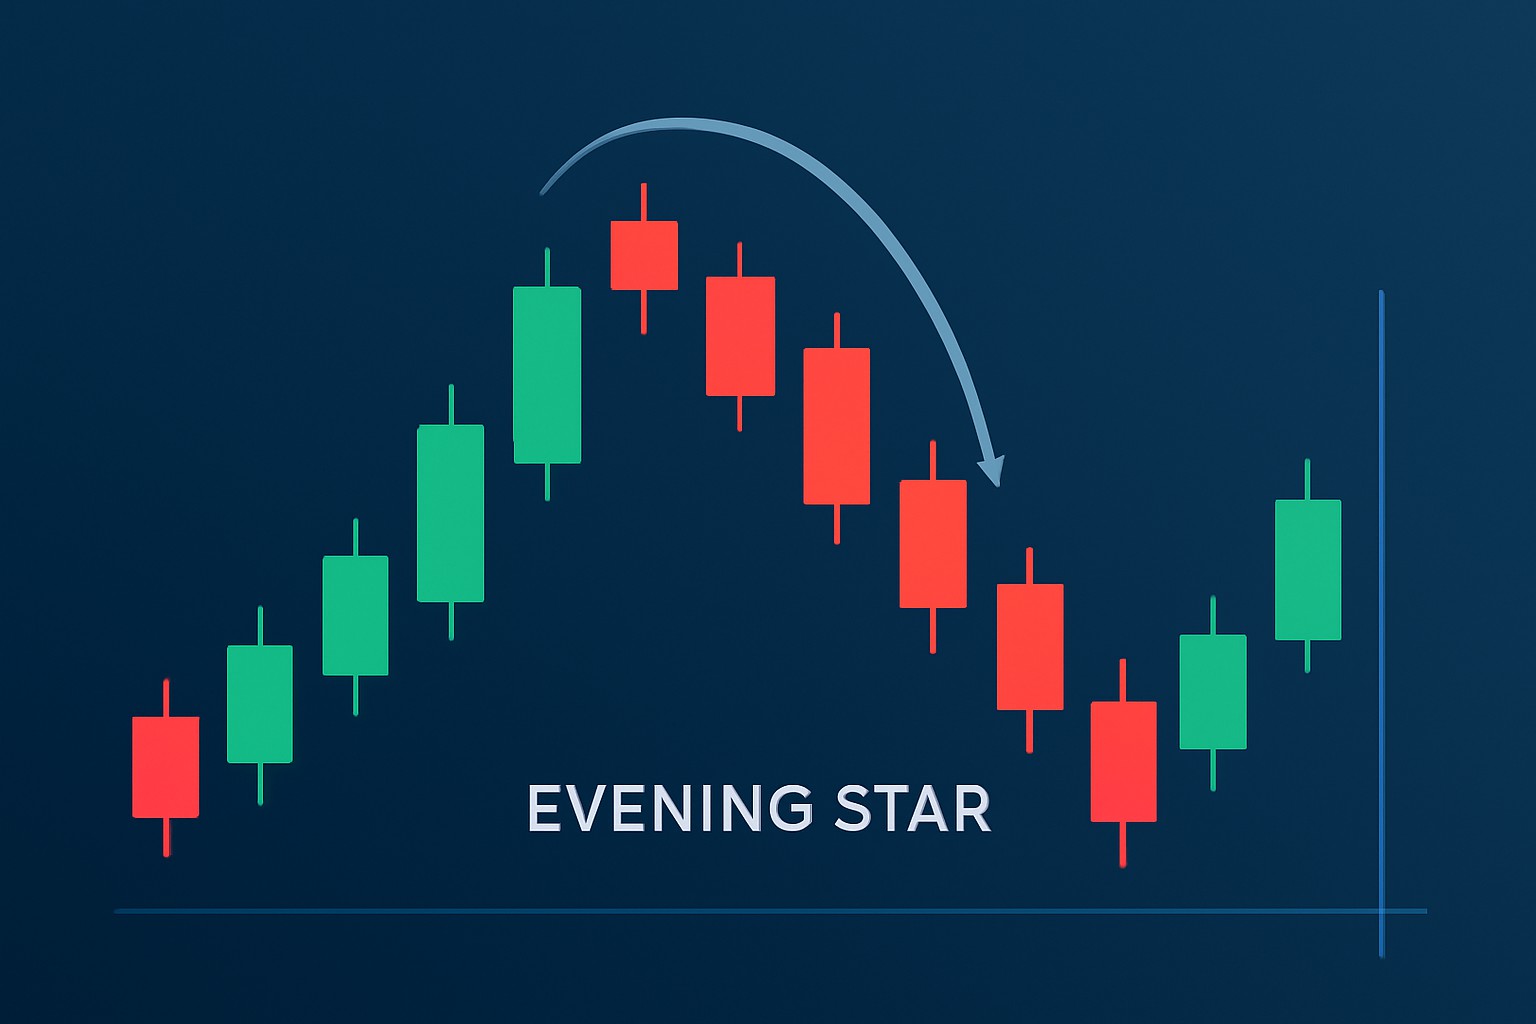
The evening star candlestick pattern is a classic bearish reversal signal made up of three candlesticks that typically show up after a solid uptrend. The market is saying "Hold on something’s about to shift" as buyers start losing steam and sellers quietly take the reins. This signals that prices could be on their way down before you know it.
The first candle is a solid bullish one that keeps the current uptrend going and closes near its high. This tells me buyers are feeling confident—almost like they’re strutting a bit.
The second candle has a smaller body often resembling a doji or spinning top. It shows a pause where both buyers and sellers seem to be cautiously holding their cards close.
The third candle turns bearish and closes well inside the first candle's body. This signals that sellers have grabbed the reins and a reversal might be getting underway.
The first candle paints a picture of buyers confidently pushing prices higher, almost like they are on a mission. The second candle however brings a bit of doubt to the party, as momentum starts to lose steam and hesitation creeps in.
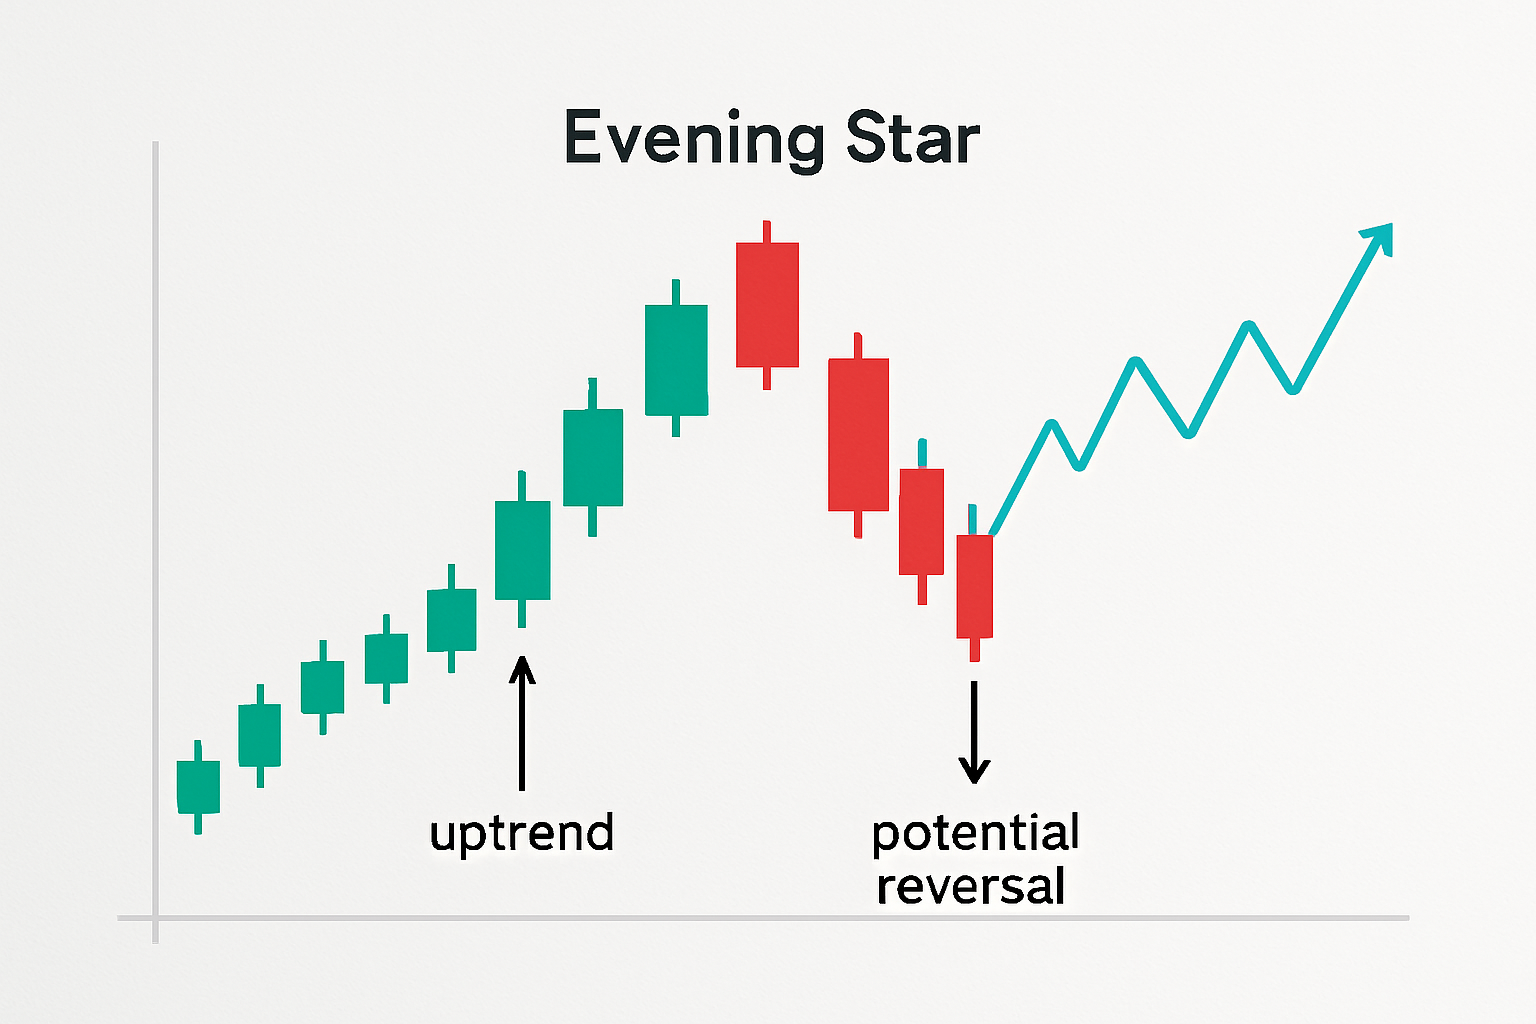
A chart illustrating the evening star candlestick pattern with labeled candles indicating the bullish candle, the indecision candle, and the bearish reversal candle.
Reliably spot the evening star pattern by starting with confirming there’s a solid uptrend already underway. Keep your eyes peeled for the unmistakable three-candle setup, and don’t forget to double-check that trading volume is playing along.
Not every three-candle formation can proudly wear the evening star badge and mixing up similar patterns often leads to shaky trading decisions. It is a widespread misconception to believe the evening star is a surefire ticket to a trend reversal. Like most indicators it hints at a possible change without handing you any guarantees.
Think of the evening star pattern more like a heads-up than a crystal ball—it hints at a potential shift, but honestly, you’ll want to see some backup before jumping in.
Including the evening star pattern in your trading plan can really give your decision-making a boost, especially when you mix it with other tried-and-true technical indicators and solid risk management strategies. Many traders like to see confirmation of momentum shifts through oscillators like RSI or MACD before diving into short positions. It’s a little like waiting for the green light before stepping on the gas.
The evening star can be a handy little signal for reversals but leaning on it too heavily might land you in hot water. It has a habit of throwing false alarms especially when the market is jittery or moving sideways like a restless dancer. Plus when trading volume is light its reliability tends to take a bit of a nosedive.
| Pattern | Structure | Signal Type | Reliability | Ideal Market Conditions |
|---|---|---|---|---|
| Evening Star | Three candles: starts with a bullish candle, then a small-bodied one, followed by a bearish candle | Bearish reversal | Moderate to High | Pops up after a strong uptrend, usually confirming that the bulls are handing over the reins |
| Bearish Engulfing | Two candles: a tiny bullish candle quickly swallowed by a large bearish one that completely covers it | Bearish reversal | High | Shows up near the peak of an uptrend, often a pretty solid heads-up that things might be turning sour |
| Shooting Star | A single candle featuring a small body and a long upper wick that looks like it’s reaching for the sky but getting pushed down | Bearish reversal | Moderate | Appears during an uptrend, gently waving a red flag about rejection of higher prices |
| Dark Cloud Cover | Two candles: first a bullish candle, then a bearish one that closes below the midpoint of the bullish candle, casting a shadow of doubt | Bearish reversal | Moderate | Emerges after an uptrend, often suggesting that sellers are quietly starting to assert themselves |
The evening star candlestick pattern usually offers a pretty clear confirmation since it shows up as a three-candle formation, which tends to make it a more convincing signal—especially when you back it up with other indicators.

Tired of missing opportunities and making suboptimal trading decisions? TrendSpider's cutting-edge platform automates complex technical analysis, saving you time and reducing human error.
With multi-timeframe analysis, dynamic alerts, backtesting, and customizable charting, you'll gain a competitive edge in identifying trends and making informed trades across global markets.

Transforming the field of technical analysis through innovative charting techniques, Scarlett specializes in pattern recognition and momentum trading strategies for equity markets.
Read PostsTrend lines are essential tools in technical analysis that help traders identify market direction an...

Learn how the True Range indicator captures market volatility and price swings, empowering traders t...

Discover the wedge falling pattern's secrets and learn step-by-step how to trade this powerful techn...
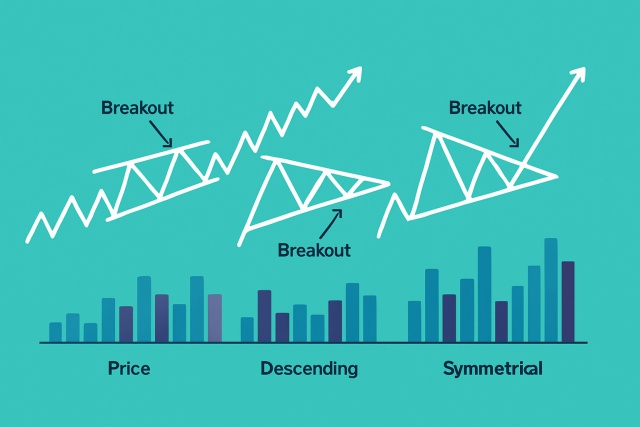
Discover how pattern triangles help traders predict price movements. This guide breaks down triangle...