


Technical Analysis
Using The True Range Indicator To Spot Price Swings
Learn how the True Range indicator captures market volatility and price swings, empowering traders t...
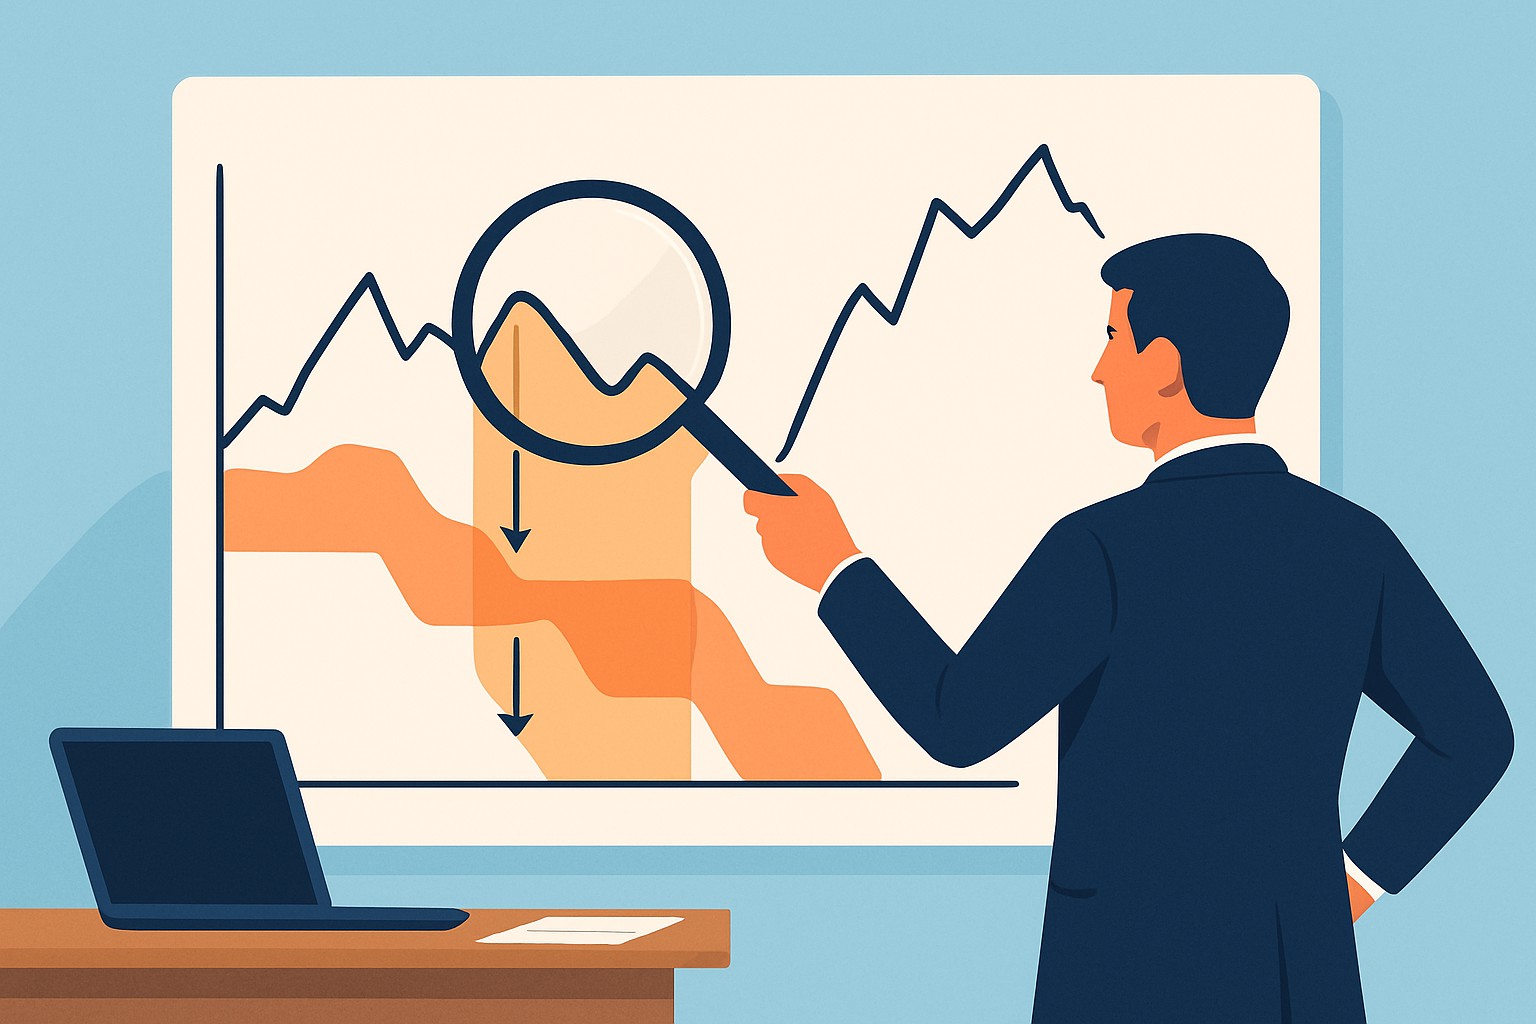
Understanding what is drawdown in trading is crucial for every trader who wants to manage risk effectively. Simply put, it measures the drop in an account's value from its highest point down to a later low. Drawdown isn’t just a dry number; it helps traders protect their hard-earned capital and set realistic expectations to avoid unpleasant surprises later.
A drawdown is basically the dip in your investment or trading account's value from its highest peak down to its lowest trough before it starts climbing back up or hits a fresh high. It’s a handy way to see just how much of your hard-earned capital has taken a hit over a stretch of time.
Understanding drawdown is absolutely vital because it sets the boundaries of risk a trader is willing to take on and dictates how long it might take to claw back from losses. It helps traders put realistic stop-loss levels and position sizes in place and acts like a safety net when the markets throw a curveball. Drawdowns don’t just hit the wallet—they chip away at a trader’s mindset as prolonged losing stretches can stir up fear or frustration and lead to snap decisions that aren’t so great in hindsight. Keeping an eye on drawdowns often nudges traders to tweak their game plan by fine-tuning or ditching strategies that feel too reckless.
"Handling drawdown well often turns out to be the key difference between traders who stick with it and those who throw in the towel eventually. It’s not just about safeguarding your capital; it’s about holding onto your confidence and discipline when the market really puts you through the wringer."
Traders encounter all sorts of drawdowns. Each brings its own lesson. Absolute drawdown reveals the raw loss from the first dollar invested. Maximum drawdown tracks the steepest plunge from a high point to a low during the trading journey. Relative drawdown puts that dip into perspective by expressing it as a percentage.
| Type | Definition | Calculation Method | Example Scenario | Importance |
|---|---|---|---|---|
| Absolute Drawdown | The drop in value from your initial capital down to the lowest point it hits along the way | Initial Capital - Lowest Value | Starting with $10,000, the investment dips to $8,000 — a bit of a stumble early on | Shows how much money you have lost compared to what you started with; an important reality check |
| Maximum Drawdown | The biggest drop from a peak value down to the lowest trough during the trading period | Peak Value - Lowest Trough Value | Your account climbs to $15,000, then takes a nosedive to $9,000 | Sheds light on the worst loss historically, helping you gauge the riskiness of your strategy — not for the faint of heart |
| Relative Drawdown | The percentage decrease from a high point down to the lowest dip | (Peak - Trough) / Peak × 100% | Account falls from $12,000 to $9,000, representing a 25% drawdown | Makes it easier to compare risk across accounts of different sizes — a level playing field metric |
Let's dive into calculating drawdown. It is one of those essential metrics that really tells the story of how much your investment has taken a hit from a peak to a trough. Think of it as the financial version of a rollercoaster dip — it can rattle you a bit but is key to understanding the whole ride. Whether you are a seasoned investor or just dipping your toes into the market, keeping tabs on drawdown helps you get a grip on risk and potential recovery hurdles ahead.
Calculating drawdown is straightforward once you get the hang of it. Traders start by spotting the highest account value they have reached called the peak. Then they find the lowest value—the trough—that comes before the account climbs to a new peak. They take the difference between the peak and trough, divide it by the peak, and convert it into a percentage. This figure, the drawdown, gives a clear snapshot of how much their capital has fallen compared to the account's all-time high.
Identify the highest point your account balance has ever hit.
Spot the lowest dip the balance falls to, known as the trough.
Take the trough away from the peak to figure out the absolute loss.
Divide that loss by the peak value to get the relative drawdown.
Multiply by 100 to turn it into a percentage, which just makes the whole thing a lot easier to wrap your head around.
When you stack drawdown up against other risk metrics, it really shines in its simplicity and gut-level honesty. Unlike some fancy formulas that might make your head spin, drawdown gives you a straightforward snapshot of just how deep the financial waters have gotten. It is like keeping an eye on the tide to avoid getting caught out too far from shore. Of course, it doesn’t capture every nuance, but in my experience, it’s a trusty companion when you just want to see the worst-case dip in your investment journey.
Drawdown really stands out from other risk measures like losses, volatility, Value at Risk (VaR) and the Sharpe ratio. Losses are straightforward because they simply log negative returns over a trade or timeframe. Drawdown goes a step further by capturing the slide from a peak to the lowest point and shows the worst hit you’ve taken. Volatility tells you how wild price swings can get but doesn’t reveal how much capital you might have lost. VaR tries to estimate the maximum loss you might expect over a period yet drawdown gives a more tangible, historical snapshot of actual declines. The Sharpe ratio shows risk-adjusted returns but misses how painful or prolonged those drawdowns can be.
Drawdowns can really hammer a trader's mindset and hit harder than most expect. Capital taking a serious dip often stirs up fear and anxiety that is tough to shake off. This emotional pressure can push traders to ditch solid strategies too early or throw caution to the wind with reckless risk-taking in a desperate attempt to recover quickly—usually just pouring fuel on the fire. Those long drawn-out drawdowns put patience and discipline through the wringer. That is why mental toughness is as important as technical prowess. Being mindful of these psychological bumps helps traders keep their cool and stay emotionally steady when the going gets tough.
Drawdowns can really test even the most seasoned traders. I like to think of them as a bit like turbulence when you are flying—annoying and nerve-wracking, sure, but ultimately just part of the journey. The people who manage to keep their cool and stay steady through it usually end up reaching their goals, even if the ride gets a little bumpy along the way.
Keeping drawdown under control is important for staying in the game over the long haul when it comes to trading. Traders often find that simple risk management tactics like setting stop-loss orders to cap losses, diversifying investments to spread risk and tweaking position sizes to avoid too much leverage really pay off. Thoughtful planning around risk-reward ratios can ensure the potential upsides justify the risks on the table.
Set stop-loss orders to automatically close trades before losses get out of hand. Think of it as your safety net catching you before you hit the hard floor.
Stick to position sizing guidelines so you’re never putting too big a slice of your capital on one trade. It’s like not putting all your eggs in one basket, no matter how tempting.
Mix things up by spreading your investments across different assets or strategies to keep the overall risk manageable.
Work out risk-reward ratios that help boost profitability and make a habit of sticking to them. Consistency here is often the name of the game.
Use trailing stops to lock in profits while still giving your trades enough breathing room to run their course.
Controlling leverage is as important as any core tactic because too much can magnify drawdowns and quickly nibble away at your capital before you know it. Keeping a detailed trading journal is a tried-and-true way for traders to look back at rough drawdown stretches with a clear head, catch slip-ups and make smarter calls later. Tools like TradingView offer slick charting and risk management features that help you watch trades in real time.

Visual representation of drawdown on trading charts with stop-loss and trailing stop annotations
These days plenty of trading platforms and software tools help you keep an eye on drawdown as it unfolds. Take TradingView for example—it offers detailed charts with built-in risk indicators and alerts that track drawdown levels so you’re never caught off guard. Then there’s TrendSpider which steps up the game with automated pattern recognition and technical analysis to help you sniff out risk trends faster than you might expect. And not to forget handy online drawdown calculators where you simply punch in peak and trough values and voilà you get an instant read on the drawdown percentage—super useful when markets move at the speed of light.
When understanding what is drawdown in trading, deciding when it gets too big really boils down to your trading style and the timeframe you're working with as well as how much risk you're willing to stomach. Usually if you're staring down a drawdown over 20-25% that's a red flag signaling higher risk that might seriously shake up your account. Some strategies can ride out smaller drawdowns without breaking a sweat. Others—especially quick scalping moves—need tighter reins.

Struggling to improve your trading performance? Edgewonk's advanced analytics tools are designed to give you the edge you need.
With detailed trade journaling, robust strategy analysis, and psychological insights, you'll gain a comprehensive understanding of your strengths and weaknesses. Don't miss out on this game-changing opportunity.

Transforming the field of commodities trading through sustainable investing principles, she bridges traditional finance with ESG considerations.
Read PostsLearn how the True Range indicator captures market volatility and price swings, empowering traders t...

Discover how to recognize the evening star candlestick pattern—a powerful signal highlighting potent...
Unlock the full potential of TrendSpider with this authoritative guide to TrendSpider University tra...
Discover the essentials of options trading for dummies. This beginner-friendly guide explains key te...