


Charting Software
TradingView Alternatives for Traders
Discover the best TradingView alternatives for traders seeking advanced automation, lower costs, or...
This article explores how TrendSpider’s cutting-edge toolkit boosts your trading game by combining AI-powered automation with next-level charting strategies—making complex analysis more manageable.
TrendSpider charts have truly shaken up technical analysis by blending automation with a dash of AI magic. They have handed traders some seriously powerful tools to cut through the market noise, making insights sharper and decision-making a whole lot smoother
Technical charting remains a go-to method for digging into financial markets and offers clear visual clues through price and volume data to help spot future trends. What sets TrendSpider apart is its clever automation and AI-powered features that take traditional charts a step further. Unlike usual platforms, it offers automated trendline detection, smart scanning, dynamic alerts, and backtesting tools all packed into a surprisingly intuitive interface. These features help trim down manual errors, save time, and provide actionable insights.
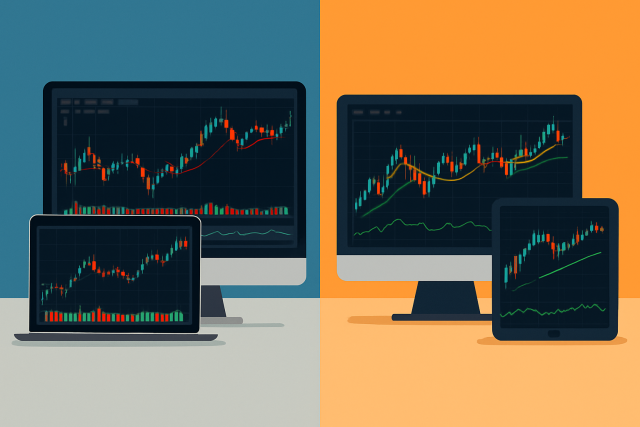
TrendSpider charts come packed with an impressive variety of chart types and a smorgasbord of customization options, letting traders tweak the interface and visuals until everything feels just right.
TrendSpider really steps up its game with advanced tools that feel either unique or custom-made just for its platform. Features like AI-powered automated trendline detection take the headache out of spotting key support and resistance levels, making it feel almost effortless. Dynamic price alerts keep things fresh by updating in real time, so you’re never caught off guard by sudden market moves. The multi-factor RSI and other composite indicators dive deeper, offering more nuanced insights into momentum than your average tool.
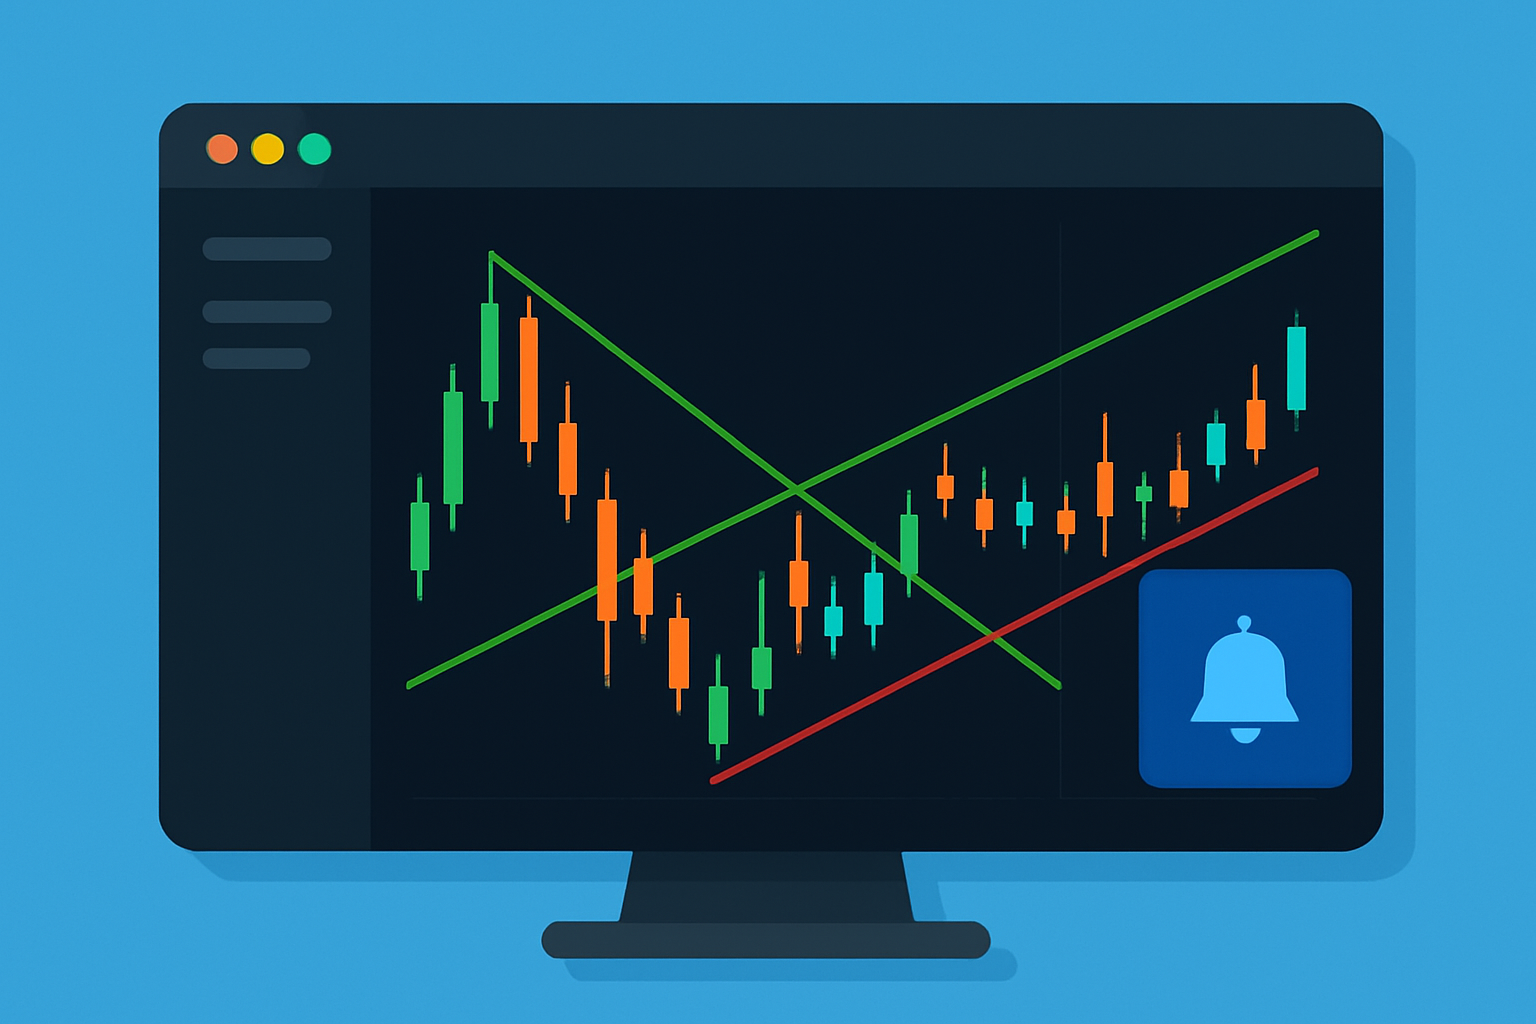
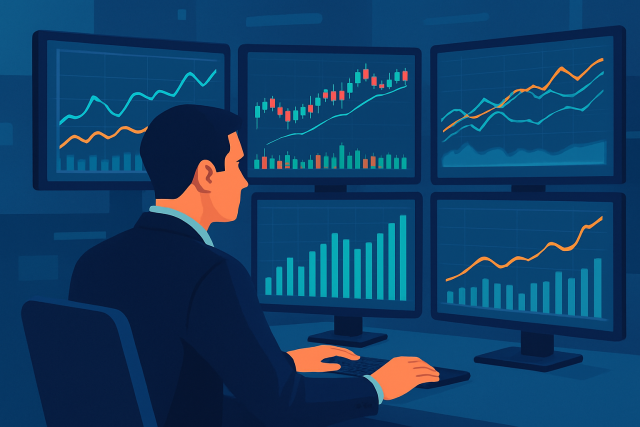
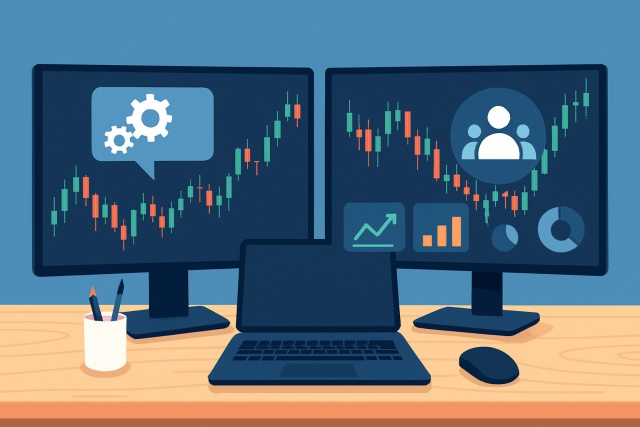
Screenshot showcasing TrendSpider's advanced charting tools including AI-powered trendline detection, Raindrop charts, and real-time dynamic alerts.
Traders find it a lot easier to spot sneaky breakout points and catch trend reversals before they slip away. Take AI-driven trendline detection for instance—it often shines a light on strong support levels when the market is really volatile. Meanwhile, dynamic alerts jump into action right away and keep traders in the loop so they can make swift moves or tweak risk management on the fly. Pair that with solid backtesting and traders get to run these setups through the wringer against historical data.
TrendSpider lets users whip up custom indicators tailored to their own unique strategies, making analysis feel a lot more precise and personal. Its automated alert system is like having a trusty sidekick, keeping traders in the loop on key market moves by pinging them through multiple channels
Kick things off by either picking from TrendSpider's existing indicators or rolling your own formulas using their scripting tools tailored to your analysis style.
Dial in your alert parameters based on indicator readings, price points or those classic patterns you know well. This ensures you get spot-on notifications when it counts.
Blend alerts across multiple timeframes because matching signals from the long haul and quick snapshots helps piece together a smarter strategy.
Set up automation for notifications via email, SMS or push alerts so you’re always in the loop and ready to act no matter where life takes you.

What You Get
Harnesses cutting-edge algorithms to effortlessly spot key trends, pinpoint support and resistance levels, and highlight the best entry and exit points on trading charts. It’s like having a seasoned analyst watching the markets around the clock.
Saves you precious time and sharpens accuracy when hunting for trading opportunities, slashing the need for tedious manual analysis.
Gives users the freedom to build, tweak, and apply their own technical indicators, crafting charting and strategies that fit their unique trading groove perfectly.
Empowers traders to fine-tune their analytical toolkit exactly how they like it, boosting overall effectiveness and confidence.
Features a robust set of tools like multi-timeframe analysis, Fibonacci retracements, dynamic price alerts, and more — all designed to help you dig deep and see the market’s story more clearly.
Arms traders with the clarity and detail needed to make smarter, better-informed decisions in the heat of the moment.
Leverages artificial intelligence to accurately detect a broad range of chart patterns, enabling users to catch potential trends and reversal signals before they become obvious.
Enhances your ability to anticipate price moves and manage risk by spotting actionable patterns in real time — no crystal ball required.
Offers Basic, Pro, and Premium plans tailored to fit the needs of beginners, active traders, and seasoned professionals alike, each unlocking different features and support levels.
Provides scalable access so you can pick the plan that perfectly matches your experience level and trading ambitions — no more, no less.
Lets users set up alerts triggered by real-time price moves or shifts in technical indicators, guaranteeing you won’t miss those all-important market moments.
Keeps you in the loop and ready to act fast, freeing you from the grind of nonstop chart watching.
Supports simultaneous analysis across various timeframes, all on the same chart, painting a complete picture of market conditions from short bursts to long stretches.
Enables you to make more nuanced choices by seeing how the market’s story unfolds over different time horizons.
Higher-tier plans include tailored customer support and exclusive resources designed to help you squeeze the most value from every feature on the platform.
Offers expert guidance to ensure you’re not just using the platform, but truly benefiting from it — turning knowledge into better trading outcomes.
Compared to traditional charting platforms, TrendSpider smartly combines automation and AI to cut down on tedious manual work and pesky human bias. Most regular software still expects you to painstakingly draw trendlines by hand and set up rigid alerts. This often means missing key signals. TrendSpider cranks up your efficiency with automated workflows, customizable multi-factor alerts and thorough backtesting. It all comes wrapped in a surprisingly easy-to-navigate interface.
When you stack up TrendSpider, Binance and TradingView, each platform brings its own clear strengths and tradeoffs to the table. Binance’s charting tools feel made for the hands-on crypto trader and fit snugly within its vast exchange ecosystem that offers a variety of trading options and rock-solid liquidity. TradingView shines thanks to its easy-to-use interface and lively social features. It has impressive market coverage and a loyal, community-driven following. Meanwhile, TrendSpider zeroes in on automation and AI-powered analytics. It serves up sophisticated tools for trend detection, backtesting and dynamic alerts.
Here’s a handy rundown of key features, pricing, and user-friendliness across the top charting and trading platforms—just what you need to get a clearer picture before diving in.
| Key Differences |  |  | |
|---|---|---|---|
| Pricing | Spot trading fees sit at 0.1%, with futures a bit lower at 0.02%—not too shabby. | Subscription plans start at $14.95 and go up to $59.95 per month—there’s a tier for most budgets. | Plans kick off at $39.99 and stretch up to $99.99 per month, so it’s an investment. |
| Key Features | Covers spot and futures trading, packed with advanced tools and solid security to boot. | Top-notch charting, loads of technical indicators, plus a lively social network to boot. | Features automated technical analysis, customizable indicators, and AI-driven pattern recognition that’s kind of like having a trading assistant. |
| Ease of Use | Generally user-friendly, though the fee structure can be a bit of a puzzle; beginners might need a helping hand. | Mild learning curve, but once you’re over it, it runs smoothly on pretty much any device. | There’s definitely a steeper learning curve here; best suited for those who live and breathe active trading. |
| Target Audience | Geared towards traders of all stripes who keep their eyes on cryptocurrency. | Perfect for traders and investors who crave deep analysis and love to bounce ideas around. | Tailored for active traders and pros who want automation and advanced toolkit options. |
| Charting & Analysis Tools | Offers charting indicators, trading signals, and robust API integrations to tinker with. | Brings a variety of chart types, tons of indicators, and plenty of drawing tools to your fingertips. | Offers multi-timeframe analysis, Fibonacci tools, dynamic alerts, and those clever AI patterns. |
| Community & Collaboration | Limited social bells and whistles; mostly a one-on-one trading focus here. | Features a solid social platform designed for sharing charts, strategies, and the occasional clever insight. | Social features take a back seat; the focus is very much on personal analysis. |
| Integration & Trading Options | Covers a broad spectrum of trading services across spot and futures markets. | Plays nicely with major brokerages, letting you execute trades directly. | Mostly an analytics beast; it doesn’t offer direct trading integration. |
| Pros and Cons | Great strengths include a wide range of services and high liquidity; on the flip side, customer support feels thin and fees can get complicated. | Packed with rich tools and a vibrant community; downsides include premium features that cost a pretty penny and the odd lag. | Strong points are automation and deep customization; but watch out for the higher price and its heavy reliance on technical analysis. |
| Visit Binance Site | Visit TradingView Site | Visit TrendSpider Site |
For traders who dive deep into advanced technical analysis but want to cut down on the grunt work, TrendSpider brings automation features that you just don’t see with Binance or TradingView. Binance does its part smoothly when it comes to executing trades, while TradingView shines thanks to its vibrant community and the sheer variety of charts it offers.
Traders looking to up their crypto game on Binance and Coinbase can benefit from TrendSpider’s advanced charting tools. These tools let you dig into market data from different angles, craft smart strategies, and time your trades with more finesse. The seamless integration with synchronized watchlists and alerts makes monitoring both platforms almost effortless.
To really make the most of TrendSpider’s advanced features, users often find it pays off to craft custom dashboards tailored to their unique trading style using TrendSpider charts. Regularly leaning on AI-driven trendline detection can help catch sneaky opportunities that might otherwise slip through the cracks. Running backtests against historical data builds confidence before jumping into live trades. Checking multiple timeframes gives you a fuller view of the market and staying on top of alerts makes it easier to adapt to shifting conditions and keep risk in check.
Personalize your dashboard by adding the charts and indicators you lean on most, making your analysis not just quicker but a bit more intuitive too.
AI-driven trendline detection takes the wheel daily, effortlessly highlighting key market levels so you can skip the tedious drawing part.
Give your trading strategies a thorough test drive with historical data before putting any real money on the line—better safe than sorry, as they say.
Dive into multi-timeframe analysis to catch a clearer glimpse of the bigger trends while keeping an eye on the short-term moves, helping you nail your timing on entries and exits.
Keep your alert settings fresh and tuned to the latest market rhythms, so they buzz exactly when you need a heads-up.
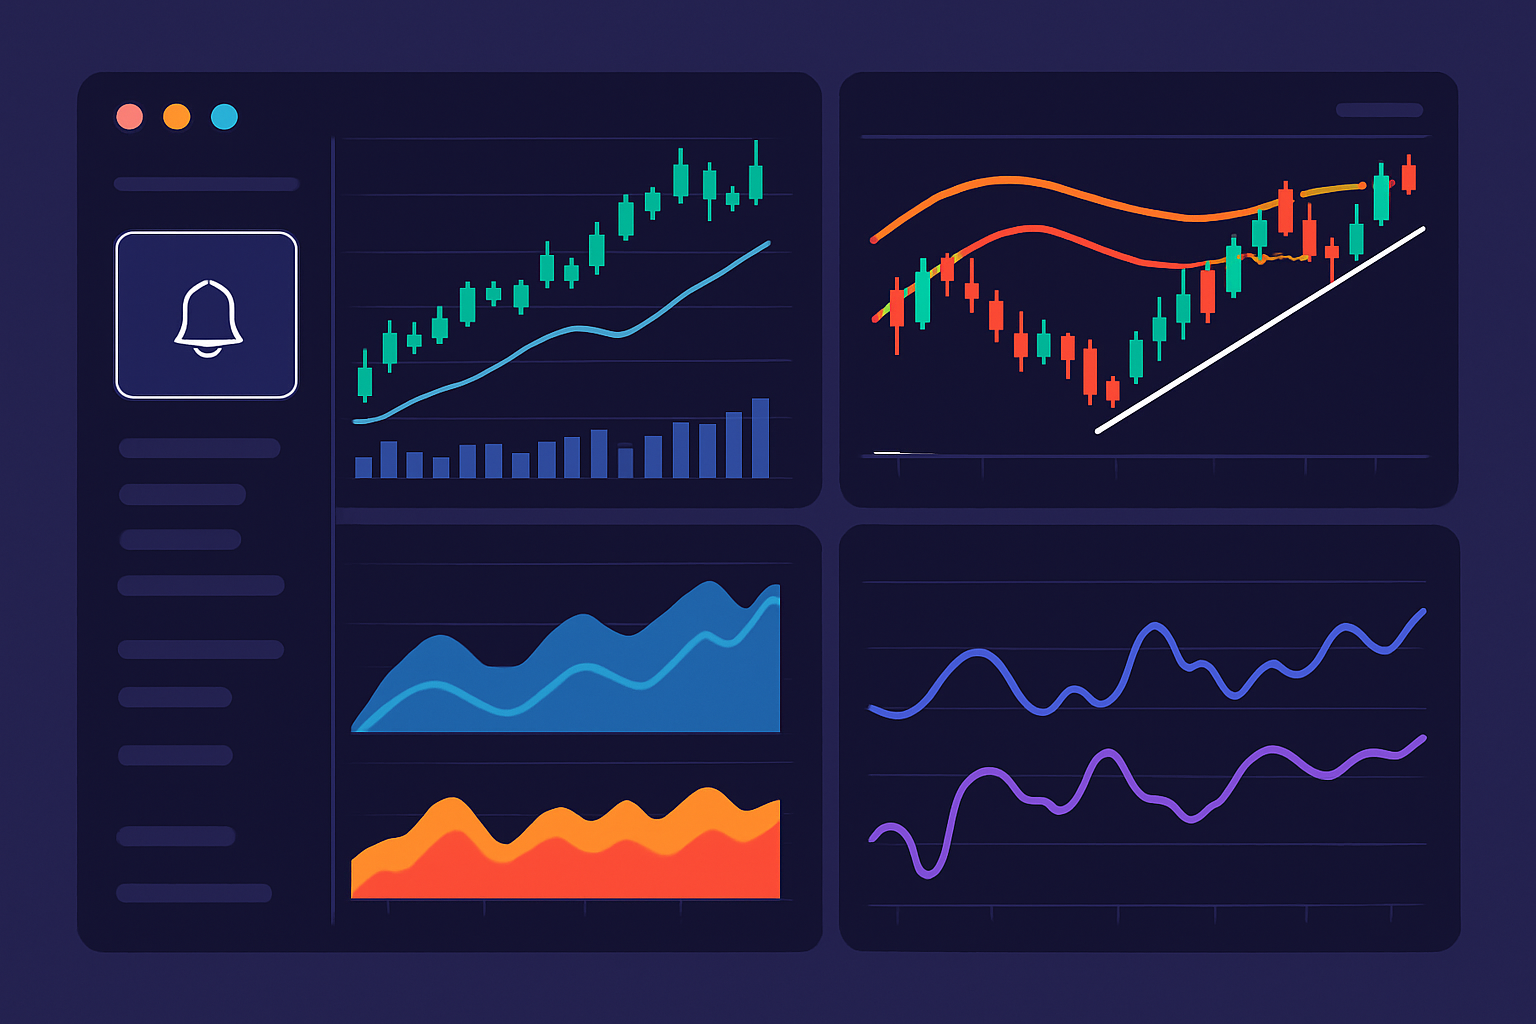
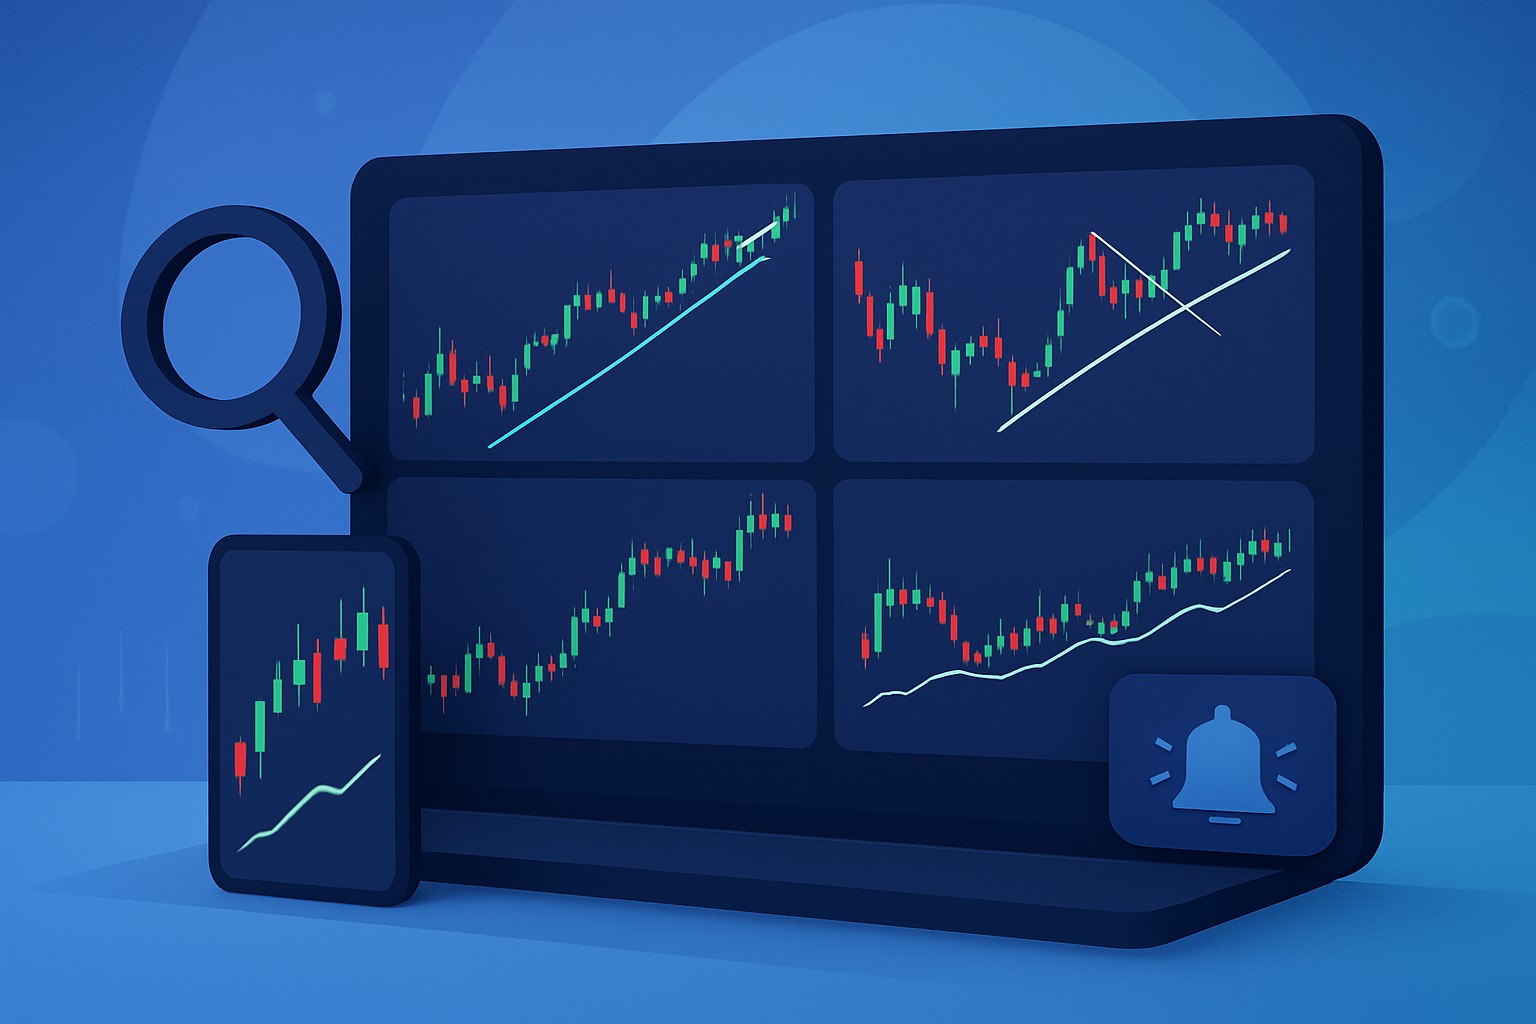
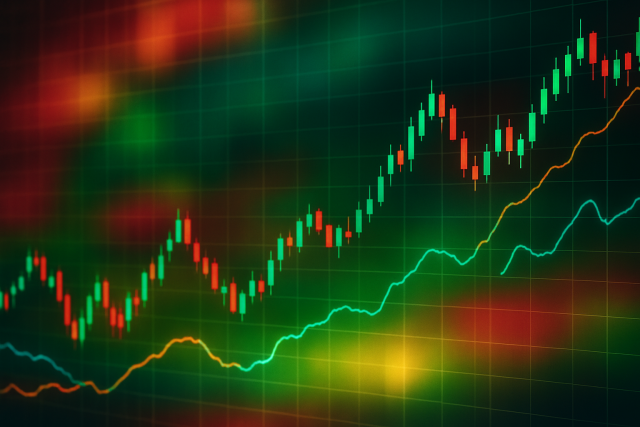
A well-organized TrendSpider dashboard displaying multiple chart layouts, customized indicators, live alerts, and automated trendline detections enhancing trading efficiency.
"Bringing AI and automation into charting platforms like TrendSpider really shakes up the trading game in some pretty meaningful ways. It’s a big help for cutting down on those all-too-human slip-ups and speeds up decision-making so you’re not stuck second-guessing yourself. The end result? Trading that’s sharper, smarter, and genuinely driven by solid data." – Dr. Elena Martinez, Quantitative Analyst

Struggling to improve your trading performance? Edgewonk's advanced analytics tools are designed to give you the edge you need.
With detailed trade journaling, robust strategy analysis, and psychological insights, you'll gain a comprehensive understanding of your strengths and weaknesses. Don't miss out on this game-changing opportunity.

Transforming the field of commodities trading through sustainable investing principles, she bridges traditional finance with ESG considerations.
Read PostsDiscover the best TradingView alternatives for traders seeking advanced automation, lower costs, or...
Debating between TrendSpider and ThinkorSwim? This in-depth comparison analyzes charting tools, auto...
Explore a detailed comparison of TradingView and TrendSpider, two leading charting platforms, to det...
Discover how the TradingView Heat Map transforms complex market data into clear visual cues, enablin...