


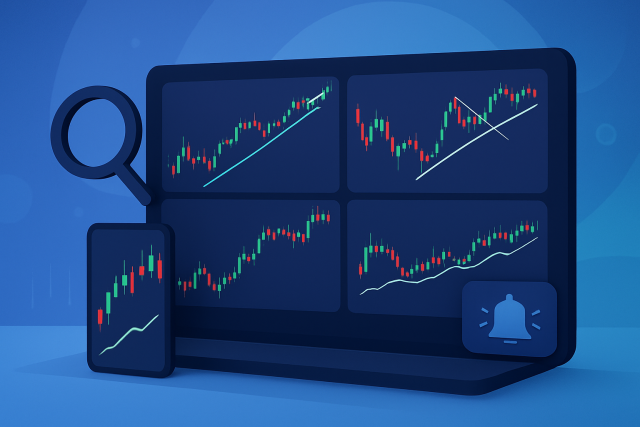
Charting Software
TrendSpider vs Trade Ideas - How These Trading Tools Differ in Use?
Dive into our comprehensive analysis of TrendSpider vs Trade Ideas, two powerful trading platforms,...
This article takes a closer look at two popular charting platforms, TrendSpider and StockCharts. Both offer a solid arsenal of tools for technical traders and investors alike. This analysis will help determine which one truly stands out when it comes to charting features.
This detailed comparison lays out the strengths and quirks of two top charting platforms. It dives into features, pricing, and who they’re really made for, helping you make a well-informed decision without the guesswork.
| Key Differences |  |  |
|---|---|---|
| Pricing | Pro+ $19.95/mo, Premium $39.95/mo, Elite $59.95/mo — options that fit a range of needs and budgets | Basic $39.99/mo, Pro $59.99/mo, Premium $99.99/mo—definitely on the pricier side, but packed with features |
| Charting Tools | Highly customizable with multiple indicators and the handy ability to save your favorite layouts as templates | Advanced charting with multi-timeframe views, Fibonacci tools, and dynamic alerts that keep you on top of things |
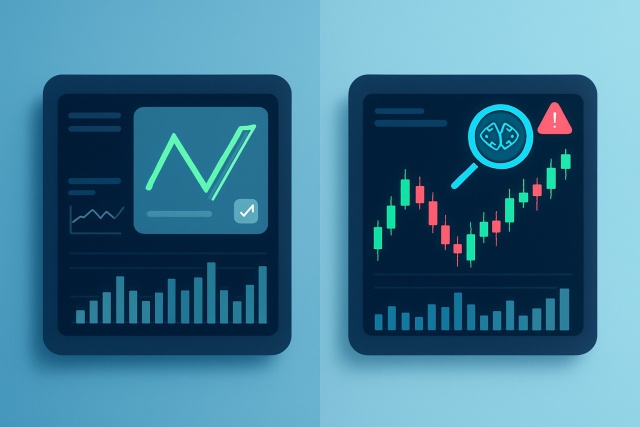
| Technical Analysis | Offers a solid range of indicators and drawing tools, geared mostly towards those who like to get hands-on and analyze manually | Automated trend analysis combined with customizable indicators and AI-driven pattern recognition—perfect if you like letting tech do the heavy lifting |
| User Interface & Ease of Use | Friendly and intuitive, making it a breeze for beginners to jump in without feeling overwhelmed | Has a steeper learning curve and is really aimed at active traders who don’t mind putting in some time upfront |
| Community & Social Features | Supports an active global user base, with plenty of ways to share ideas and connect with fellow traders | Doesn’t offer much in the way of social networking, so it’s more of a solo ride |
| Advanced Features | Limited in fundamental analysis and doesn’t include automated pattern recognition, so it’s more about you steering the ship | Includes AI-powered pattern recognition and automatic technical analysis tools that give you a leg up in spotting opportunities |
| Target Audience | Suitable for everyone from total beginners to seasoned pros looking for broad market insights—all in one place | Designed for active traders and professionals who want automated insights and aren’t shy about a bit of complexity |
| Visit TradingView Site | Visit TrendSpider Site |
It’s worth taking a moment to highlight what each platform brings to the table, especially focusing on their main strengths and users they typically attract. TrendSpider shines with its automated technical analysis and AI-powered tools. These features appeal to active traders who want more precision and efficiency in their workflow. Meanwhile, StockCharts has built its reputation on solid traditional charting and is a go-to for beginners and seasoned traders alike.
TrendSpider sports a sleek, modern interface crafted to help active traders get things done faster and with less hassle. Its dashboards and workspaces are a breeze to customize, letting users quickly save layouts and tweak chart appearances until everything feels just right. On the flip side, StockCharts offers a more old-school yet versatile interface that’s packed with a wide variety of chart types and layout options.
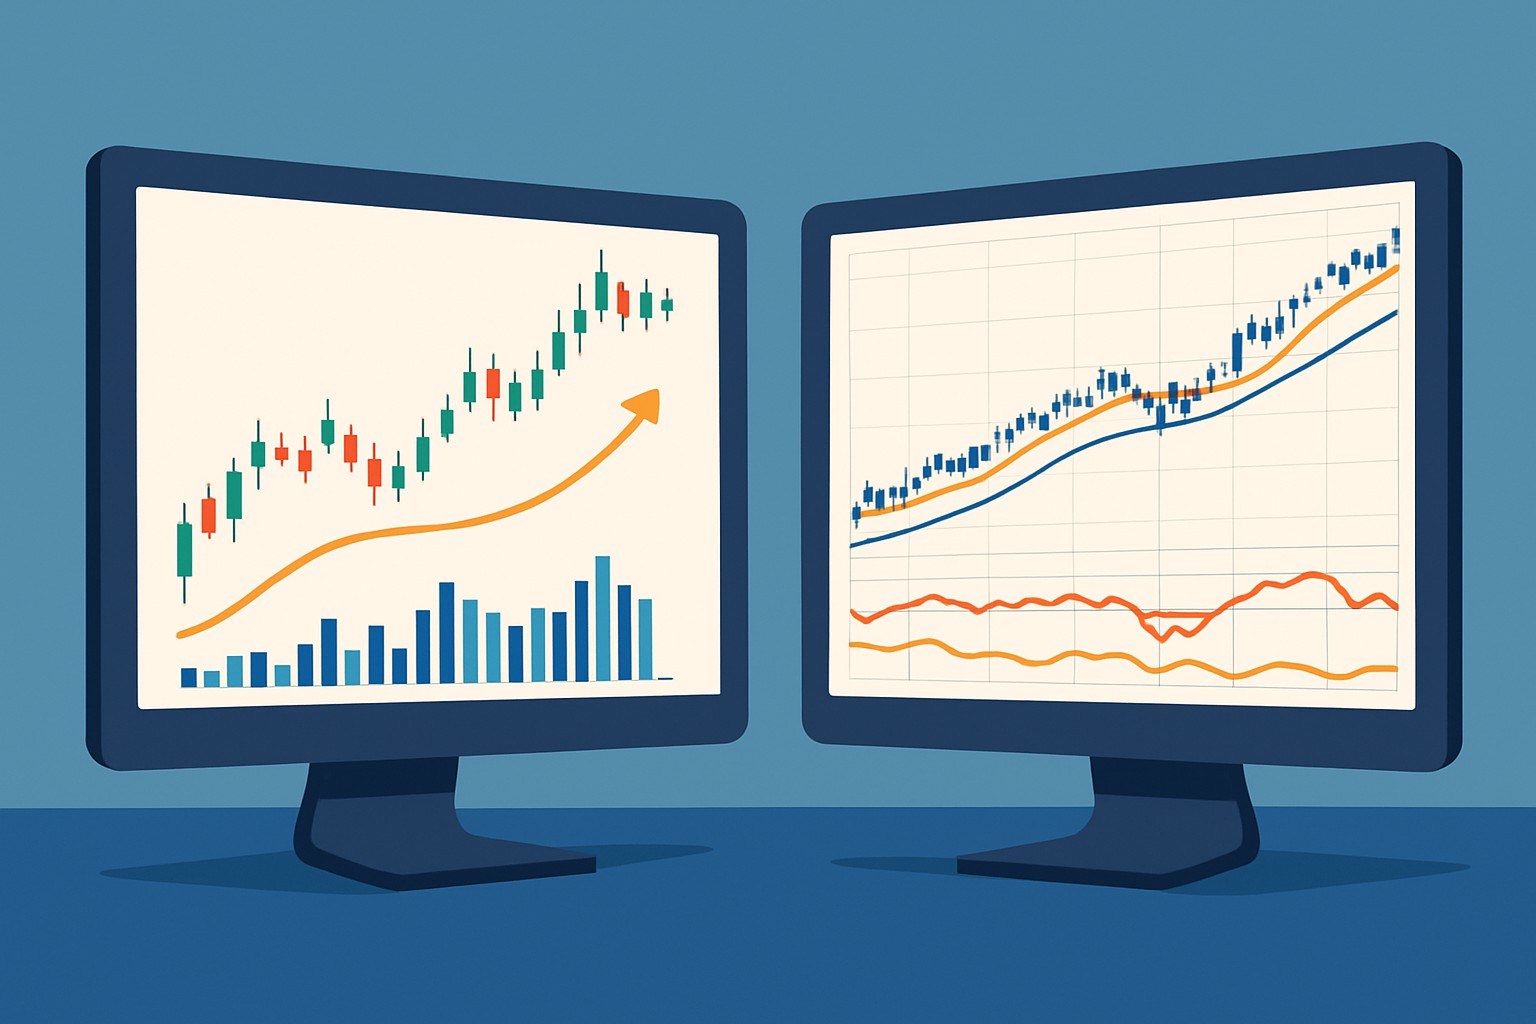
Both TrendSpider and StockCharts offer a solid lineup of charting tools and technical indicators, but each shines in its own unique way when it comes to customization and innovation. TrendSpider mixes advanced drawing features and customizable indicators with automated trendline detection and Fibonacci retracements, giving traders a toolkit that often seems just a step ahead of the pack. StockCharts presents a broad library of indicators and overlays from the well-known classics to some pretty niche picks.
TrendSpider has made a name for itself with its AI-powered automation and is shaking up how traders tackle chart analysis these days. It offers features like automated trendline detection, multi-timeframe analysis and smart alerts that cut down on the usual manual grunt work. StockCharts, on the other hand, isn’t quite as AI-heavy but still brings solid automation to the table like scanning and alerts and leans more on user settings.
Access to data and market coverage are absolutely vital when it comes to digging deep into chart analysis. TrendSpider doesn’t disappoint by covering major asset classes like stocks, ETFs, crypto and forex. It mostly serves up real-time or near real-time data feeds. On the other hand, StockCharts brings a broad market spread to the table and shines with its impressive historical depth especially for US stocks and ETFs.
Taking a closer look at pricing reveals clear differences between TrendSpider and StockCharts. TrendSpider offers three plans: Basic at $39.99, Pro at $59.99 and Premium at $99.99. Each upgrade brings more automation, a wider range of indicators and richer market data—kind of like leveling up in a game. StockCharts tends to be easier on the wallet with Pro+ at $19.95, Premium at $39.95 and Elite at $59.95 per month. If you’re mostly into straightforward charting and sharp educational resources, StockCharts delivers solid bang for your buck. TrendSpider’s steeper price tag reflects its push toward innovation and AI-powered tools. Think of it as the fancy sports car of charting platforms.
| Feature | TrendSpider Basic ($39.99/mo) | TrendSpider Pro ($59.99/mo) | TrendSpider Premium ($99.99/mo) | StockCharts Pro+ ($19.95/mo) | StockCharts Premium ($39.95/mo) | StockCharts Elite ($59.95/mo) |
|---|---|---|---|---|---|---|
| Automated Technical Analysis | ✓ | ✓ | ✓ | ✗ | ✗ | ✗ |
| Custom Indicators | Limited, but enough to get your feet wet | Full suite for serious chart wizards | Full suite for serious chart wizards | Limited, some basics included | Full, for those who want it all | Full, no compromises |
| Real-time Data | A bit delayed or partial, nothing too fancy | Fresh off the press, live data coming in | Live and kicking real-time data for you | Delayed, not quite instant | Real-time, keeping you up to speed | Real-time, because timing is everything |
| Multi-timeframe Analysis | Basic tools to get you started | Advanced features for deeper dives | Advanced features for deeper dives | Basic, just the essentials | Advanced, for the detail-oriented | Advanced, for the detail-oriented |
| Automated Alerts | Limited alerts to keep it simple | Full alert capabilities to catch every move | Full alert capabilities to catch every move | Basic alerts, covering the essentials | Full alerts, so you do not miss a beat | Full alerts, so you do not miss a beat |
| Heat Maps | ✗ | ✗ | ✗ | ✓ | ✓ | ✓ |
| Backtesting Tools | ✗ | ✓ | ✓ | ✗ | ✗ | ✗ |
| Trial Period | 7 days to kick the tires | Same 7-day trial, enough to explore | 7 days, classic trial period to decide | 14 days, double the usual time | 14 days, a generous window to try out | 14 days, plenty of time to test drive |
| Refund Policy | No refunds after that first week | No refunds after that first week | No refunds after that first week | 30 days, giving you peace of mind | 30 days, a nice cushion if needed | 30 days, because life happens |
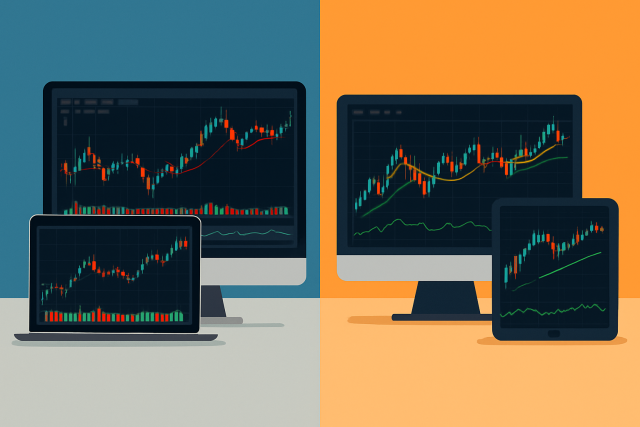
Both TrendSpider and StockCharts understand the importance of smooth access across devices and ensure their platforms are mobile-friendly. TrendSpider offers responsive web and desktop apps but hasn’t rolled out a native mobile app yet. Instead, it relies on browser-based access with alert notifications to keep you in the loop. StockCharts offers dedicated mobile apps that complement its desktop platform well. These apps let traders view charts offline and receive push notifications.
When it comes to lending a hand, we have got your back. Whether you are just starting out or diving deeper, our resources and support channels are here to make the journey smoother—no headaches included.
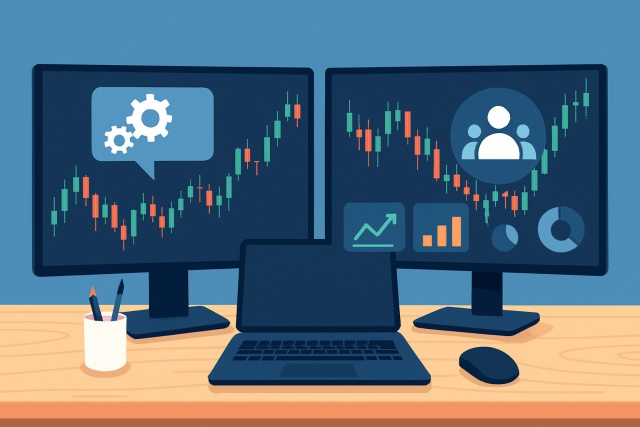
Customer support and educational resources really set these platforms apart in interesting ways. TrendSpider offers live chat and email support plus personalized onboarding with detailed tutorials that feel made just for you. It zeroes in on active traders. Its knowledge base and community might be smaller but they are more focused and to the point. StockCharts, meanwhile, rolls out a broad array of educational materials and webinars and lively forums buzzing with discussions.
When comparing trendspider vs stockcharts, TrendSpider really shines with automation and clever charting features that save you time—especially if you’re an active trader who loves the latest AI tools. On the flip side, StockCharts feels like a cozy spot for those who appreciate educational materials, broader market coverage and a budget-friendly charting platform.
TrendSpider shines by packing in advanced automated technical analysis with sharp AI-driven pattern recognition and flexible charting tools. It’s a strong pick for active traders who relish digging into the details, though the platform’s complexity and cost could throw a wrench in the works for beginners or people keeping an eye on their wallet—especially if they’re after a more balanced approach with fundamental analysis.
Active traders and investors who appreciate detailed technical charting, automation, and pattern recognition to fine-tune their trading strategies, and who are ready to put in the time to really learn the ins and outs of the platform.
| |
|---|---|
| Advantages | Limitations |
Automatic Technical Analysis Automatically spots trends, support and resistance levels, and entry or exit points—helping users save a ton of time while boosting accuracy. It’s a bit like having a seasoned analyst looking over your shoulder, minus the coffee breaks. | Steep Learning Curve New users might feel a bit overwhelmed by the platform’s rich feature set and automation tools—think of it as a dense forest that takes some time to navigate but rewarding once you find the trail. |
Customizable Indicators Lets users build and tweak technical indicators to fit their own trading playbook, dialing up the personalization so it feels like the platform truly gets your style. | Higher Price Compared to Some Competitors Premium plans can be on the pricier side, which might give casual traders or those on a tighter budget a bit of sticker shock. |
Enhanced Charting Capabilities Packed with advanced tools like multi-timeframe analysis and Fibonacci retracements, it gives a richer, more detailed picture of market moves—perfect for those who like to dig a little deeper. | Heavy Reliance on Technical Analysis Focuses mostly on technical indicators, so if you’re someone who likes to mix in fundamental data, you might find this a bit one-dimensional. |
Innovative Pattern Recognition Powered by sharp AI algorithms, it reliably picks up on a wide range of chart patterns, helping traders spot both golden opportunities and hidden risks before they’re obvious. | |
Efficient Decision-Making Tools Features like dynamic price alerts and automated analysis take the guesswork out of trading, letting users make faster, more confident decisions—as if the platform has your back at every turn. | |
Wide Range of Plans Offers tiered plans from basic to premium, catering to everyone from green beginners to seasoned pros, so you can scale up as your skills and ambitions grow. | |

Struggling to improve your trading performance? Edgewonk's advanced analytics tools are designed to give you the edge you need.
With detailed trade journaling, robust strategy analysis, and psychological insights, you'll gain a comprehensive understanding of your strengths and weaknesses. Don't miss out on this game-changing opportunity.

Driven by a passion for democratizing financial markets, Vivienne creates educational content on forex trading and currency market fundamentals for beginners.
Read PostsDive into our comprehensive analysis of TrendSpider vs Trade Ideas, two powerful trading platforms,...
Explore a detailed comparison of TradingView and TrendSpider, two leading charting platforms, to det...
Debating between TrendSpider and ThinkorSwim? This in-depth comparison analyzes charting tools, auto...
Unlock the power of TrendSpider charts with advanced AI tools, automated alerts, and customizable in...