


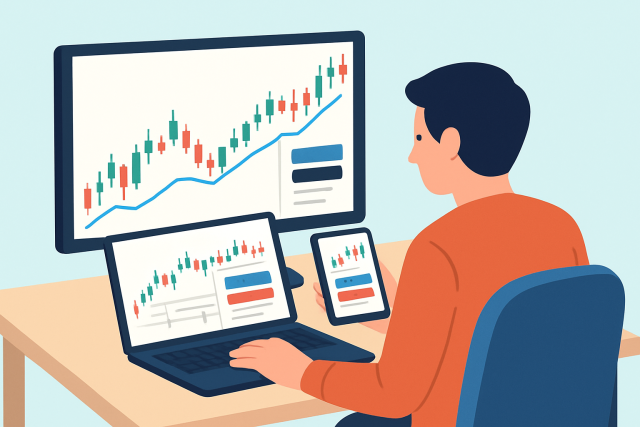
TradingView
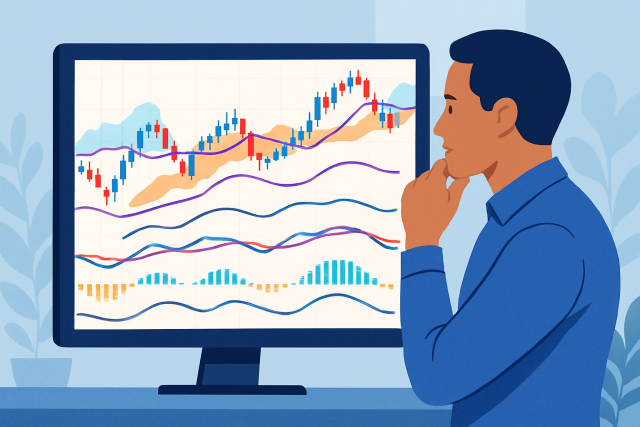
Some of the Best Indicators on TradingView for Trend Traders
Explore the top trend-trading indicators on TradingView that empower traders to identify strong mark...
In this article we dive into how traders can harness the power of TradingView Heatmap to read markets more clearly and make smarter, better-informed decisions.
The TradingView Heatmap is a handy visualization tool that helps traders quickly get a feel for market sentiment, sector performance and price momentum. Whether you are a seasoned pro or just starting out, it offers an easy-to-grasp color-coded snapshot of the market.
Heatmaps in trading take what can be a tangled mess of price and volume data and turn it into colorful and easy-to-grasp grids that highlight performance trends across stocks, cryptocurrencies or forex pairs.
Let's dive into the TradingView Heatmap, a nifty tool that helps you spot market trends and movements at a glance. Think of it as your financial weather map, showing where the action is heating up or cooling down in the trading world. Whether you are a seasoned trader or just starting out, this heatmap adds a splash of color and clarity to complex data, making it easier to navigate the sometimes choppy waters of the market.
Getting started with the TradingView Heatmap is a breeze. Sign up for a free account or log into your existing profile whichever floats your boat. Once you’re in the interface is pretty intuitive and it’s a snap to find the heatmap tool.
Head over to tradingview.com and either create an account or log in to your TradingView profile. It’s the first step and thankfully a quick one.
Once you are on the main dashboard, look for the Heatmaps option under the ‘Markets’ tab. There is no need to hunt around.
Choose the market that grabs your interest whether it is stocks, forex or cryptocurrencies. There’s something for everyone.
Adjust the heatmap’s time frame to catch daily, weekly or intraday trends so you’re always in the know and never flying blind.
Lean on those color-coded tiles and size markers because they’re like a secret code that helps you quickly understand what’s happening in the market at a glance.
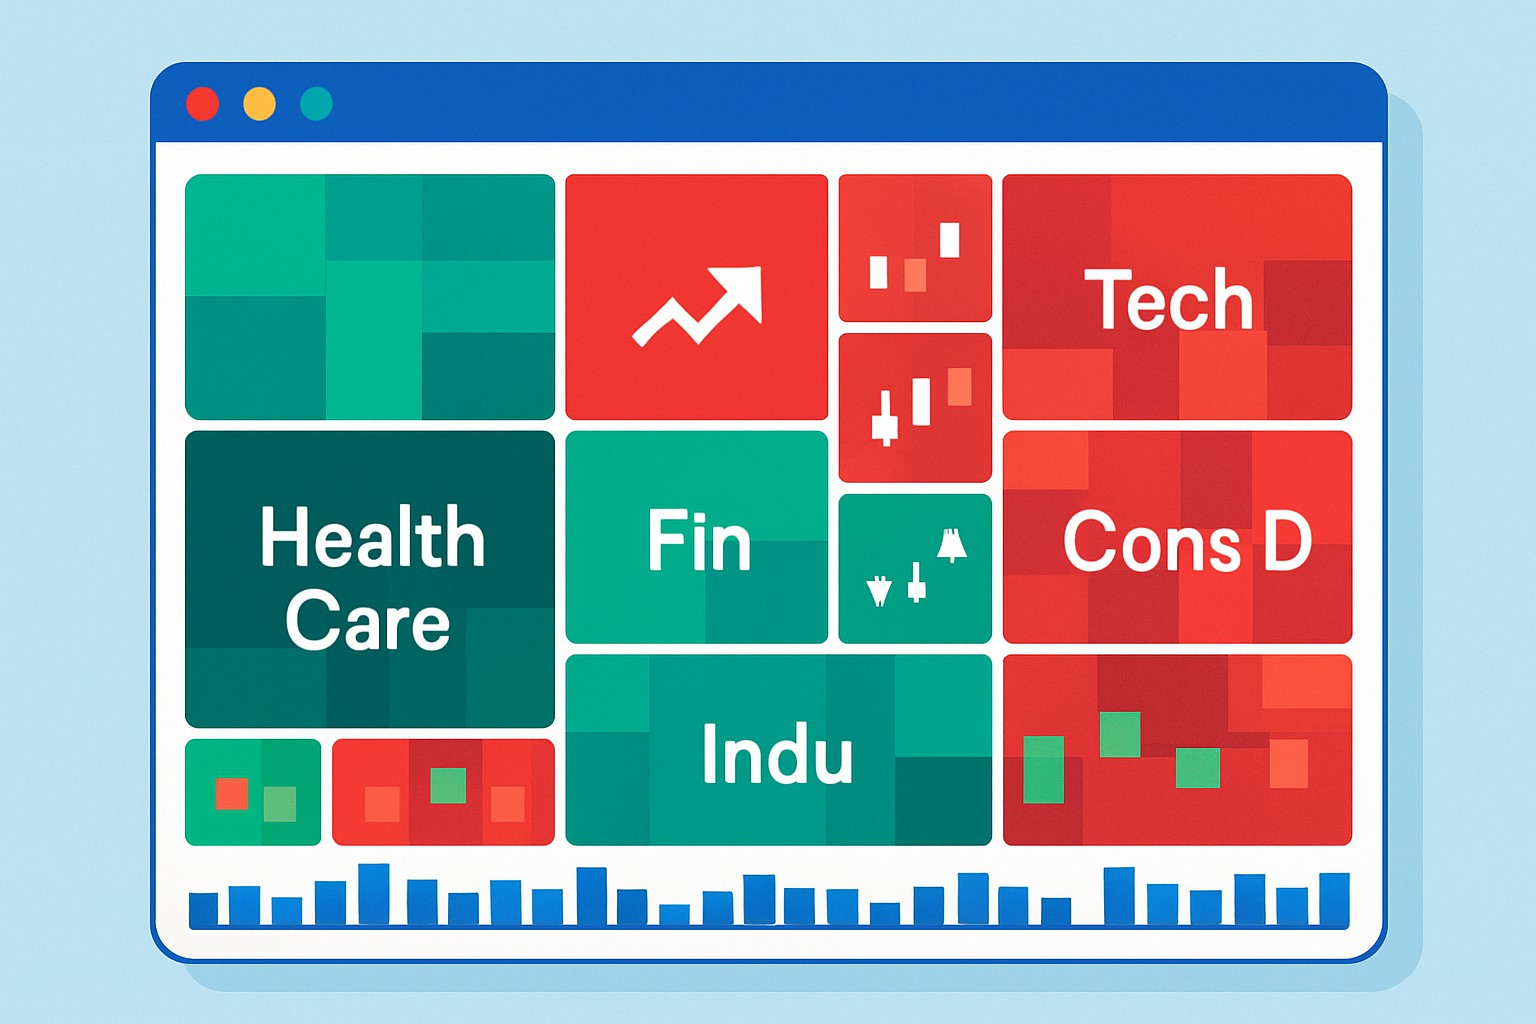
The TradingView Heatmap paints market data with a splash of colors and varying tile sizes. Green shades generally shout out price increases, while red tones signal those dips we all keep an eye on. The deeper the color, the heftier the move—darker hues mean bigger shifts. Tile sizes? They’re your quick glimpse at relative trading volume, helping you spot which assets are getting the most action without breaking a sweat.
| Color | Meaning | Market Sentiment Indicated | Example Usage |
|---|---|---|---|
| Bright Green | Clear Strong Upward Move | Bullish | Zeroing in on the top winners in a sector — the ones really stealing the show |
| Light Green | Gentle Upward Trend | Mildly Bullish | Keeping an eye on those steady momentum gains that quietly add up |
| Grey | Stable or No Major Change | Neutral | Assets holding their ground, not rocking the boat much |
| Light Red | Slight Downward Trend | Mildly Bearish | Catching those early hints that things might be getting a bit shaky |
| Bright Red | Noticeable Downward Move | Bearish | Spotlighting the clear losers or sectors feeling the heat |
| Tile Size | Relative Volume | Larger size means higher volume | Highlighting assets that are seeing the real action in liquidity |
Interpreting heatmap colors and sizes requires a bit of finesse especially since sudden price jumps or volume spikes can throw off what the visuals are actually showing at least for a little while.
Using the TradingView Heatmap in your market analysis lets you quickly zero in on which sectors are stealing the spotlight and where momentum is quietly shifting gears. It also shows what fresh trends are starting to take root.

Screenshot of the TradingView Heatmap tool illustrating sector performance across multiple stocks with clear green and red color coding.
During a technology sector rally the heatmap usually lights up the biggest gainers in bright green. The larger tiles represent higher volume. This setup helps traders spot the top performers quickly and consider jumping into trades before the momentum fizzles out.
The TradingView Heatmap offers plenty of customization and lets you fine-tune settings, filters and layouts to fit your individual trading approach. Playing around with these options can really help you zero in on your favorite markets or asset types.
Pick the market or exchange you want to zero in on whether that’s stocks, forex or cryptocurrencies.
Tweak the time intervals to see how things have played out over different stretches like a day, a week or a whole month.
Play around with filters such as sectors, indices or asset classes to hone in on the parts of the market that catch your eye.
Save your customized heatmap layouts so you can jump back to your favorite setups without missing a beat.
Link up your personal watchlists to keep a close eye on particular assets right there alongside the heatmap because who wants to hunt for them separately?
Keep your heatmap fresh and up to date during those live trading hours so you’re always tuned into the latest market twists and turns. Giving it a regular once-over, especially alongside alerts on TradingView—which you can snag with their Pro+ and Premium plans—can seriously boost your chances of nailing those well-timed trading moves.
Combining heatmap data with technical indicators and fundamental analysis usually helps steer clear of the usual pitfalls and paints a clearer, more complete picture of the market—at least that is what I have found.
The TradingView Heatmap is more than just a nifty visual tool. It’s a handy companion for swing traders, day traders and portfolio managers alike. By diving into its real-time updates and sector analysis users can often catch momentum shifts and sector rotations before they hit the headlines.

Struggling to improve your trading performance? Edgewonk's advanced analytics tools are designed to give you the edge you need.
With detailed trade journaling, robust strategy analysis, and psychological insights, you'll gain a comprehensive understanding of your strengths and weaknesses. Don't miss out on this game-changing opportunity.

With 20 years experience in commodity trading, Jasper provides insights into energy markets, precious metals, and agricultural futures with a focus on macroeconomic trends.
Read PostsExplore the top trend-trading indicators on TradingView that empower traders to identify strong mark...
Discover a step-by-step guide to using TradingView for seamless chart navigation and mastering its p...
Discover the step-by-step process to enable TradingView on Tradovate, unlocking seamless trading com...
Discover how to set up paper trading in TradingView with this step-by-step beginner’s guide. Gain co...