


Technical Analysis
Momentum Indicator Basics for Traders
Master the momentum indicator to gauge price speed and trend strength. This ultimate guide covers ca...
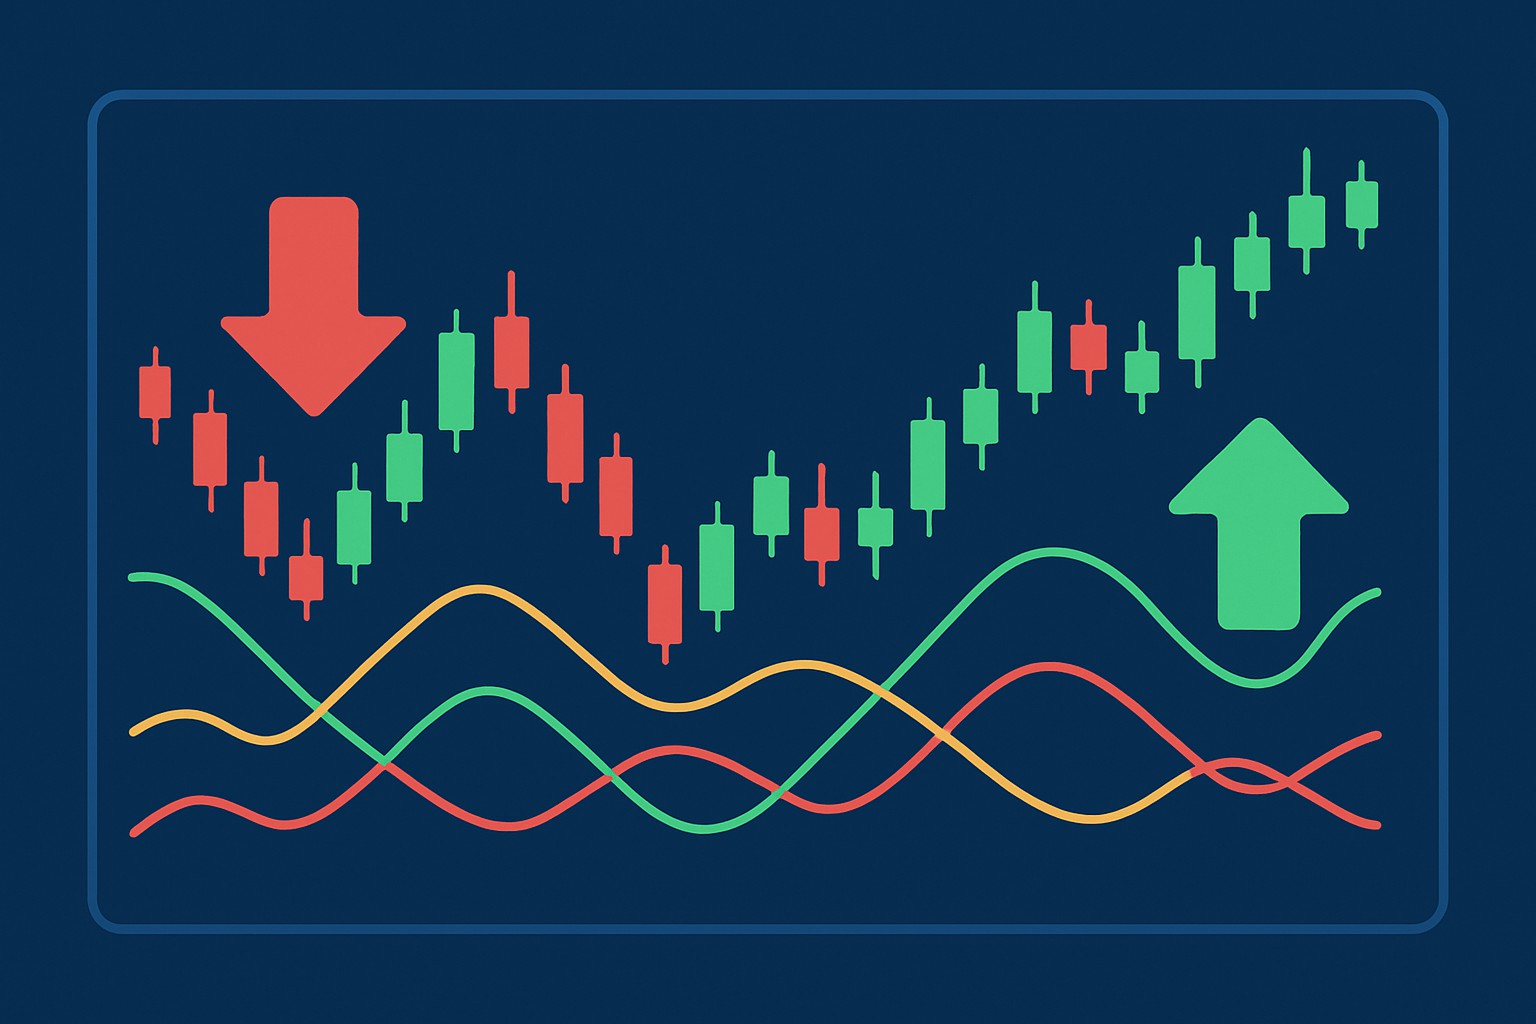
Trends play a starring role in almost every trading strategy yet pinning down the exact moment when a trend starts to lose steam or flips direction can be tricky. The Average Directional Indicator or ADX for short is a trusty technical tool that gauges how powerful a trend really is and helps traders catch pivotal moments when the market might be gearing up for a change.
The Average Directional Indicator or ADX was developed by J. Welles Wilder Jr., a name that often pops up in technical analysis circles. Unlike many indicators that focus on price direction or momentum alone, the ADX shows how strong a trend is whether it’s climbing or sliding.
A common slip-up traders often fall into is assuming the ADX line shows direction just like the +DI or -DI lines do. While +DI and -DI clearly signal whether the bulls or bears are calling the shots, the ADX line itself doesn’t point in any direction. Instead, it quietly tells you how strong the current trend really is.
The ADX acts like a filter smoothing out price movements and ranges to slice through all the usual market noise. It kicks off by measuring price ranges and directional moves then rolls that into a moving average to create three lines: the +DI, which shadows upward moves; the -DI, tracking dips; and the ADX itself, which monitors the overall trend strength by sizing up the gap between the two directionals.
Calculate the True Range (TR), which is essentially the largest price swing between periods. Be sure to include any gaps as well as highs and lows.
Determine the Directional Movement by comparing today's highs and lows with those of the previous period. Upward moves are identified as +DM, while downward moves are labeled -DM. It is pretty straightforward.
Smooth the +DM and -DM values using a moving average to create the +DI and -DI lines. These lines reveal upward and downward momentum, giving you a clearer picture of who is winning the tug of war.
Calculate the ADX by taking the smoothed absolute difference between +DI and -DI, then dividing that by their sum and smoothing it again. This final line helps you identify the strength of the trend and acts like a confidence meter for the trend.
This smoothing process helps cut through the noise of those unpredictable price movements, letting the ADX zero in on the market’s real directional momentum. It hands traders a much clearer signal, highlighting when a trend is gaining steam or starting to lose its punch.
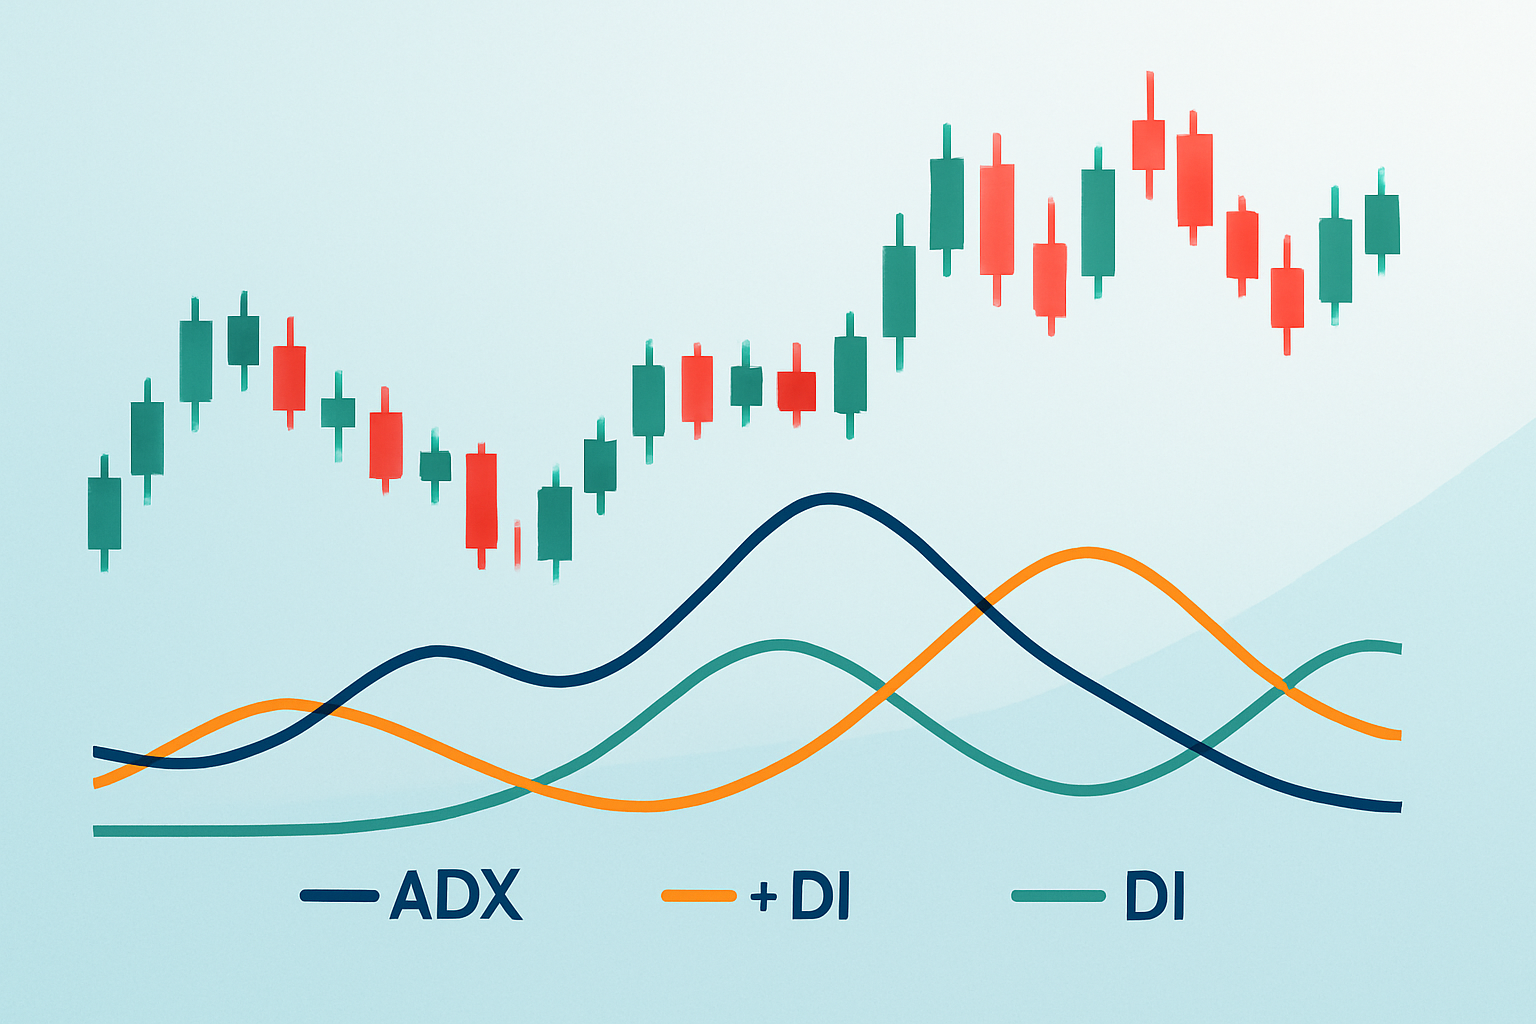
A sample price chart displaying the ADX indicator with +DI and -DI lines to illustrate trend strength and direction.
The ADX value swings between 0 and 100 and offers a handy snapshot of how strong the current market trend really is. By reading these signals traders can get a decent feel for whether the market is charging ahead with a solid trend, starting to lose steam or just wandering aimlessly without any clear direction.
Getting a good handle on the ADX line itself is important. It is also worth keeping a close watch on where the +DI and -DI lines sit in relation to each other. When these three pieces come together they paint a clearer picture for traders not just of how powerful a trend might be but also the direction it is likely headed.
A straightforward and often reliable way to gauge market direction is to watch the crosses between the +DI and -DI lines. When +DI edges above -DI it’s a sign that bullish momentum is picking up steam. Conversely, when -DI creeps above +DI it usually points to mounting bearish pressure.
| Scenario | Interpretation |
|---|---|
| +DI > -DI and ADX rising | Looks like a strong uptrend is really kicking in here |
| -DI > +DI and ADX rising | Seems a solid downtrend is starting to take hold |
| ADX below 20 | The market’s kind of drifting without a clear direction, basically moving sideways |
| ADX falling after previously high | The trend’s losing steam and might be gearing up for a reversal before long |
Getting the most out of the ADX takes more than just glancing at its values. Seasoned traders usually team up its signals with other technical indicators and good old price action analysis to get a clearer picture of when trends are really starting to shift.
Add the ADX indicator to your trading chart using the default 14-period setting and make a mental note of the ADX, +DI and -DI lines as they unfold.
Keep a keen eye on the ADX line’s level and direction. Readings above 20 that are rising usually hint that a trend is gaining steam.
Watch closely for moments when the +DI and -DI lines cross paths because this is often a subtle nudge that the trend could be about to take a new turn.
Double-check ADX signals with other trusty tools like price action patterns, moving averages or momentum oscillators. It’s like getting a second opinion before making a call to help weed out any false alarms.
Spot the peaks and valleys in the ADX line to sense when a trend might be running out of juice and a reversal might be lurking just around the corner.
The ADX won’t spill the beans on whether the price is headed up or down. Instead, it’s all about showing how strong the current trend really is. I’ve found this indicator works like a charm when you team it up with other tools that do a better job at pointing out direction, such as moving averages or oscillators.
The ADX works like a strength gauge for a moving treadmill — it shows how strong and fast the movement is without revealing the direction the treadmill is heading.
The ADX is clearly a handy tool, but many traders tend to trip up on a few common slip-ups that dull its effectiveness.
When traders spot these limitations they usually steer clear of putting all their eggs in one ADX basket. They treat it as just one piece of a bigger trading puzzle. Using it effectively takes patience and a willingness to team up the ADX with other indicators or price action. Keep in mind that its smoothing nature inevitably means some lag.
Watching the ADX in action is a real eye-opener when it comes to grasping how it signals trend strength and those sneaky reversals in real market scenes.
Example 1 shows the ADX line climbing above 20 just as the +DI crosses over the -DI line. This is a classic sign that a fresh and robust uptrend is taking hold. Meanwhile, Example 2 paints a slightly different picture. The ADX hits a peak and then starts to fall after the +DI and -DI lines cross in opposite directions. This suggests the current trend might be losing steam or a reversal could be quietly sneaking up.
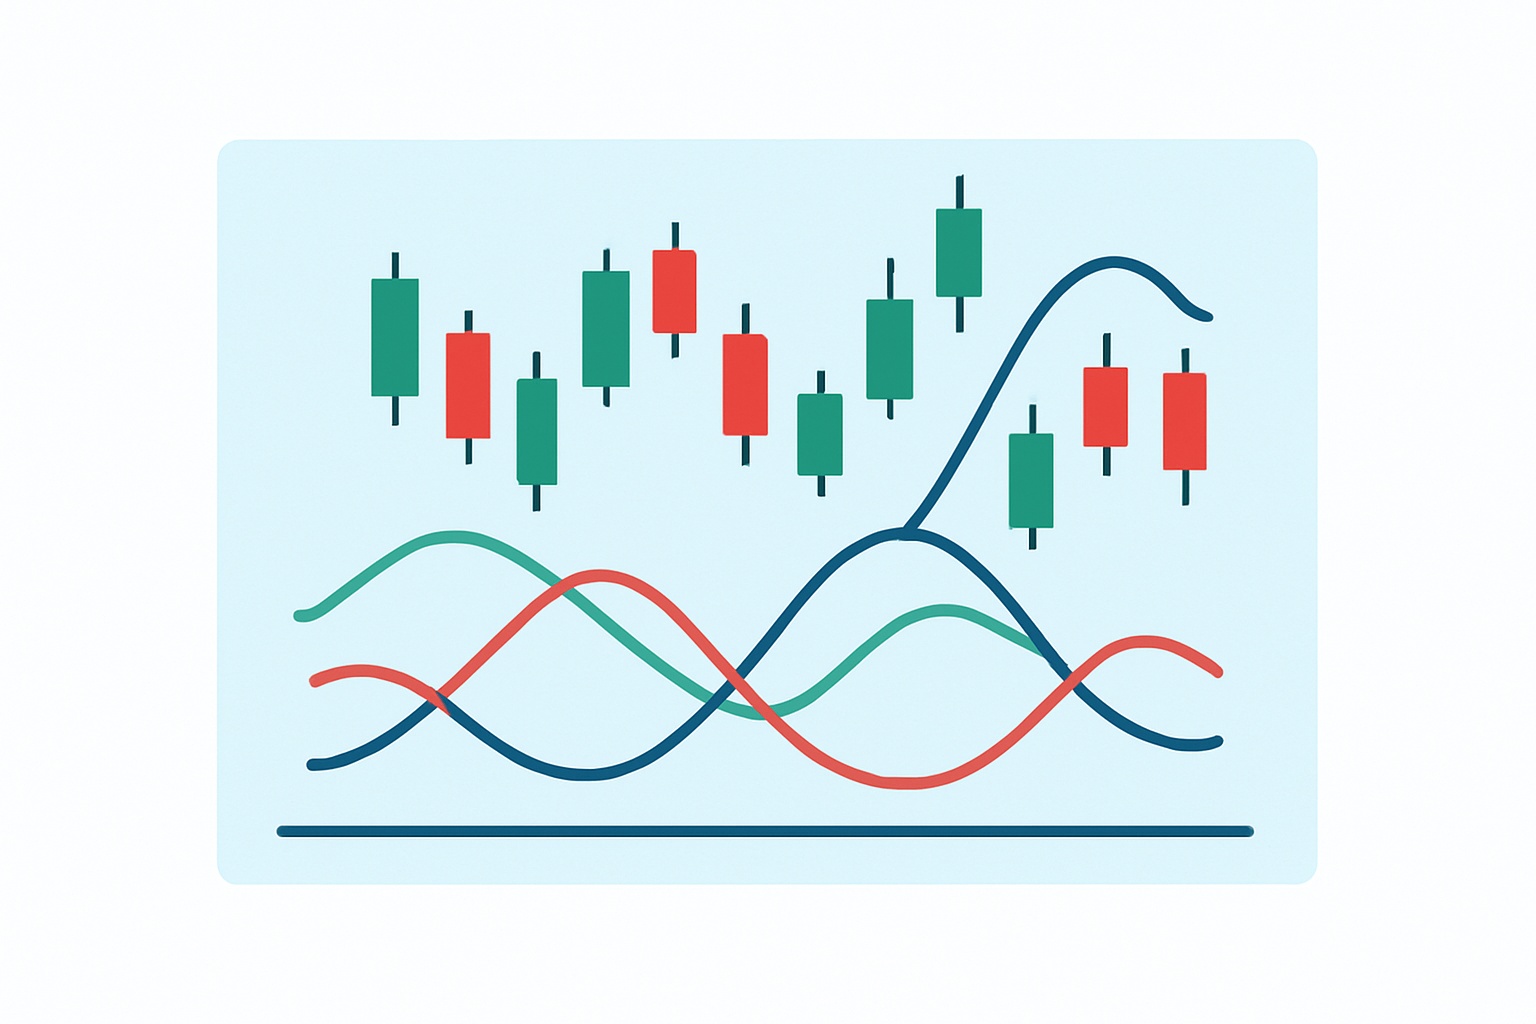
Chart illustrating two examples where the ADX indicator signals trend initiation and trend weakening through +DI and -DI line crossings.
These examples highlight why it’s important to keep an eye on the ADX line’s strength reading together with the directional indicators +DI and -DI. This combo often paints a clearer picture of genuine entry points right at the beginning of trends.
To really squeeze the most juice out of the average directional indicator, traders typically pair it with some other handy tools and stick to a disciplined game plan.
When traders tweak the average directional indicator settings and blend them carefully with other analytics, they often end up sharpening their strategies and steering clear of those pesky false signals. Platforms like TradingView really shine here, offering user-friendly charting tools that feature ADX alongside a whole bunch of other handy indicators.

Are you tired of juggling multiple tools for your trading needs? TradingView is the all-in-one platform that streamlines your analysis and decision-making.
With its powerful charting capabilities, real-time data, and vibrant community, TradingView empowers traders like you to stay ahead of the market. Join thousands who trust TradingView for their trading success.

Driven by a passion for democratizing financial markets, Vivienne creates educational content on forex trading and currency market fundamentals for beginners.
Read PostsMaster the momentum indicator to gauge price speed and trend strength. This ultimate guide covers ca...

Discover the wedge falling pattern's secrets and learn step-by-step how to trade this powerful techn...

Discover how to recognize the evening star candlestick pattern—a powerful signal highlighting potent...

Discover how inside bar patterns signal key market pauses and possible breakouts or reversals. This...