


Technical Analysis
How to Trade Using a Bollinger Bands Strategy
Master trading with Bollinger Bands by understanding volatility, setup patterns, and risk management...
The momentum indicator holds a key spot in technical analysis by keeping tabs on how fast prices are shifting. It’s a handy tool that helps traders size up the strength of a trend and quite often points to potential reversals with impressive accuracy
A momentum indicator measures how quickly an asset's price is moving over a chosen timeframe and gives traders a heads-up on whether the price action is picking up steam or starting to lose it. Unlike trend indicators that track the overall direction or average movement of the price, momentum indicators zoom in on the speed of price changes.
The basic momentum indicator works by comparing the current price with the price from a set number of periods ago. Think of it as checking how far the price has come over a little stretch of time. It’s calculated either as a ratio or a difference, whichever floats your boat.
| Period | Closing Price | Momentum (10-period) |
|---|---|---|
| 1 | 100 | - |
| 2 | 102 | - |
| 3 | 101 | - |
| 4 | 103 | - |
| 5 | 105 | - |
| 6 | 107 | - |
| 7 | 106 | - |
| 8 | 108 | - |
| 9 | 110 | - |
| 10 | 111 | - |
| 11 | 115 | (115 divided by 100) times 100 gives us a neat 115.0 |
| 12 | 117 | (117 divided by 102) times 100 comes out to about 114.7, not too shabby |
| 13 | 119 | (119 divided by 101) times 100 lands at roughly 117.8—looks promising |
| 14 | 120 | (120 divided by 103) times 100 totals about 116.5, keeping the momentum alive |
| 15 | 122 | (122 divided by 105) times 100 hits around 116.2, still holding strong |
Several well-known momentum indicators are out there that bring their own flavor when calculating values and carving out unique roles in trading. Some zoom in purely on price speed like the Rate of Change (ROC). Others act as oscillators such as the Relative Strength Index (RSI).
Interpreting momentum indicator values is about understanding what rising or falling momentum hints at in price movement. Typically, values above 100 suggest some upward pressure is building. Numbers dipping below 100 often mean the momentum is losing steam. Traders watch for divergences between momentum and price trends because they can be early warning signs for possible reversals.
Momentum indicators often turn out to be trusty tools when it comes to running various trading strategies. Traders lean on them to confirm trends and nail their entry and exit points. They also capitalize on momentum breakouts and spot reversals triggered by divergence.
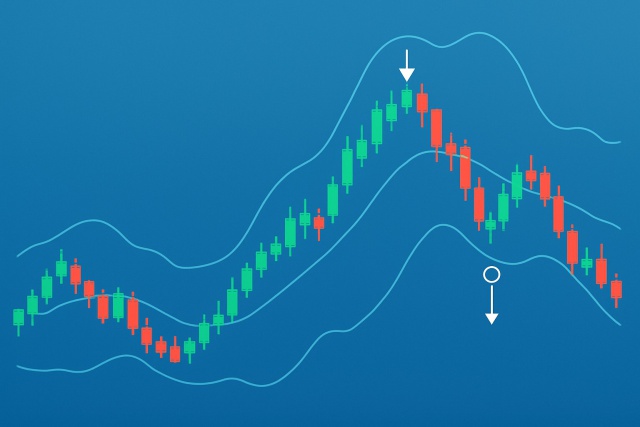
Keep an eye out for momentum readings above 100 to confirm a strong uptrend before jumping into long positions. It is like waiting for the green light at a particularly busy intersection.
Think about entering trades when momentum crosses those key threshold levels because this often hints at shifts in the market’s speed. It is kind of like catching a change in the wind.
Pay close attention to divergences between price action and momentum indicators. These little mismatches can be your early warning for trend reversals or signs that the price might just be about to take a breather.
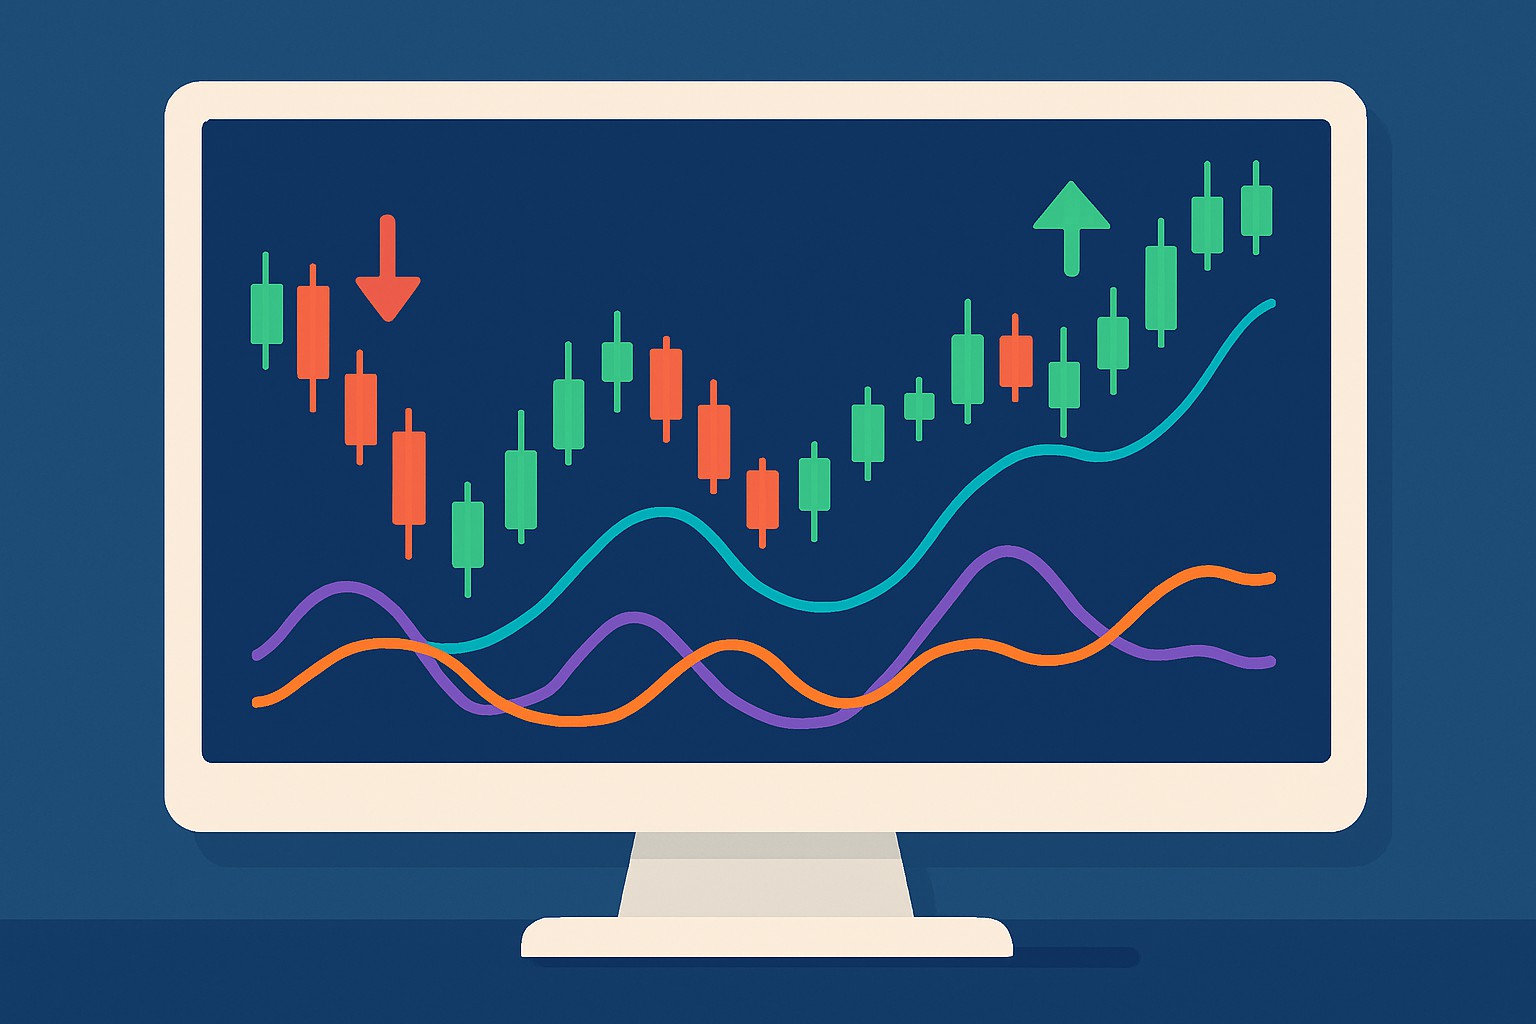
Always pair momentum indicators with other trend tools, like moving averages or support and resistance levels. This is the best way to double-check signals and avoid falling for false alarms.
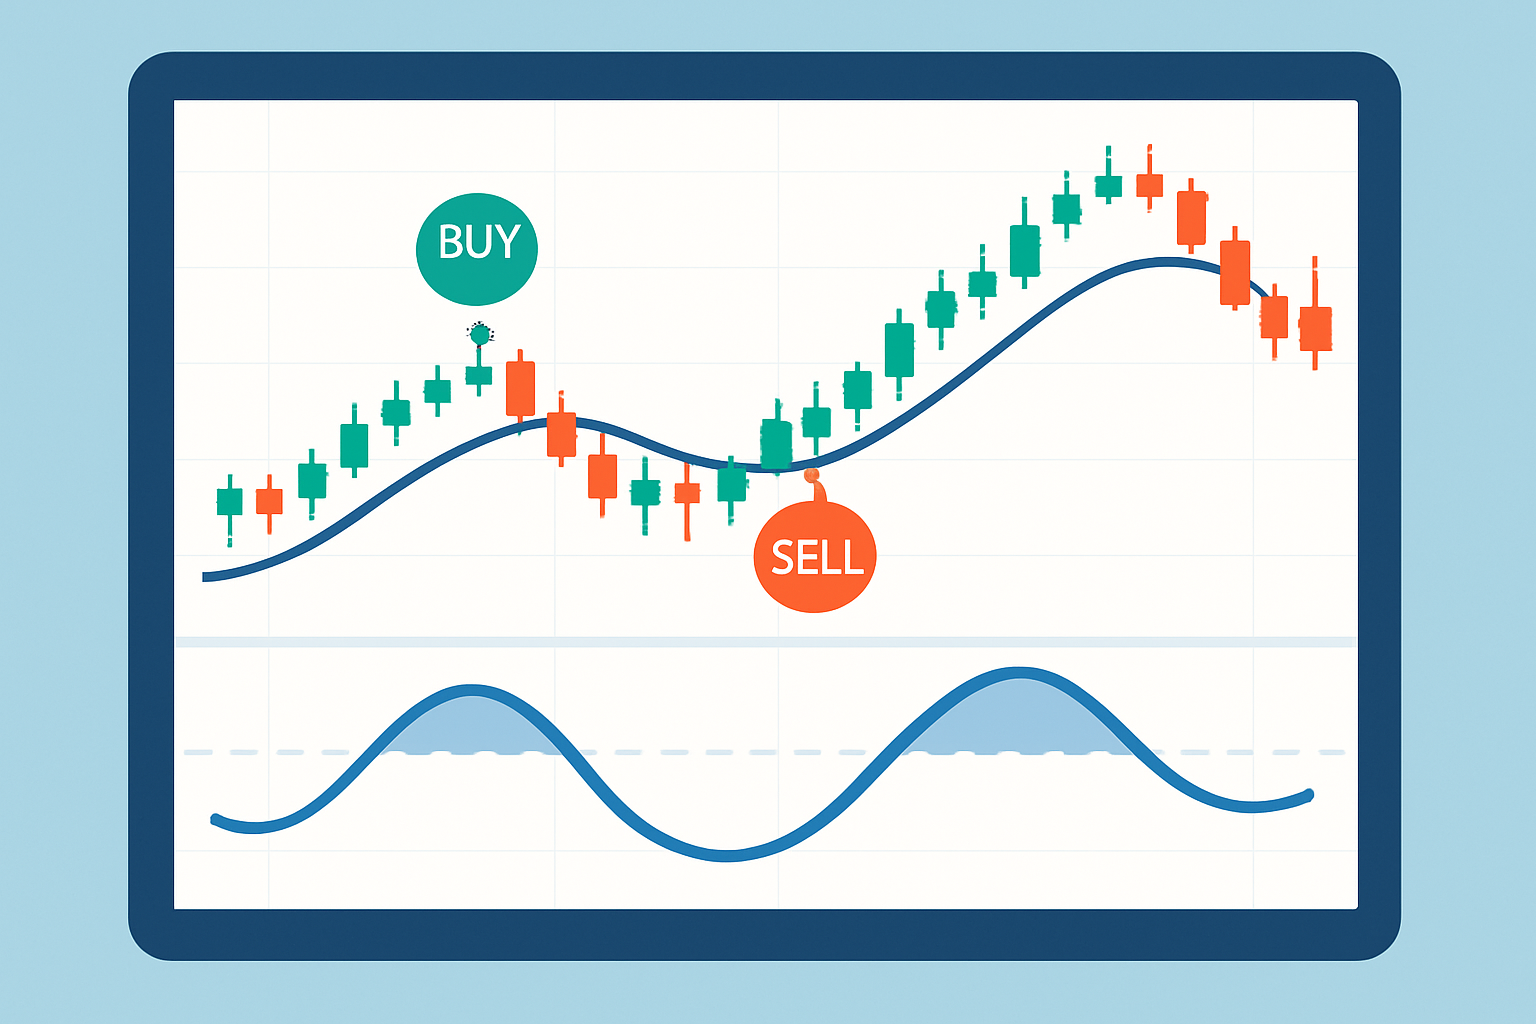
Example of momentum indicator applied to price chart highlighting trade signals and trend confirmation
To squeeze the most out of momentum indicators, traders usually avoid relying on them alone and keep the bigger market picture in mind. Common slip-ups include misreading signals when the market is stuck in a sideways slog. They also lean too heavily on momentum without considering volume and brush off volatility that can throw a wrench in the signals.
"Momentum definitely plays a key role in trading, but honestly, its true power shines through when you blend it with other technical tools to cook up solid, actionable signals you can actually trust." — Experienced Market Analyst
Momentum indicators tend to shine brightest when paired with other technical analysis tools, like moving averages that help sketch out the trend direction. Support and resistance levels point out those key price zones that traders keep an eye on, and volume analysis often steps in to back up price movements.
Many top charting platforms come loaded with momentum indicators you can tweak to your heart's content—perfect for traders wanting a better grip on market moves. TradingView, for instance, offers many tools and scripts that its lively community shares, making it a playground for traders. Meanwhile, Binance and TrendSpider mix slick charting features with automated alerts and AI-powered pattern recognition that feel like having a savvy assistant whispering in your ear.
Traders often lean on momentum indicators to sniff out profitable opportunities across a range of markets. These handy tools catch the early whispers of trend reversals and give a thumbs-up when breakouts pack some real punch.
A trader noticed some sneaky momentum divergences on the RSI that hinted an early burnout in a strong uptrend, wisely choosing to exit just before a nasty correction came crashing down.
Momentum indicator readings gave a thumbs-up to the strength behind a breakout in a leading tech stock, signaling a pretty solid entry point worth jumping on.
A divergence between price highs and momentum lows flashed a bearish reversal, giving short sellers a nice opportunity to capitalize.
Combining momentum analysis with sudden volume spikes helped nail well-timed entries during a wild and unpredictable cryptocurrency rally.

Struggling to improve your trading performance? Edgewonk's advanced analytics tools are designed to give you the edge you need.
With detailed trade journaling, robust strategy analysis, and psychological insights, you'll gain a comprehensive understanding of your strengths and weaknesses. Don't miss out on this game-changing opportunity.

Transforming the field of technical analysis through innovative charting techniques, Scarlett specializes in pattern recognition and momentum trading strategies for equity markets.
Read PostsMaster trading with Bollinger Bands by understanding volatility, setup patterns, and risk management...

Discover the wedge falling pattern's secrets and learn step-by-step how to trade this powerful techn...

Discover how to recognize the evening star candlestick pattern—a powerful signal highlighting potent...

Learn how the True Range indicator captures market volatility and price swings, empowering traders t...