


Technical Analysis
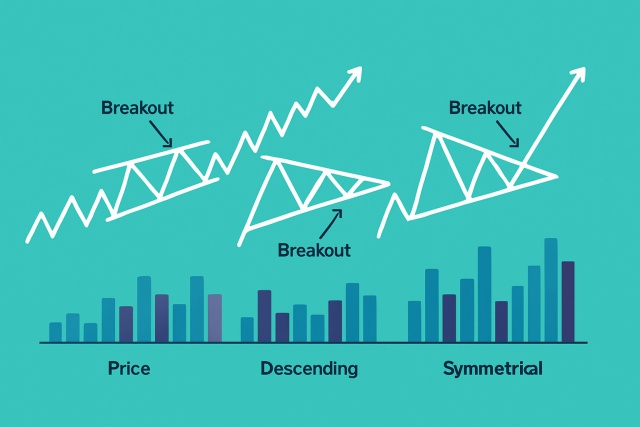
Reading Pattern Triangle To Predict Price Direction
Discover how pattern triangles help traders predict price movements. This guide breaks down triangle...
The wedge falling pattern is a classic chart formation that traders have seen time and again but still manages to trip people up often. In this article we’ll break down its distinctive shape and dig into what it usually signals. We will also share practical tips on how to trade it like a pro.
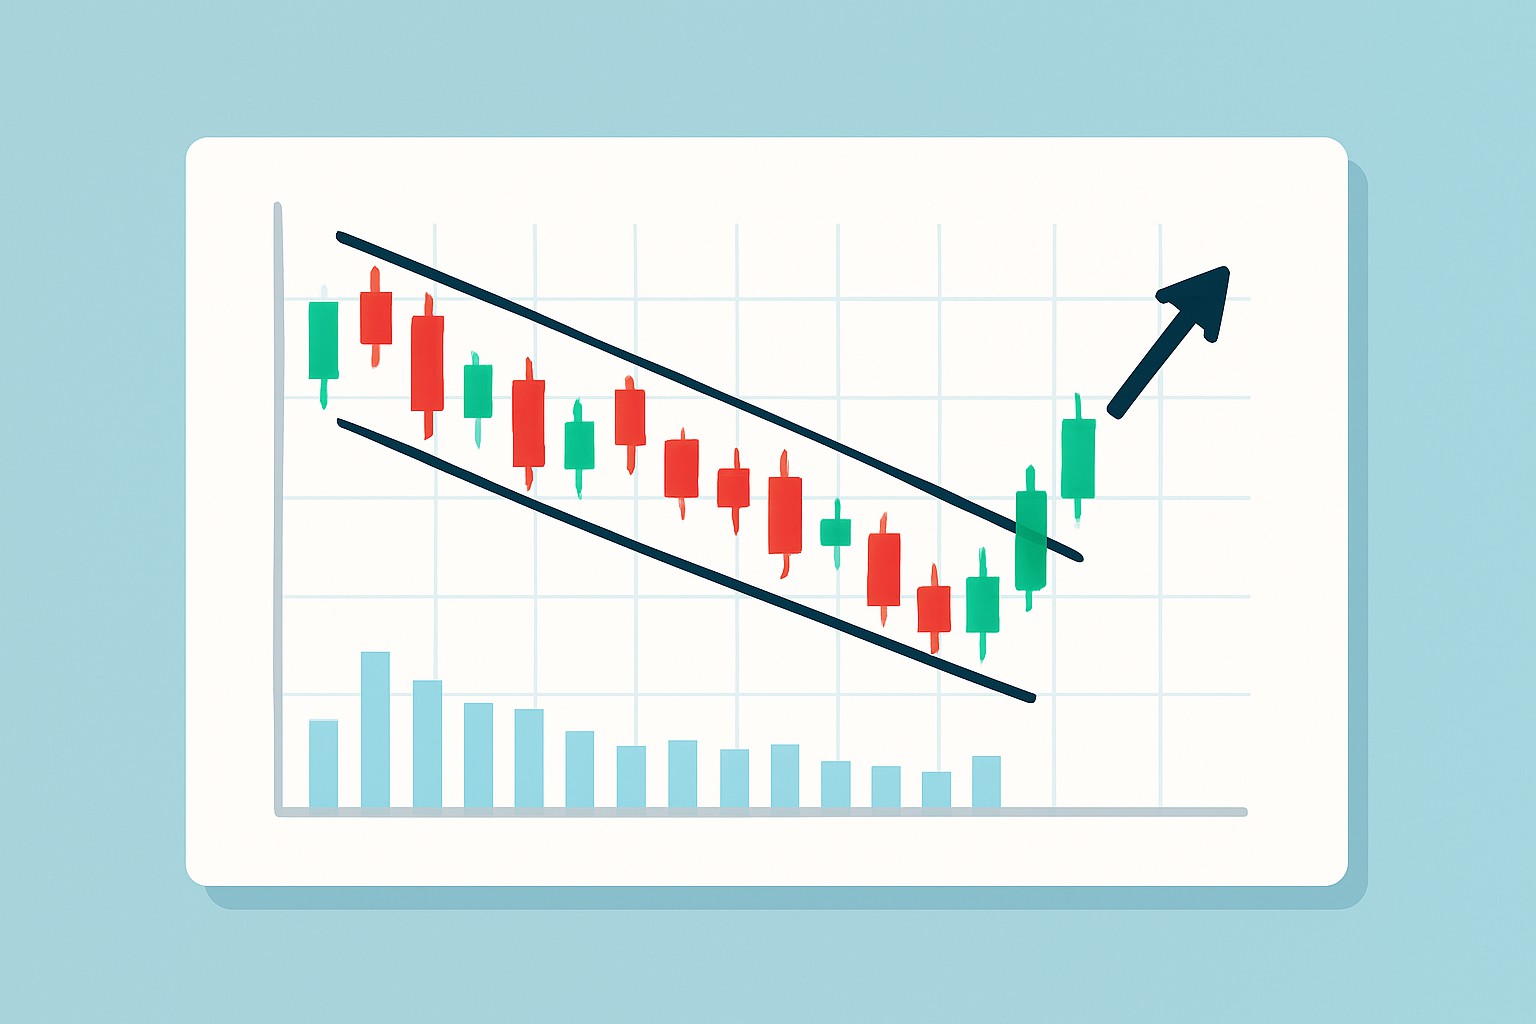
A wedge falling pattern is a bearish chart formation where the price action squeezes tightly between two downward-sloping trendlines that gradually come together. Unlike typical triangles both the support and resistance lines slope downward, shaping a wedge that often hints at a potential bullish reversal or continuation.
Prices within the wedge usually move inside tightening boundaries and craft a pattern of lower highs and lower lows that inch closer over time. Volume often dwindles during this phase like air slowly leaking out of a sad deflating balloon.
The wedge falling pattern really catches the eye because it often signals a shift in market mood—from steady selling to a noticeable pickup in buying interest.
Many traders often jump to the conclusion that a falling wedge spells a bearish continuation. It looks like it is sliding down but this pattern's tightening converging shape usually sets the stage for a breakout instead.
Think of the wedge falling pattern as a compressed spring that’s just waiting to snap back. The price keeps squeezing tighter and tighter between those converging trendlines, building up a fair bit of tension. Then, when it finally lets loose, you’re often in for a sharp upward pop — kind of like a spring bouncing back with a bit of a rebound after being pressed down for a while.
Spotting a falling wedge usually involves carefully analyzing price charts on the right timeframes and drawing trendlines that make sense. It also requires keeping a close eye on volume behavior.
Spot a downtrend where the price keeps making lower highs and lower lows but the range begins to tighten up—a classic sign that a wedge might be taking shape.
Sketch two downward-sloping trendlines that gradually come together—one tracing the highs and the other following the lows—like they’re slowly inching toward a handshake.
Notice that volume often drops off steadily as the wedge forms, hinting that the selling pressure might be taking a breather.
Keep an eye out for subtle clues that a breakout could be on the horizon as the price edges closer to the wedge apex such as a modest uptick in volume or bullish candlestick signals popping up.
Seal the deal on the wedge pattern by waiting for a decisive breakout above the upper resistance line ideally backed by a surge in volume—patience pays here more than anything.
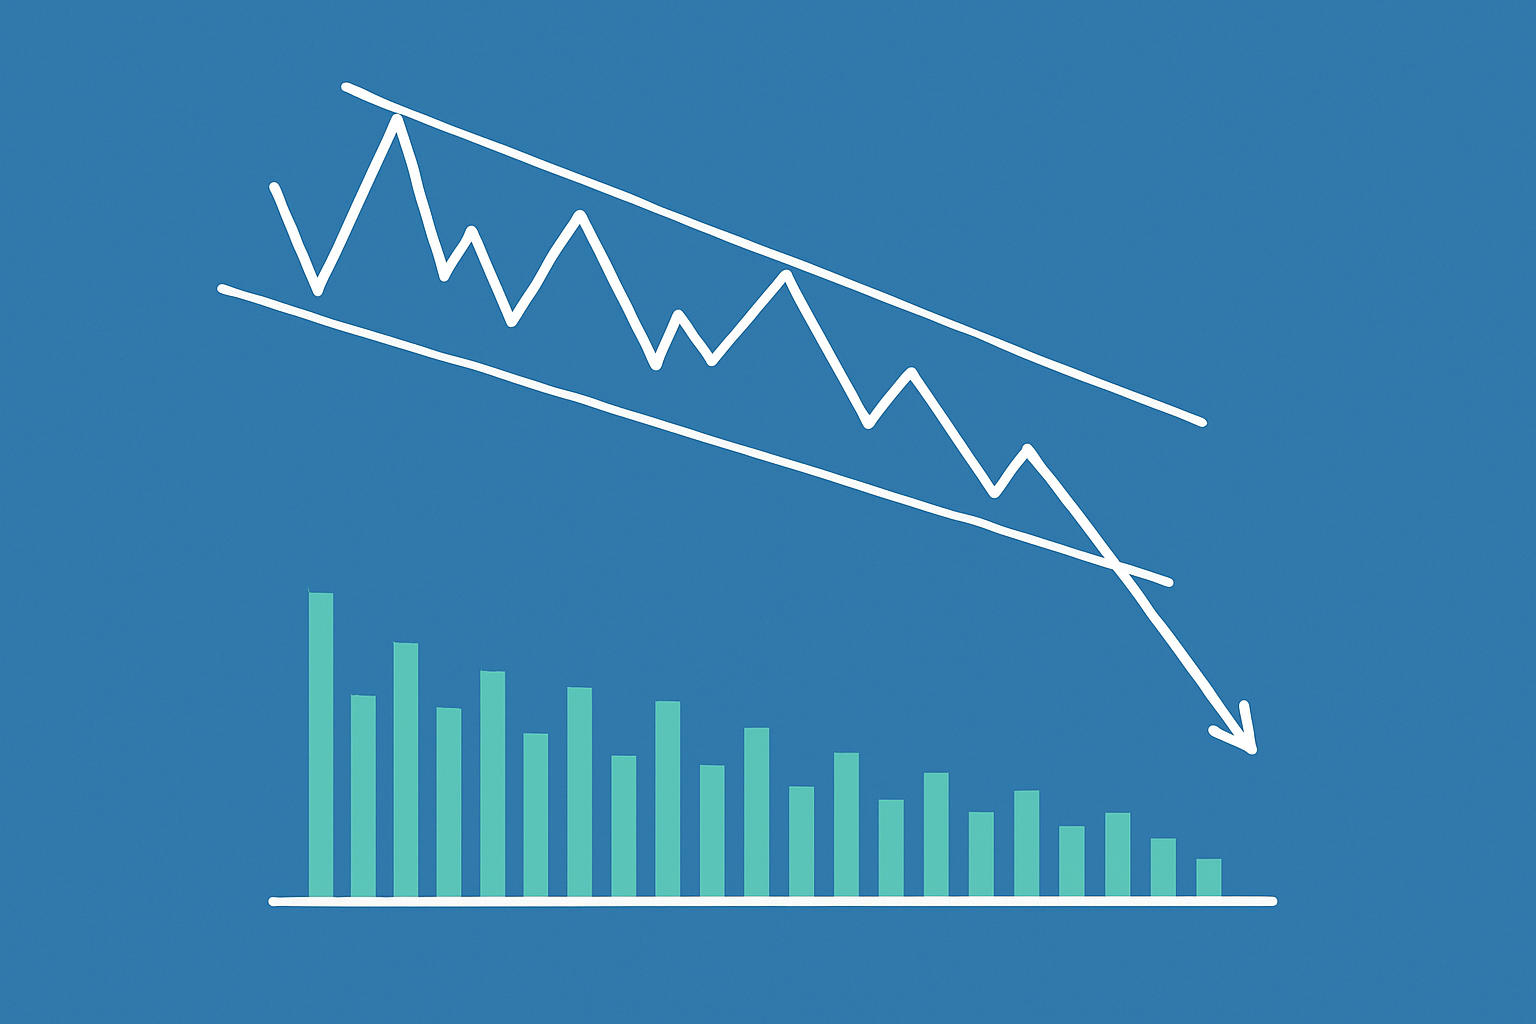
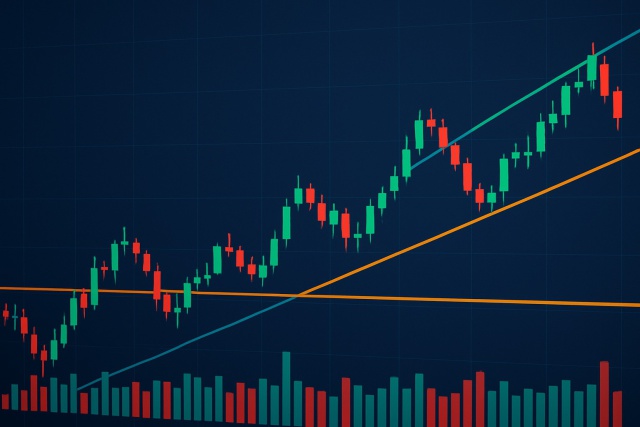
Example of a wedge falling pattern with annotated trendlines and volume to aid visual understanding
Trading the wedge falling pattern comes with a handful of trustworthy strategies, mostly revolving around jumping in when a breakout finally shows up and being downright disciplined about risk. Nailing the right position size combined with well-placed stop losses and profit targets tends to play nicely with what this pattern is shouting.
Managing risk is absolutely key when trading wedge falling patterns because false breakouts often catch traders off guard and lead to losses. Keeping a disciplined approach to stop loss placement is your best friend here. It acts as a safety net that helps protect your hard-earned capital. Patience is another virtue in this game. Rushing in before you get proper confirmation usually ends in regret. It’s vital to keep a cool head during those tense moments of price compression so you can wait for clear and convincing signals. On the tech side, leveraging advanced charting tools like TradingView or automated analysis platforms like TrendSpider can take some of the guesswork out of timing your entries and validating patterns. This usually boosts a trader’s confidence and accuracy.
Picture a cryptocurrency on Binance sliding from $50 down to $30. Over a few weeks its price carves out a falling wedge between $45 and $32 making lower highs and lows that slowly squeeze closer. Volume tapers off steadily which backs up the pattern. When the price breaks above the $45 resistance and volume picks up steam, the trader jumps in long at $46. They have wisely placed a stop loss at $31 just below the recent lows. Using the wedge's $13 height as a guide they set a take-profit target around $59.
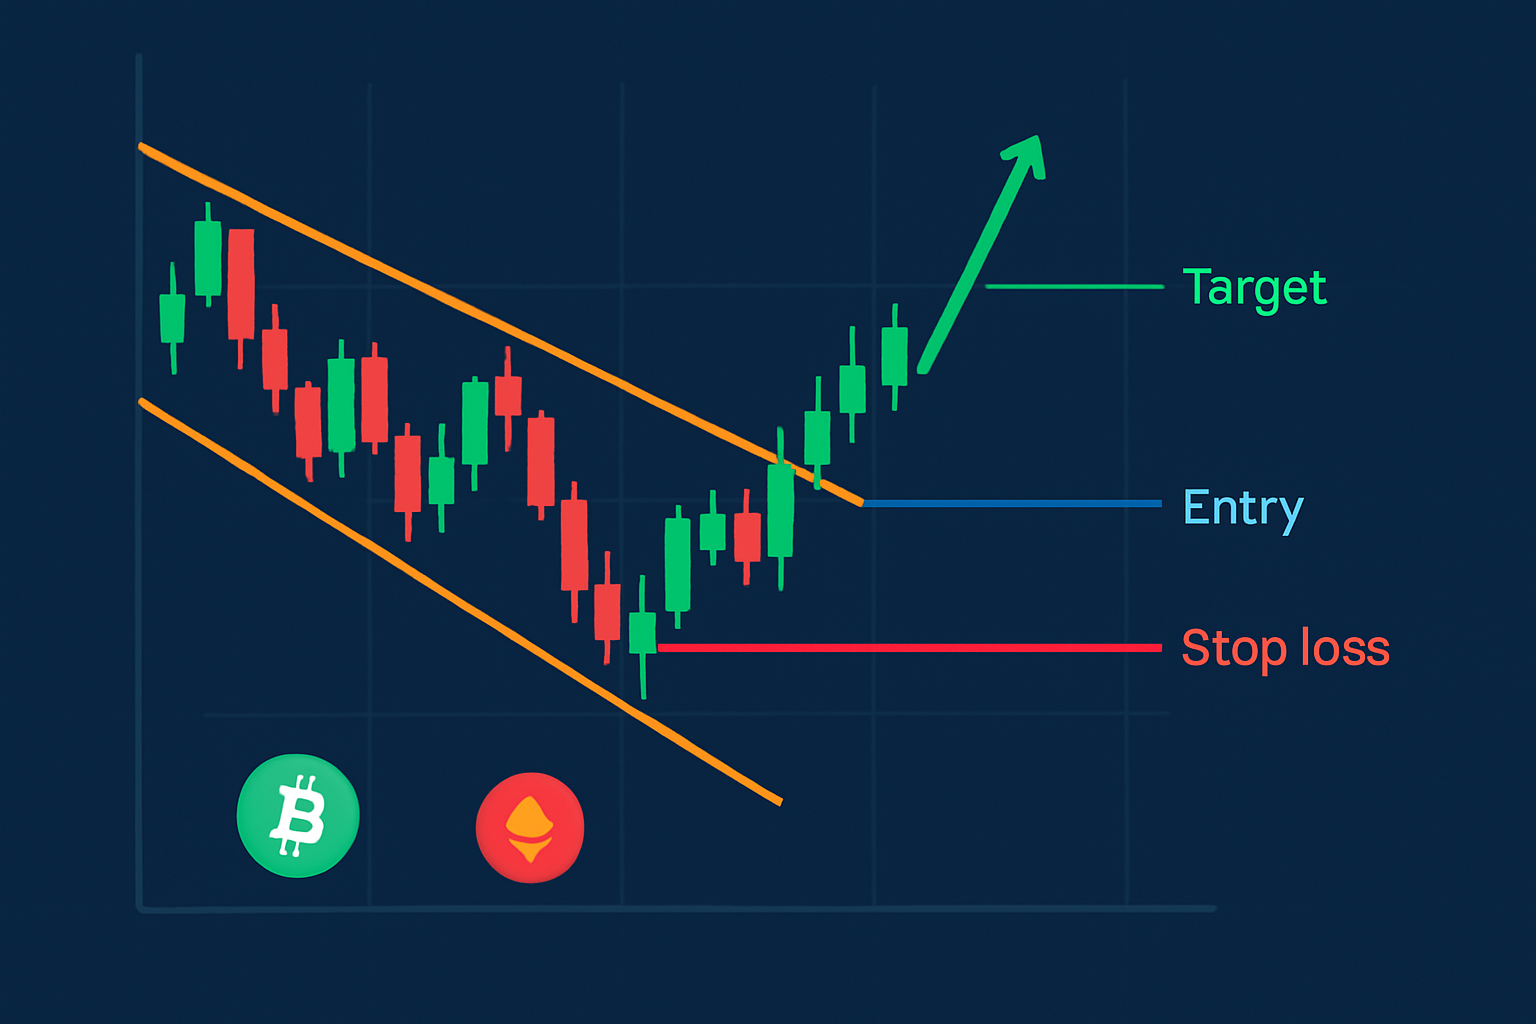
Illustrative example of a wedge falling trade setup showing all key trade parameters and breakout confirmation
Traders often jump the gun with wedge falling patterns and enter trades before proper confirmation rolls in. This can easily lead to misreading tricky signals.
It’s usually a smart move to combine wedge pattern analysis with volume studies, and then patiently wait for breakouts that are genuinely confirmed. It pays to stick to disciplined risk limits and avoid those tempting impulsive moves that can trip you up.
The wedge falling pattern really shines when you pair it with other technical indicators and some solid fundamental info.
Nailing consistent success with the wedge falling pattern usually boils down to steady, patient practice. I have found that going back through past trades and keeping a detailed journal of your setups and outcomes not only sharpens your pattern recognition but also guides you toward making smarter, more precise decisions as time goes on

Struggling to improve your trading performance? Edgewonk's advanced analytics tools are designed to give you the edge you need.
With detailed trade journaling, robust strategy analysis, and psychological insights, you'll gain a comprehensive understanding of your strengths and weaknesses. Don't miss out on this game-changing opportunity.

Known for demystifying complex derivatives trading through accessible education, this former Wall Street trader turned educator empowers retail investors with institutional-level strategies.
Read PostsDiscover how pattern triangles help traders predict price movements. This guide breaks down triangle...

Discover how to recognize the evening star candlestick pattern—a powerful signal highlighting potent...
Trend lines are essential tools in technical analysis that help traders identify market direction an...

Hidden bullish divergence is a key technical indicator revealing strong buying pressure beneath unce...