


Technical Analysis
How to Trade a Wedge Falling Pattern
Discover the wedge falling pattern's secrets and learn step-by-step how to trade this powerful techn...
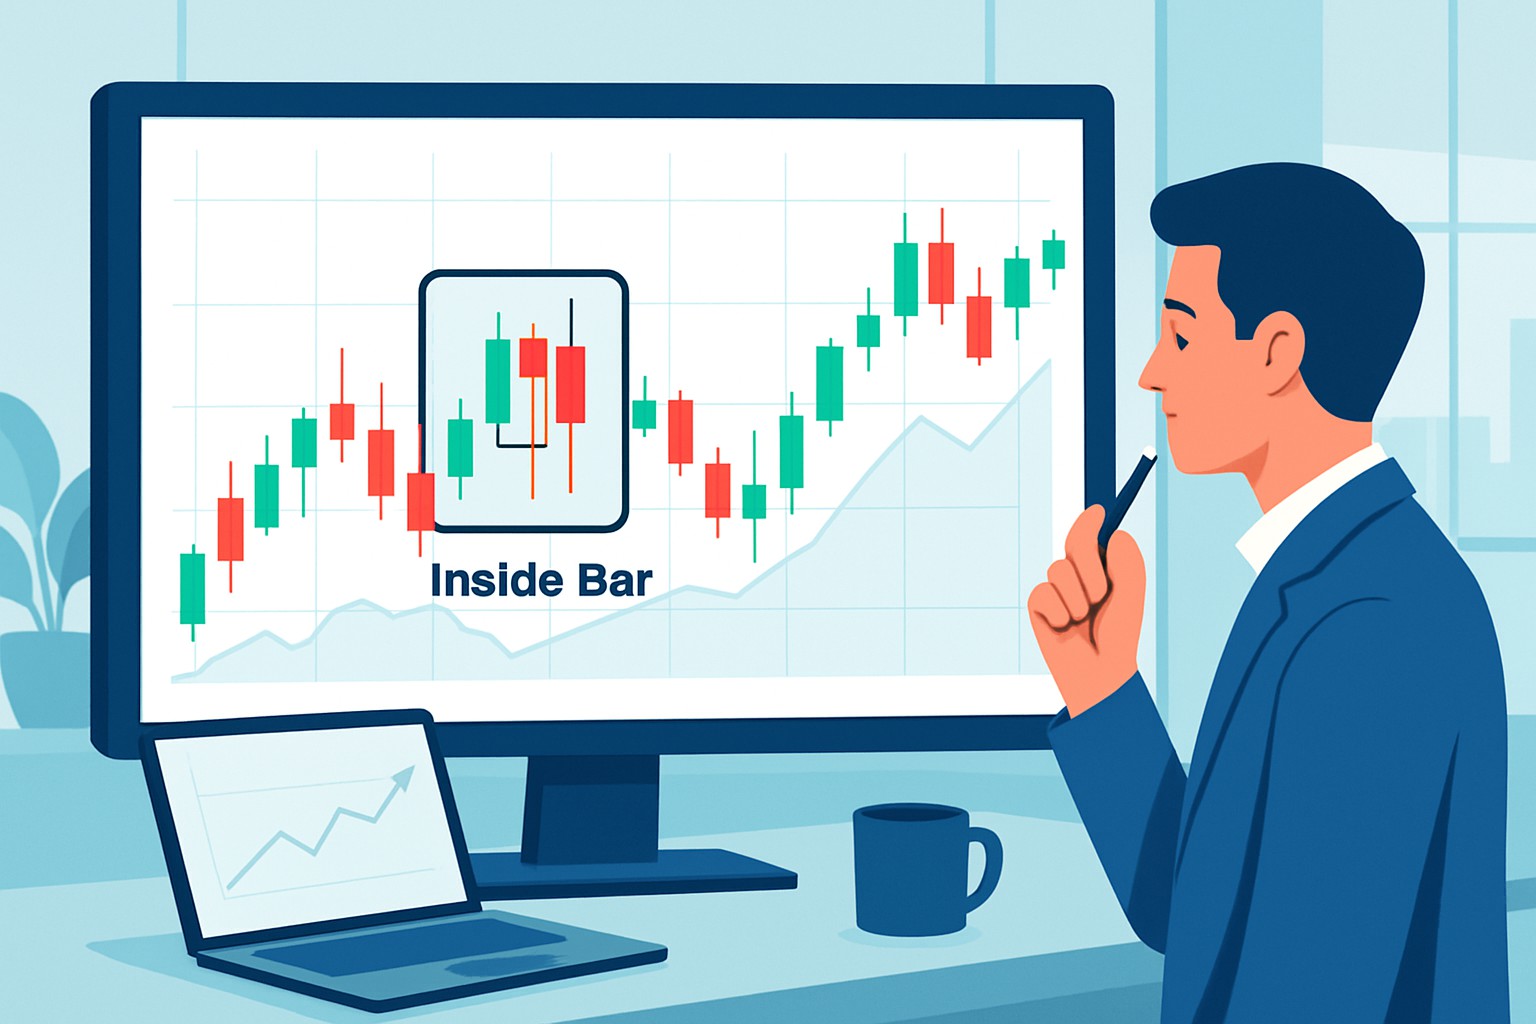
The inside bar pattern is a popular go-to in the world of technical analysis, helping traders keep an eye out for potential breakouts and those sneaky market reversals.
An inside bar pattern shows up when the current bar’s trading range—from high to low—snuggly fits within the range of the previous bar. Think of it as a bar nestling comfortably inside its predecessor on the chart, hinting at a pause in the action and a bit of hesitation among traders.
Imagine a tug-of-war frozen in time, with neither team willing to give an inch just yet. The market's feeling a bit indecisive, quietly gathering steam for whatever move is up next.
The inside bar pattern is a handy little signal because it often points to a market taking a breather or consolidating before making a big move.
The inside bar pattern feels a bit like a spring being tightly coiled—quiet and steady for the moment, but you can almost sense it’s just waiting to burst into action with some serious momentum.
Spotting inside bar patterns is actually pretty straightforward and plays nicely on both candlestick and bar charts. Once traders get the hang of recognizing this pattern the right way, it tends to become a trusty signal across various markets and timeframes.
Take a good hard look at the previous bar paying close attention to its high and low prices—they're the key players here.
Check if the current bar’s high isn’t poking above the previous bar’s high and its low isn’t dipping below the previous bar’s low. Think of it as keeping within the lines.
Make sure the full range of the current bar snugly fits inside the previous bar’s range without stepping over the boundaries.
Eyeball the volume and the overall market mood around this setup since higher volume tends to give stronger signals. A little extra confirmation helps.
Keep an eye out for back-to-back inside bars because when multiple bars huddle inside the mother bar the plot thickens and the pattern might just pack more punch.
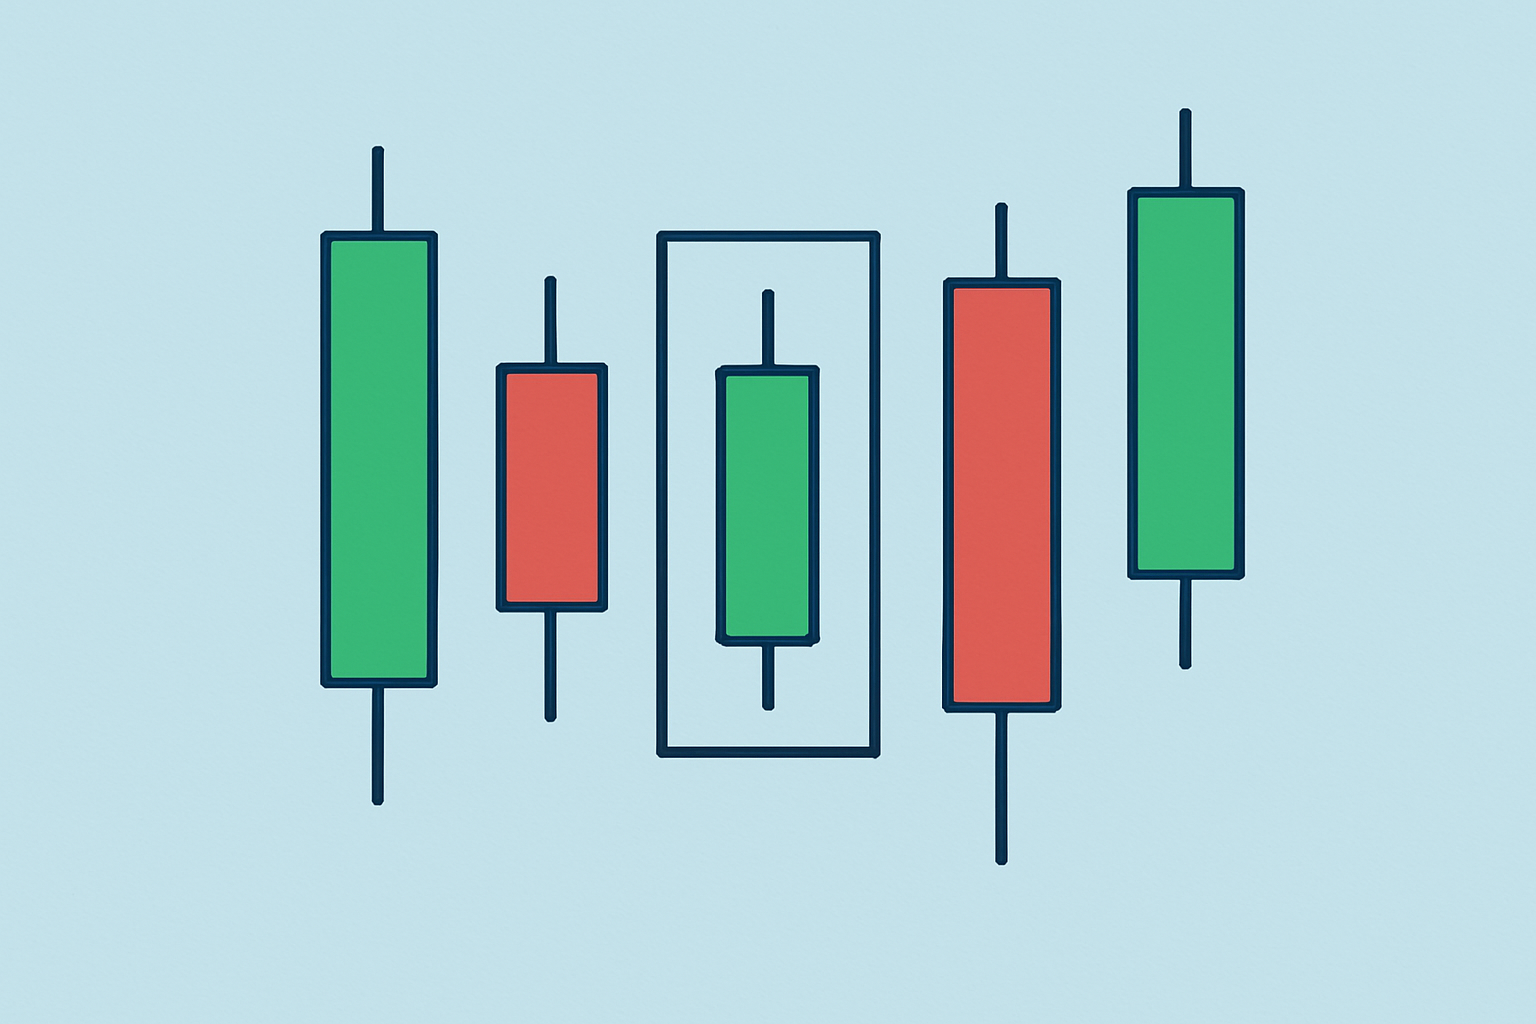
Candlestick chart illustrating a classic inside bar pattern where the smaller inside bar is fully contained within the previous mother bar.
Inside bars come in a variety of shapes, each packing its own little punch of meaning. Whether you’re looking at a single inside bar or a whole parade of them, the frequency and the backdrop of the market add subtle clues that traders often rely on for a keener sense of what’s really going on.
| Pattern Variation | Description | Typical Implication | Example Scenario |
|---|---|---|---|
| Single Inside Bar | A bar that is fully tucked inside the range of the previous bar, like it is playing it safe. | Often hints at a brief breather in price action, with the potential for a breakout just around the corner. | Commonly pops up after moderate price moves, right before the trend laces up and takes off again. |
| Multiple Inside Bars | Two or more bars lined up one after another, each snugly contained within a single mother bar. | Typically reflects the market’s hesitation, like it’s holding its breath, leading to tighter trading ranges. | Usually shows up during times when uncertainty hangs thick in the air or just shy of some big news drops. |
| Inside Bar After Trend Move | Pops up right after a strong move, whether the market’s sprinting up or diving down. | Might be the market’s way of saying it’s catching its breath or maybe even considering a change in direction. | Often spotted skulking near key resistance levels after a sharp climb, as if deciding the next move. |
| Inside Bar Within Consolidation | Happens smack dab inside a broader sideways trading range. | Highlights ongoing range-bound action, setting the stage for what could be a breakout waiting in the wings. | Typically seen in markets that have been meandering sideways for days or even weeks, like they just can’t make up their minds. |
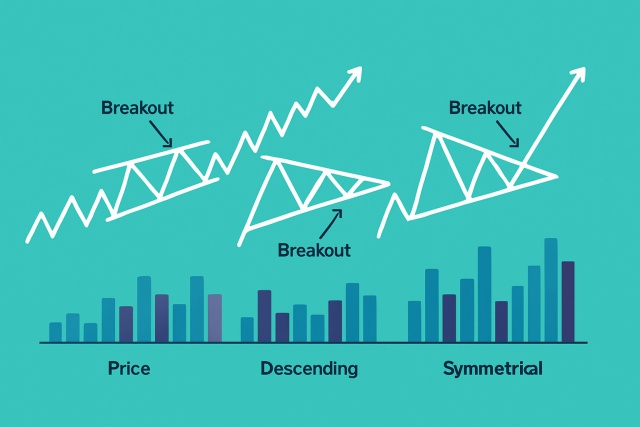
Traders often lean on inside bar patterns as handy signals for breakouts, keeping a close eye on when the price decides to slip beyond the mother bar’s range.
Size up the overall trend or market vibe to ensure your trade is riding the main momentum wave and not going against the tide.
Keep an eye out for inside bar patterns popping up near key support or resistance zones because these setups often increase the odds of a solid breakout.
When it’s time to pull the trigger, place your entry orders just beyond the mother bar’s high for bullish signals or just under its low for bearish breaks. Think of it as stepping just over the threshold.
Keep your downside in check by tucking your stop-loss orders safely below or above the opposite side of the mother bar. It’s your safety net when things don’t go as planned.
Lean on volume and momentum indicators since they’re your best friends for sizing up the breakout’s muscle and giving your trading plan a green light.
Inside bars often hint at potential reversals, especially when they show up near trend extremes or key technical levels. It’s vital to read these signals with a careful eye and look for confirmation from other indicators.
To sharpen your reversal predictions it’s a good idea to blend inside bar observations with trusty indicators like RSI which helps you catch when things might be overbought or oversold. Then there’s MACD which is great for sniffing out shifts in momentum.
Successful trading with inside bars calls for careful risk management like thoughtfully placing stops and sizing positions sensibly. You should also double-check the bigger picture.
Inside bars can be quite effective, though their reliability is often a bit misunderstood. Not every inside bar leads to a breakout or reversal, and you can’t simply judge the strength of what’s coming next by its size or how often it pops up.
Platforms like TradingView offer user-friendly interactive charts that make spotting the inside bar pattern easier and let traders experiment with different technical indicators. Binance improves on this by offering demo accounts with various trading options including spot and futures so you can safely test inside bar strategies without risking real cash. If you want automated tools and sharp pattern recognition, TrendSpider’s AI-powered features change how traders spot and analyze patterns.

Are you tired of juggling multiple tools for your trading needs? TradingView is the all-in-one platform that streamlines your analysis and decision-making.
With its powerful charting capabilities, real-time data, and vibrant community, TradingView empowers traders like you to stay ahead of the market. Join thousands who trust TradingView for their trading success.

With 20 years experience in commodity trading, Jasper provides insights into energy markets, precious metals, and agricultural futures with a focus on macroeconomic trends.
Read PostsDiscover the wedge falling pattern's secrets and learn step-by-step how to trade this powerful techn...
Discover how pattern triangles help traders predict price movements. This guide breaks down triangle...

Master the momentum indicator to gauge price speed and trend strength. This ultimate guide covers ca...

Discover how to recognize the evening star candlestick pattern—a powerful signal highlighting potent...