IAO Alliance
  • Trade Insights
    • Technical Analysis
    • Financial Analysis
  • Trading Strategies
    • Swing Trading
  • Toolkit
    • Data Advantage
    • Charting Software
  • Markets
    • Options Strategies
    • Foreign Exchange
  • Risk Management
  • Knowledge Base
    • Tutorials
  • Products
    • TradingView
    • TrendSpider
  • Brokerages

Bearish Harami Candlestick Pattern Signals You Should Watch

Bearish Harami Candlestick Pattern Signals You Should Watch

The bearish harami candlestick pattern is a key signal in technical analysis that many traders watch as a hint of a potential trend reversal. It typically appears after prices rise, suggesting the buying frenzy might be losing steam and sellers could be gearing up to take control. Catching this pattern early can give traders a leg up and help them make wiser decisions, manage risk effectively, and capitalize on new downtrends before big drops show up.

What Does a Bearish Harami Candlestick Pattern Indicate? Well, in the world of trading, this pattern often signals a potential shift in momentum—like a subtle whisper that the bulls might be running out of steam. It’s a cautionary flag that the current upward trend could be losing its punch, hinting at a possible reversal. Traders keep a close eye on it, as it might just mean the bears are gearing up to take the reins, even if things have not turned sour just yet.

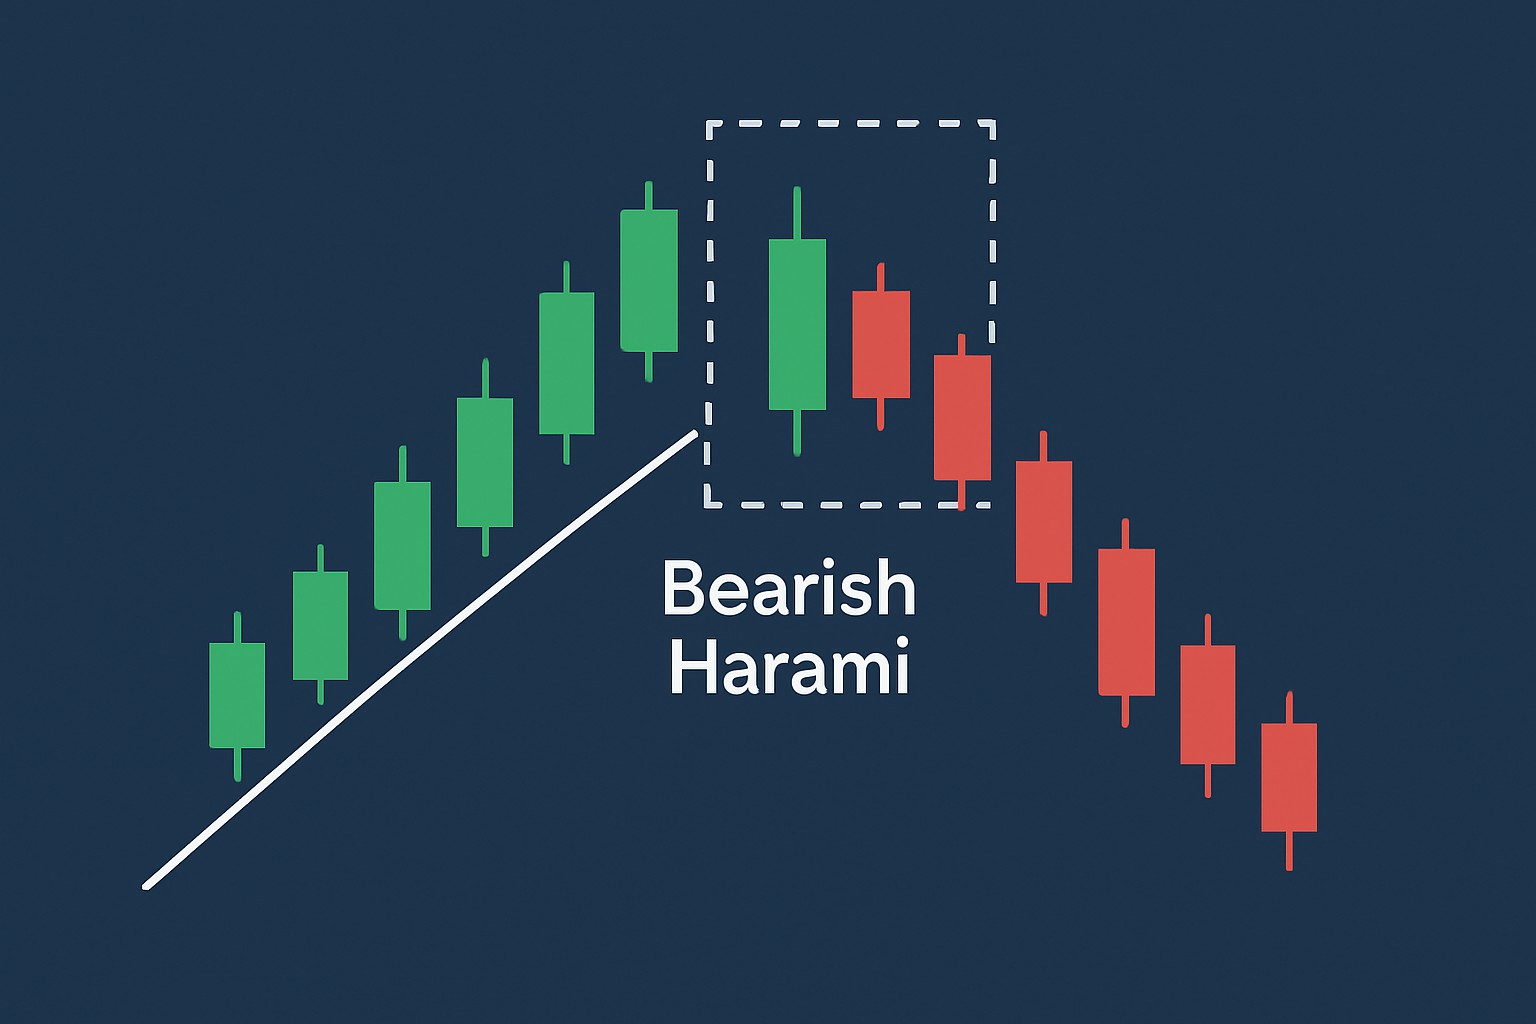
A bearish harami pattern shows up on price charts as two candlesticks. First, a large bullish candle is followed by a smaller bearish candle that nestles entirely within the body of the first. It’s like the buyers are pausing for a moment and catching their breath while the sellers might be gearing up behind the scenes.

  • The pattern consists of two candles: a big strong bullish candle that makes a statement followed by a smaller bearish candle that slips in.
  • The body of the second candle nestles completely within the range of the first candle's body like it’s staying within the lines.
  • This pattern often appears after an uptrend or near a market peak and gives a subtle nudge toward a possible reversal.
  • The smaller bearish candle hints that the buying momentum is losing steam and selling pressure is chipping away at the gains.

A Quick and Friendly Guide to Making Sense of Candlestick Patterns

Candlestick charts have become a go-to for many when visualizing asset prices because each “candle” tells a story of the opening, closing, high and low prices over a specific time frame. The body captures the gap between the open and close while thin wicks mark the price extremes.

Spotting a Bearish Harami Pattern in Charts with a Handy Tip for Traders

Spot a bearish harami by keeping an eye out for an uptrend followed by a big bullish candle that really drives home the buying pressure. Next, look for a smaller bearish candle that snugly fits within the real body of that previous candle—this often hints at a bit of market hesitation. It’s worth checking out different timeframes too, since this pattern can play out quite differently on intraday charts compared to daily ones. Also, watch out for the usual market noise that can sometimes muddy the waters.

Visual example of a bearish harami candlestick pattern showing the two key candles and their relationship on price chart

Visual example of a bearish harami candlestick pattern showing the two key candles and their relationship on price chart

  • Spot a strong bullish candle that clearly signals serious upward momentum.
  • Notice the second candle turning bearish and smaller in size.
  • Check that this smaller candle's body fits neatly within the range of the first larger candle's body.
  • Ensure this pattern appears near recent market highs or just after an uptrend since those are the ideal spots.
  • Watch for lower trading volume or some hesitation as the second candle forms because it is an extra sign that the setup could be valid.

What the Bearish Harami Pattern Really Tells You

The bearish harami suggests that the once robust buying momentum is beginning to lose steam, hinting at a possible change from an uptrend to a downtrend.

The bearish harami pattern often pops up when buyers seem to be losing their grip, hinting that sellers could soon step into the spotlight and nudge prices down a notch or two.

How the Bearish Harami Pattern Measures Up Against Other Similar Candlestick Patterns

Pattern NameDescriptionKey DifferencesTypical Signal Strength
Bearish HaramiA two-candle pattern where a smaller bearish candle cozies up inside a larger bullish candleThe second candle is noticeably smaller and tucked fully inside the first, hinting that the bullish momentum might be running out of steamModerate to strong
Bearish EngulfingThe second bearish candle completely swallows the first bullish candleThis bigger bearish candle really takes over, giving a clearer, bolder hint that the bears are stepping in with confidenceStrong
DojiA candle with almost no body that essentially screams 'I am undecided!'A lone candle where the open and close are practically neck and neck, signaling a market caught in a bit of a hesitation danceWeak to moderate
Evening StarA three-candle pattern that tells a story of reversal: starting with a big bullish candle, followed by a small uncertain one, then a hefty bearish candleMore intricate than the others, this pattern usually waves a stronger flag that a reversal is on the horizonStrong

Traders often confuse the bearish harami with patterns like the bearish engulfing or the evening star. Unlike those, the harami features a smaller second candle nestled within the first one and usually hints at a slower loss of momentum.

How Reliable Is the Bearish Harami Pattern Really

The bearish harami can be a useful heads-up for potential reversals though its reliability depends on the broader market context, volume confirmation and how well it aligns with the overall trend.

  • Keep an eye out for the pattern showing a noticeable spike in trading volume as the reversal tries to take hold because it is often a telltale sign.
  • Look for follow-up confirmation in the price action such as a lower close right after the pattern appears to back up the signal.
  • Consider how strong and long-lasting the current uptrend has been before putting too much faith in the pattern since context matters.
  • Check multiple timeframes to see if the bearish harami stands its ground across the board.
  • Pair this with other tools like RSI or MACD to get a clearer picture of momentum shifts since one indicator rarely tells the whole story.

How to Make the Bearish Harami Pattern Work for You in Trading

Traders often lean on the bearish harami pattern as a handy signal, especially when they patiently wait for confirmation before diving into short positions. They tend to set their stop losses with care and manage their risk by picking targets anchored to support and resistance levels. Pairing this pattern with charting tools like TradingView can really sharpen analysis and give a better sense of when to make the move

1

Keep an eye out for a clear bearish harami pattern on whatever timeframe you happen to be watching—it’s like spotting a subtle warning flag waving in the distance.

2

Don’t just take it at face value. Look for solid confirmation with higher volume or momentum indicators such as RSI or MACD to support your hunch.

3

When a confirming bearish candle closes firmly below the pattern, that’s your green light to enter a short position because timing really is everything here.

4

Place a stop-loss just above the high of the first bullish candle to prevent losses from sneaking up on you.

5

Plan your exit strategy by setting profit targets near key support levels or previous lows so you avoid being that trader who holds on a little too long.

Common Mistakes and Misconceptions to Watch Out For (So You Don’t Trip Up)

Common slip-ups with the bearish harami candlestick pattern come from ignoring the bigger trend and leaning too heavily on the formation alone without any backup signals. It is also often confused with look-alike candlestick formations.

  • Jumping into trades without a clear confirming signal or solid follow-through in the price can really trip you up.
  • Overlooking trading volume as a key piece of evidence to back up a reversal idea has tripped many traders.
  • Confusing the bearish harami with other patterns like bearish engulfing or Doji happens more often than you would think.
  • Turning a blind eye to the broader market context and important fundamental news that might overshadow technical signals is a classic rookie mistake.
  • Putting all your faith in the pattern to guarantee a reversal while skipping proper risk controls is a recipe for trouble.

Summary Key Takeaways You Should Know About the Bearish Harami Candlestick Pattern

FAQs

How do I confirm a bearish harami pattern is not a false signal?

To dodge false signals it is best to wait for confirmation like a bearish candle closing below the harami’s second candle or a noticeable surge in selling volume. I have found it pays off to pair the pattern with momentum indicators such as RSI divergence or trendlines to support the reversal story. And do not forget to keep an eye on the broader market backdrop because sometimes news or events can sweep away even the clearest technical signs.

Can the bearish harami pattern work on any timeframe?

Absolutely but its reliability can vary. On shorter frames like 1-hour charts you might spot the pattern often but expect more noise and false alarms. Daily or weekly charts tend to provide stronger, more trustworthy signals. My advice? Always cross-check with higher timeframes to better gauge the trend’s strength and avoid false positives.

What’s the difference between a bearish harami and a bearish engulfing pattern?

In a nutshell, a bearish harami shows a smaller second candle fitting within the body of the first which hints at subtle market hesitation. On the flip side, a bearish engulfing has a bigger second candle that completely swallows the first — a clear sign of stronger selling pressure. Think of the harami as the market tapping the brakes while the engulfing means it’s slamming on them.

Should I exit my long position immediately after spotting a bearish harami?

Not so fast. Treat the bearish harami more like a yellow traffic light than a red one—caution is key. It pays to wait for confirmation such as a lower close or a dip below support levels. You might want to tighten your stop-losses or hedge your bets but don’t bolt out the door if the uptrend still looks sturdy or volume doesn’t support the reversal.

How can I combine the bearish harami with other indicators for better accuracy?

Try teaming it up with indicators like RSI to spot overbought conditions, MACD showing a bearish crossover or moving averages as price dips below critical levels. Volume shouldn’t be overlooked— a drop in volume during the harami often adds credibility. Plus, watching support and resistance levels can highlight probable reversal zones.

Is the bearish harami more reliable in certain markets (stocks, forex, crypto)?

The pattern works across different markets but shines brightest in trending environments. Forex and crypto are known for their wild rides and high volatility which tend to increase false signals. Stocks usually offer clearer setups due to steadier trends. It’s smart to tailor your approach based on the asset’s typical price action and backtest the pattern in your chosen market if you have time.

Unlock Your Trading Potential with Edgewonk

Struggling to improve your trading performance? Edgewonk's advanced analytics tools are designed to give you the edge you need.

With detailed trade journaling, robust strategy analysis, and psychological insights, you'll gain a comprehensive understanding of your strengths and weaknesses. Don't miss out on this game-changing opportunity.

Elevate Your Trading
Advertisement

Unlock Trading Mastery with Edgewonk

Traders, it's time to elevate your game. Edgewonk is the ultimate trading journal software designed to empower you with data-driven insights and personalized strategies. Take control of your trading journey and maximize your potential.

  • Analyze trades with precision
  • Optimize risk management tactics
  • Gain valuable psychology insights
Discover Edgewonk Now
Edgewonk + IAO Alliance
Edgewonk
Ad
Binance + IAO Alliance
Binance
Ad
Freya Hartwell

Freya Hartwell

15 articles published

Known for demystifying complex derivatives trading through accessible education, this former Wall Street trader turned educator empowers retail investors with institutional-level strategies.

Read Posts
Edgewonk + IAO Alliance
Edgewonk
Ad

Trending Now

What Is TradingView and Why Traders Use It?
TradingView • 2 days ago
Binance + IAO Alliance
Binance
Ad

Trade Insights

  • Technical Analysis
  • Financial Analysis

Trading Strategies

  • Swing Trading

Toolkit

  • Data Advantage
  • Charting Software

Markets

  • Options Strategies
  • Foreign Exchange
IAO Alliance © 2025