


Technical Analysis
Using The True Range Indicator To Spot Price Swings
Learn how the True Range indicator captures market volatility and price swings, empowering traders t...
Getting to grips with chart patterns and technical indicators is a must for anyone diving into trading or investing. Among the many tools in the toolbox, the trend line stands out as one of the simplest yet most valuable concepts in technical analysis. It lets traders and investors connect the dots—literally—by linking key price points on a chart to reveal the market’s general direction. Trend lines offer handy clues about the strength and trajectory of price movements, making the often confusing flood of market data a bit easier to navigate and respond to.
This article dives into what a trend line really is and why it matters. Traders often lean on it to steer their trading decisions. We’ll kick things off with the basics and then slowly unravel different types of trend lines. You will find handy tips on drawing them right, common pitfalls to avoid and some nifty advanced tricks.
A trend line is basically a straight line drawn right on a price chart that links two or more key price points. It’s like your go-to visual compass giving you a general sense of where an asset’s price is headed over a particular stretch of time.
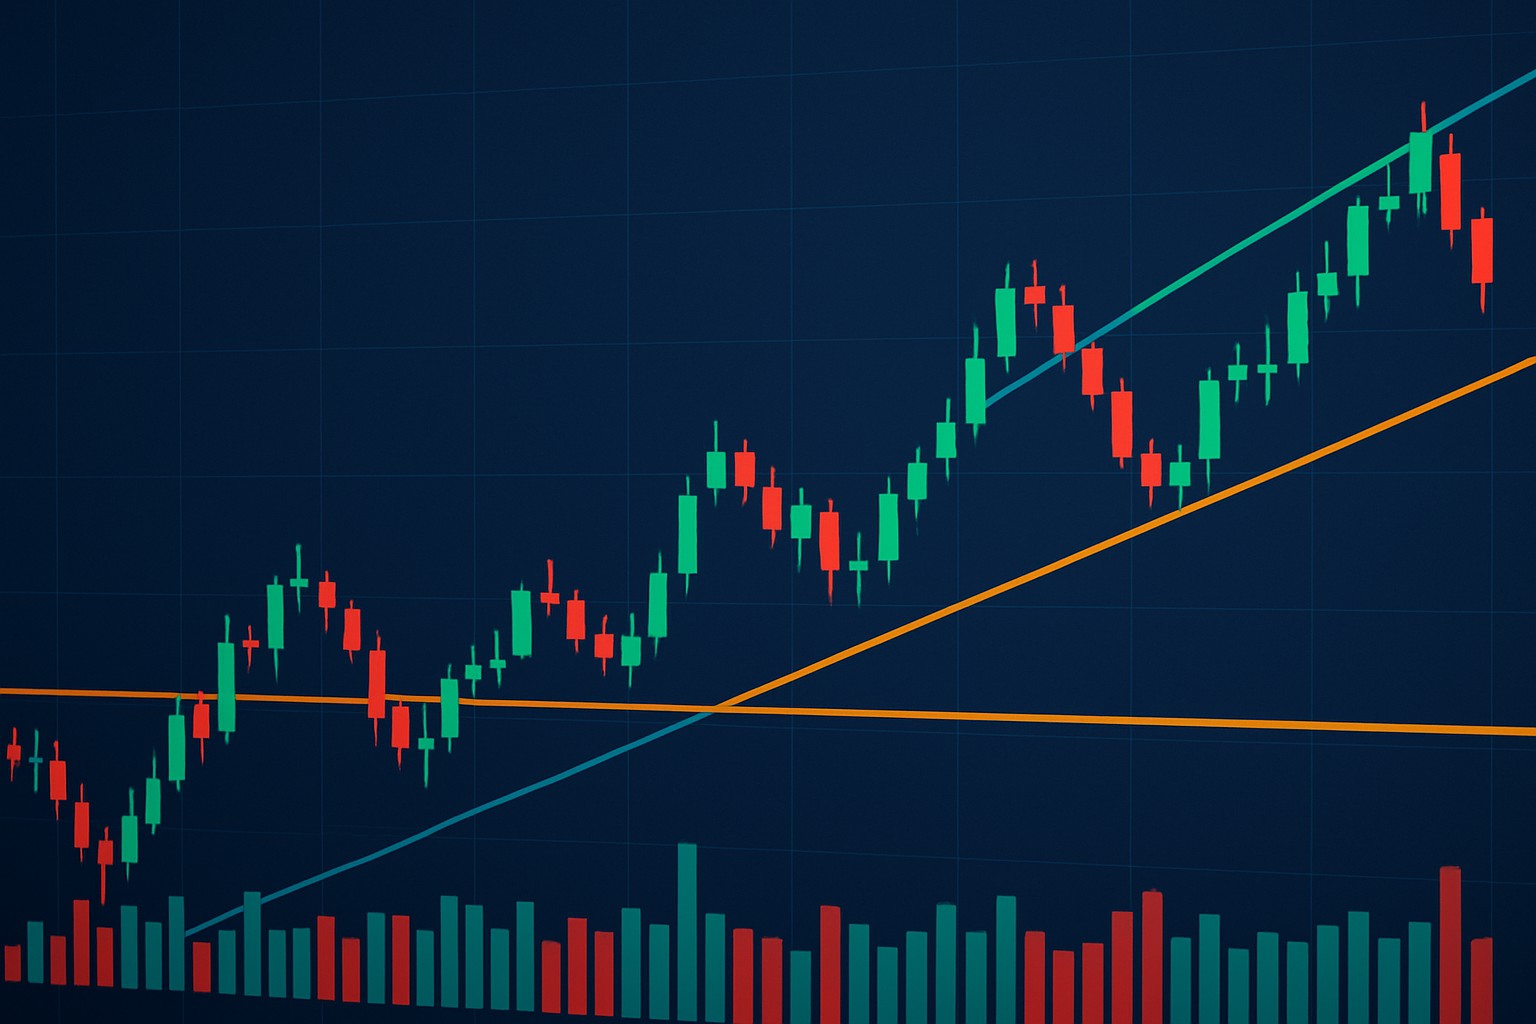
Trend lines usually act as trusty and flexible support or resistance zones where prices like to bounce. When you’re looking at an uptrend, the trend line typically hangs below the price and steps up as a support level where buyers often jump in. Flip the script to a downtrend and you’ll find the trend line above the price, playing the role of resistance where selling pressure tends to pile on. Catching these levels is a handy way for traders to gauge market mood and get a sneak peek at how prices might behave.
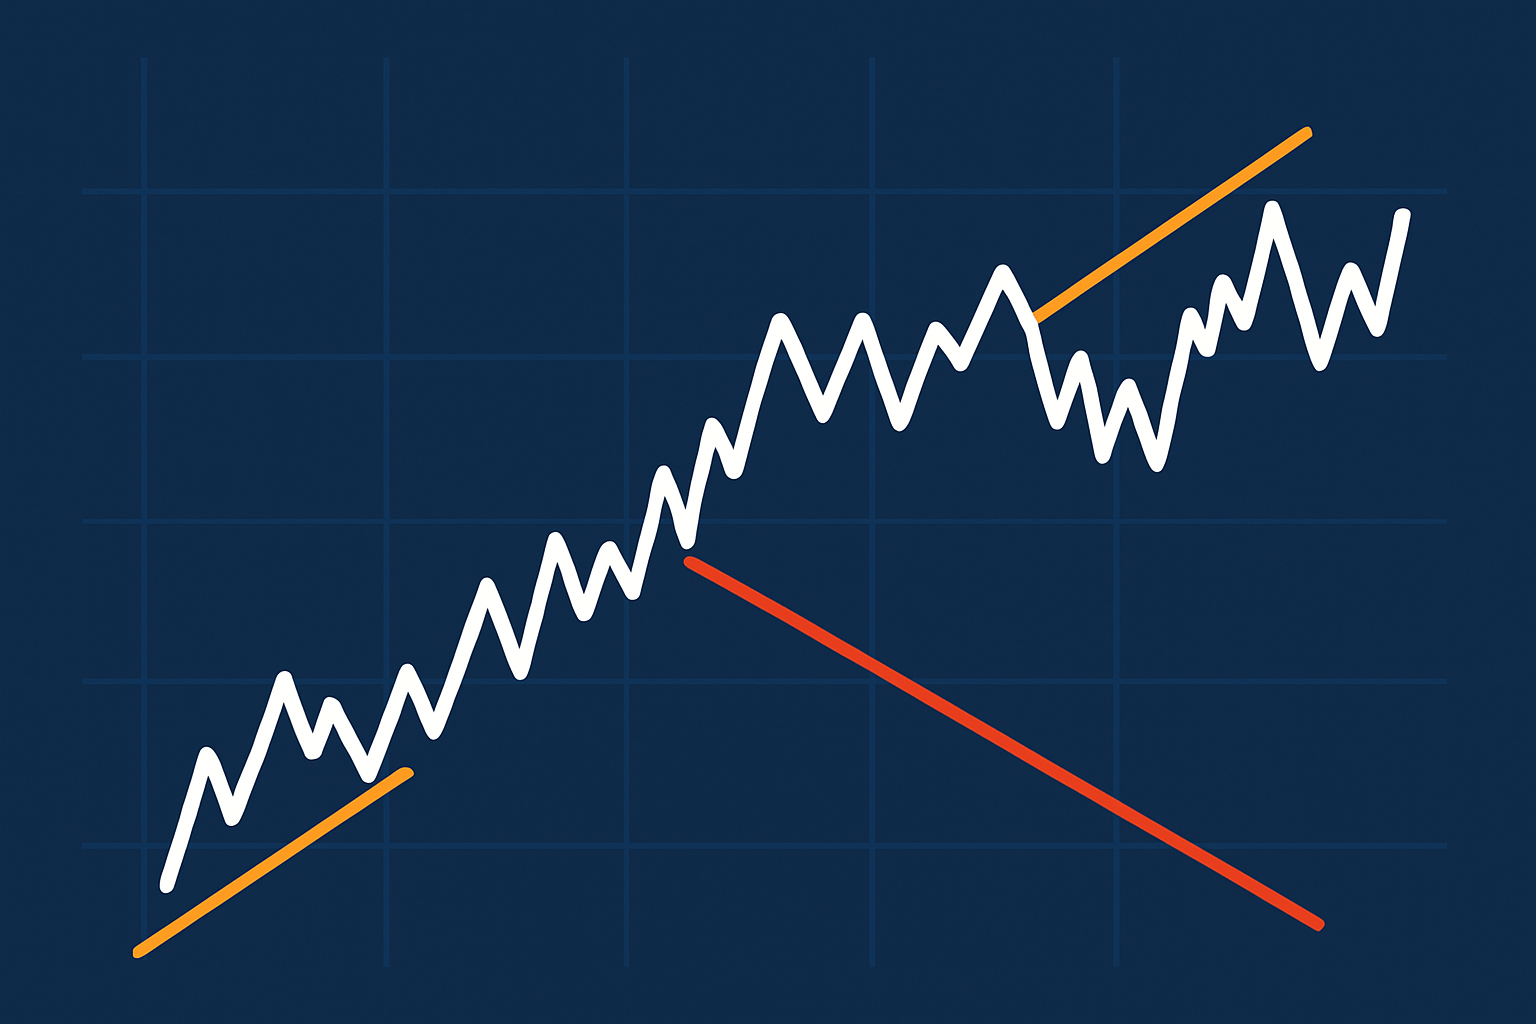
Example of an uptrend and downtrend line on a price chart, illustrating support and resistance roles.
Drawing a trend line isn’t just about connecting two random dots on a chart. It’s more like spotting at least two clear and meaningful price points, usually swing lows in an uptrend or swing highs during a downtrend. Getting it right with precision and consistency goes a long way in making sure your trend line actually stays relevant and genuinely mirrors what the market’s up to.
Pinpoint those key swing highs or lows that really matter—think of the ones that show meaningful price reactions, not just the tiny wiggles up and down that can easily throw you off.
Draw a straight line connecting at least two of these significant points to clearly highlight the overall direction the price is taking. It’s like connecting the dots but with a purpose.
Extend this trend line forward as a way to get a rough idea of where the price might find some support or resistance down the road—kind of like plotting your course on a map.
Test the trend line’s reliability by checking if it also grazes other price points beyond the initial duo—this little trick boosts your confidence in how dependable that line really is.
Most traders usually lean on closing prices to draw trend lines instead of intraday highs or lows, mainly because the closing price tends to capture the market sentiment for that period a bit more faithfully. Depending on their style—say, day trading versus swing trading—some people might lean towards different price points.
Trend lines typically fall into one of three buckets: uptrend lines, downtrend lines and horizontal trend lines.
| Type of Trend Line | How to Draw | Market Signal | Trader Implication |
|---|---|---|---|
| Uptrend line | Connect the higher lows | Points to a bullish market vibe | Nudges you to buy or hold tight |
| Downtrend line | Connect the lower highs | Flags a bearish mood | A gentle hint to sell or maybe steer clear |
| Horizontal line | Connect equal highs or lows | Suggests the market’s on the fence | Keep an eye out for a breakout or breakdown – it’s showtime! |
Trend lines are pretty much the trader's trusty sidekick, helping spot likely support and resistance levels a whole lot faster. They make it easier to get a read on market momentum and to weigh up whether a trend is likely to keep cruising or take a sudden turn. By transforming complex price data into neat visual hints, traders often find themselves with a clearer picture of where prices might head next
Aligning trades with the established trend shown by these lines usually gives traders an advantage in spotting profitable opportunities. Trend lines aren’t just about direction. They also help with risk management by indicating potential exit points or signaling when the trend may be starting to fade.
Think of a trend line as your reliable companion on a winding mountain trail. It won’t spill the beans about what’s lurking just around the bend, but it sure keeps your footing steady and your direction locked in. Sometimes, that little bit of steady guidance is all you need to avoid tripping up.
Many beginners often fall into the trap of thinking trend lines can predict the market with absolute certainty. Spoiler alert: that’s not quite how it works. Trend lines are just one piece of the puzzle in technical analysis and typically shine brightest when paired with other indicators and the bigger market picture.
Staying disciplined by consistently checking trend lines and keeping a healthy dose of skepticism really helps traders avoid common slip-ups.
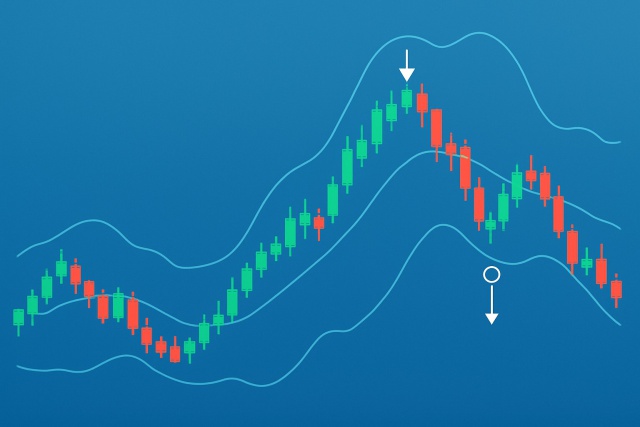
Trend lines do more than highlight trends—they're the unsung heroes traders lean on to find sweet spots for entry and exit. You will often find them helping to set stop-loss orders just below support or just above resistance lines, acting like a safety net. When you pair these lines with other technical tools the trading signals become stronger and more reliable.
These improved techniques give traders the edge they need to stay on their toes as market conditions shift helping them nail better timing and keep risk in check. Tools like TradingView bring a toolbox packed with sophisticated charting and indicator options, making it a breeze to draw up and test trend lines alongside other technical studies. For those who enjoy a bit of automation and pattern spotting, platforms such as TrendSpider step in with AI-powered features that catch and confirm trend line signals.
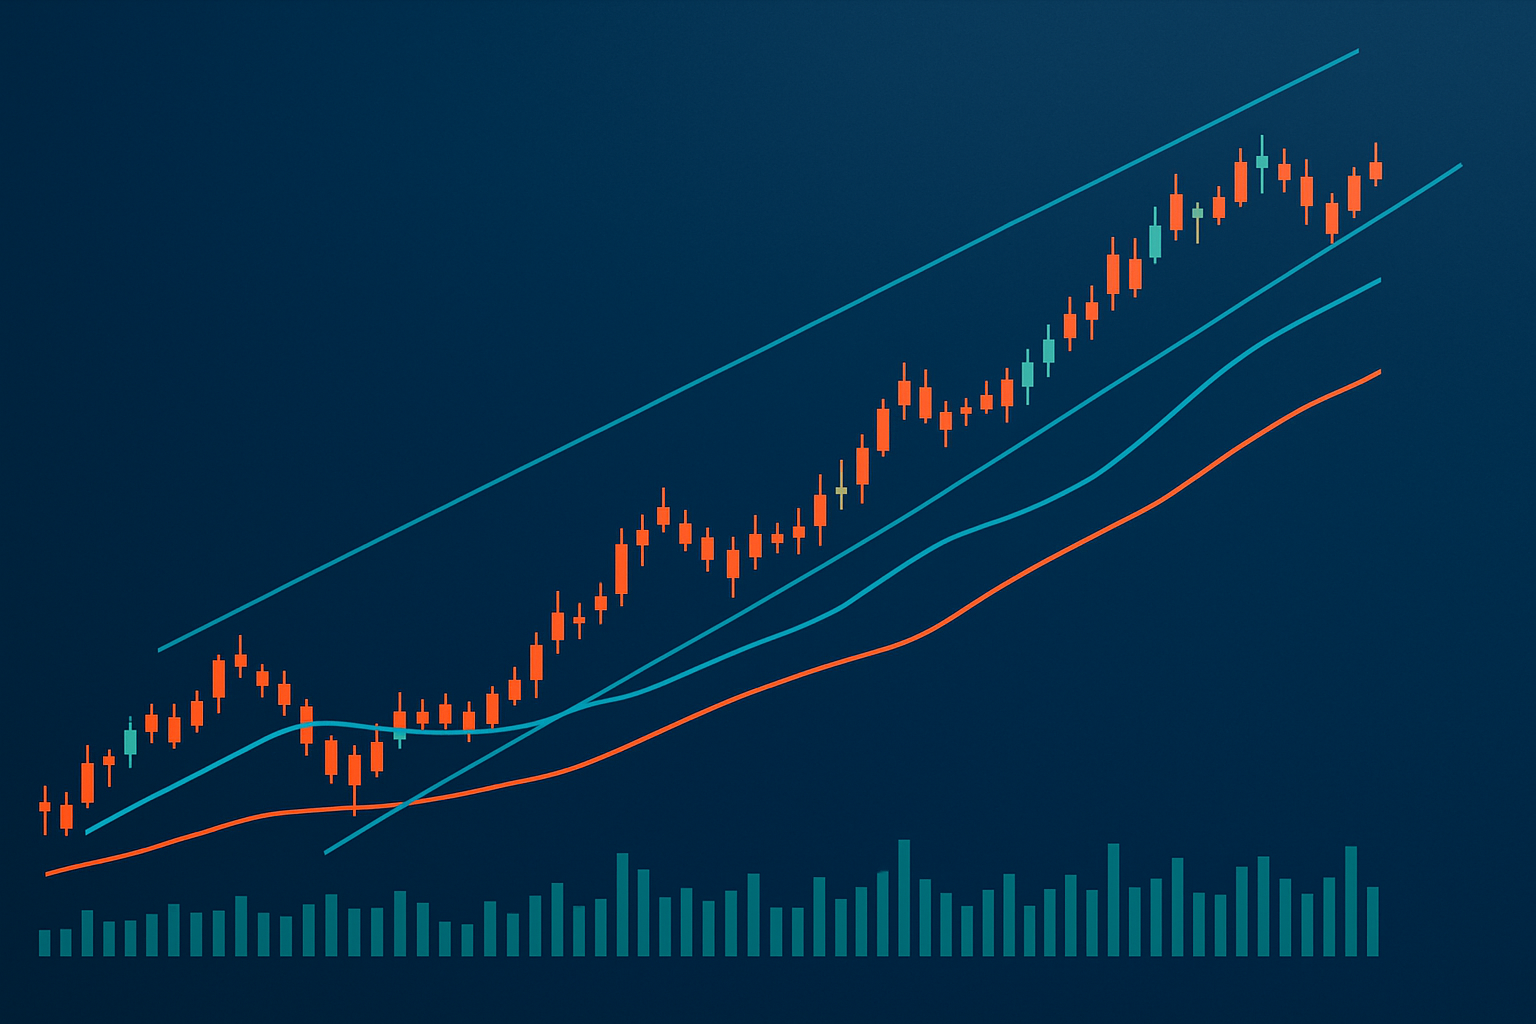
An advanced trading chart overlaying trend lines with moving averages and volume indicators demonstrating integrated analysis.
Learning to use trend lines requires a fair bit of patience and some steady, consistent practice. It really pays off to pick a reliable charting platform that doesn’t skimp on drawing tools and gives you plenty of historical data to dig through. Beginners often kick things off by working with past price charts, slowly getting the hang of spotting those swing highs and lows and sketching lines that link them together.
Pick reliable and user-friendly charting software like TradingView or TrendSpider. These tools offer advanced drawing features to make your life easier.
Choose a time frame that suits your trading style, whether you prefer the quick thrill of intraday, the steady pace of daily or a longer-term view that lets you breathe a bit.
Watch for clear swing highs and lows on your price chart since these are essential for identifying key points.
When drawing trend lines, take your time to connect those points accurately. Then extend them forward to see where the trends might head next.
Pay close attention to how prices react to your lines over time because this is the real test to see if your trend lines can hold up.
Keep your trend lines up to date by adjusting them as new price data comes in since staying current is half the battle.
When traders make a habit of using trend lines alongside other technical indicators while keeping a finger on their limitations, they often start developing a sharper intuition for reading the market. Over time, this approach helps them make trading decisions with a bit more confidence and a touch deeper insight.

Are you tired of juggling multiple tools for your trading needs? TradingView is the all-in-one platform that streamlines your analysis and decision-making.
With its powerful charting capabilities, real-time data, and vibrant community, TradingView empowers traders like you to stay ahead of the market. Join thousands who trust TradingView for their trading success.

Transforming the field of forex trading through his systematic approach to currency pair analysis, he focuses on macroeconomic indicators and central bank policy impacts.
Read PostsLearn how the True Range indicator captures market volatility and price swings, empowering traders t...

Master the momentum indicator to gauge price speed and trend strength. This ultimate guide covers ca...

Hidden bullish divergence is a key technical indicator revealing strong buying pressure beneath unce...
Master trading with Bollinger Bands by understanding volatility, setup patterns, and risk management...