


Technical Analysis
Recognizing an Evening Star Candlestick Pattern in Charts
Discover how to recognize the evening star candlestick pattern—a powerful signal highlighting potent...
Reversal patterns are a key piece of the puzzle in technical analysis, often flagging when a market trend is about to change course. We’ll break down some of the more common reversal patterns that traders lean on, offering clear and practical explanations.
It is really useful to get a clear picture of what reversal patterns actually are and why they hold such weight in trading. These patterns pop up when the current trend—whether it is climbing up or sliding down—starts to lose its mojo and might be gearing up to take a different route. Catching sight of these signals can hand traders some much-needed heads-up about the right moments to jump in or bow out, potentially saving a bundle or boosting gains.
Reversal patterns are often mistaken for continuation patterns, which usually indicate a brief pause before the trend resumes. The reliability of reversal patterns depends greatly on volume and timeframe. When the volume is strong, the pattern becomes more credible.
Recognizing a reversal pattern is more than just spotting a familiar shape on the chart. It means tuning into several vital details that lend the pattern real credibility. Think of specific candlestick formations, a confirmed breakout above or below key levels, important support and resistance zones, and noticeable shifts in trading volume.
Reversal patterns tend to pop up all over the place in various markets, each sporting its own distinctive shape and trading implication. Getting a good handle on the psychology behind these patterns can really give traders an edge when it comes to spotting shifts in supply and demand that flip a market from bullish to bearish, or vice versa.
A classic pattern that traders rely on to spot potential trend reversals. It’s like the financial world’s version of a red flag waving.
The mirror image hinting at possible bullish turnarounds. It’s the pattern that gives hope to the cautious.
A stubborn resistance level showing signs it might finally give way though it often likes to tease before dropping.
The market’s way of saying "I’ve hit the floor and bounce back is on the cards." Quite the little comeback story.
When prices try and fail three times to break through resistance, stubborn as a mule but telling a clear story.
Similar persistence on the downside hinting that the market’s ready to rally after testing the lows repeatedly.
A pattern that looks like a slow climb but often ends in a sneaky drop. It’s the financial equivalent of a wolf in sheep’s clothing.
The opposite suggesting the market might just be gearing up for an upward surprise. Like finding a silver lining after a storm.
Let's dive into the classic patterns of Head and Shoulders and its lesser-known sibling, the Inverse Head and Shoulders. These formations are pretty much the bread and butter for traders trying to spot trend reversals. The Head and Shoulders pattern often signals that an upward trend is about to take a bow and exit stage left, while the Inverse version is its mirror image, hinting that a downtrend might just be gearing up for a comeback. Understanding these can feel like having a secret decoder ring in the chaotic world of charts—once you spot them, you might just see the market's next move a little clearer.
The Head and Shoulders pattern typically appears right at the end of an uptrend and signals a bearish reversal. It has three peaks: the middle one, the head, is taller than the others and is flanked by two smaller peaks called the shoulders. The neckline connects the two dips between the peaks and acts as a key support level. When the price falls below this neckline, it often indicates that sellers are taking control. The inverse Head and Shoulders reverses this pattern and signals that a downtrend might be ending with a bullish reversal on the way.
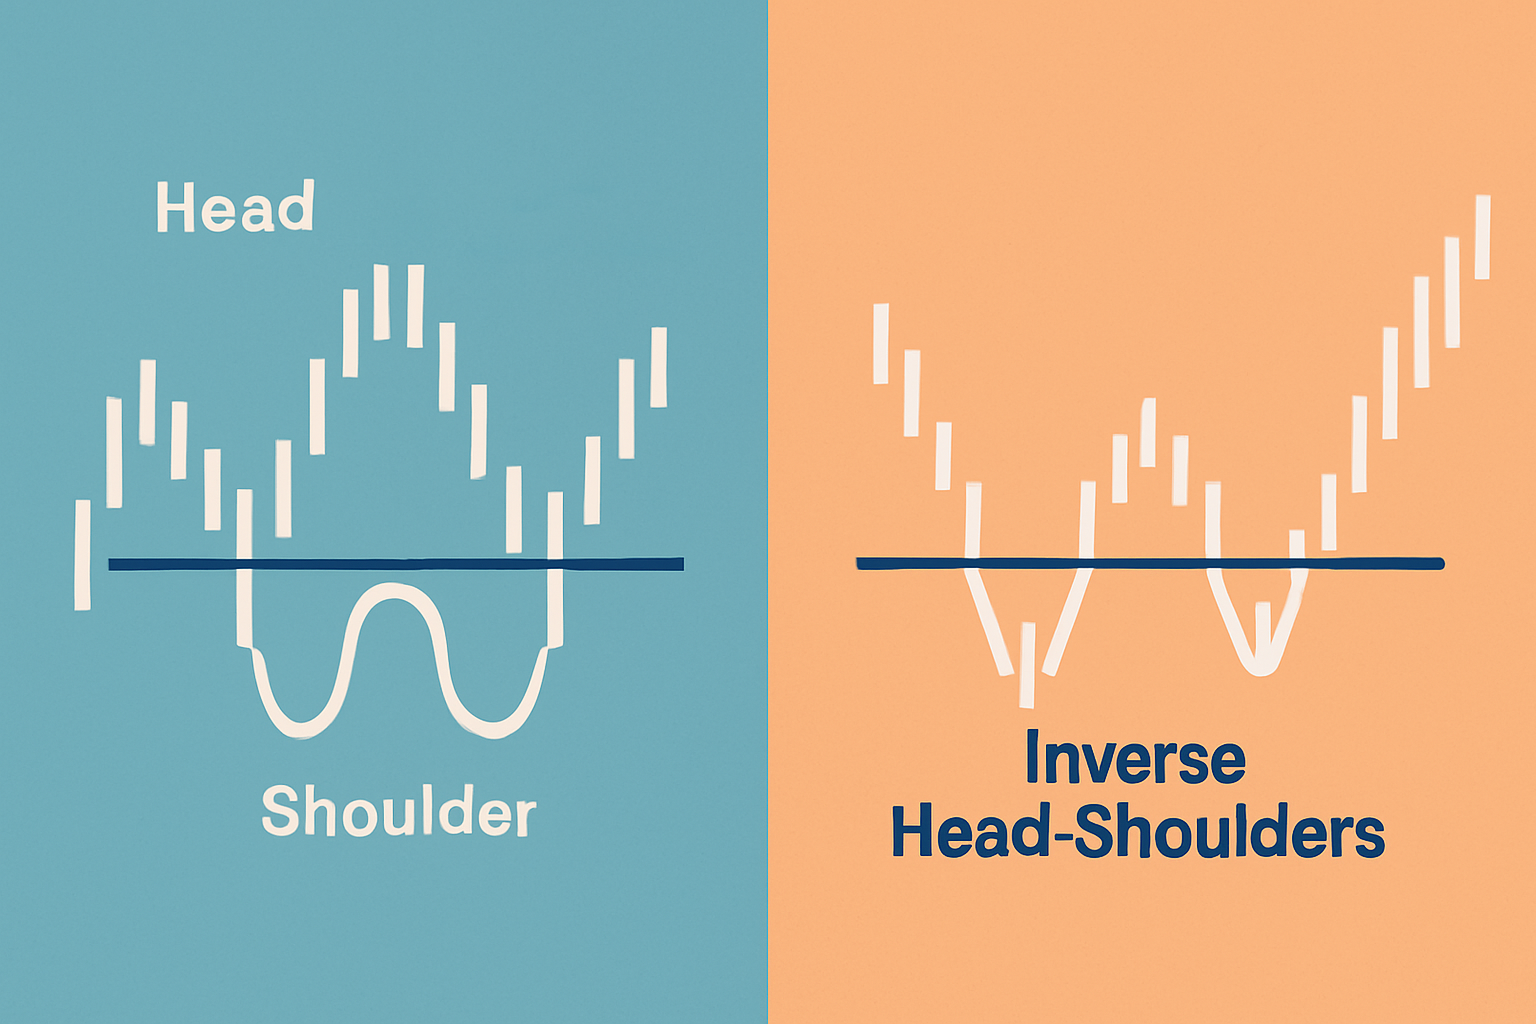
Visual representation of the Head and Shoulders and Inverse Head and Shoulders patterns highlighting key features and breakout points.
Double top and double bottom patterns often signal that a trend is losing its punch and might be gearing up for a reversal. A double top shows up when the price hits a high point twice but can’t break through, creating a stubborn resistance level. The shift downward usually happens once the price slips below the low between those two highs. On the flip side, a double bottom happens when the price bounces off a low twice without dropping further. This hints at solid support. This pattern is confirmed when the price pushes above the peak between those lows and gives traders a clearer signal. Most people keeping an eye on these patterns focus closely on the neckline or confirmation level for the perfect moment to jump in or out.
Triple tops and bottoms take the idea of double tops and bottoms a step further by adding an extra peak or trough, which usually makes the reversal signal a bit more reliable. When a price keeps struggling to break through a resistance or support level, it’s often a sign that the current trend is running out of steam. Traders should still watch out for sneaky false breakouts since these patterns can pop up during long stretches of sideways action.
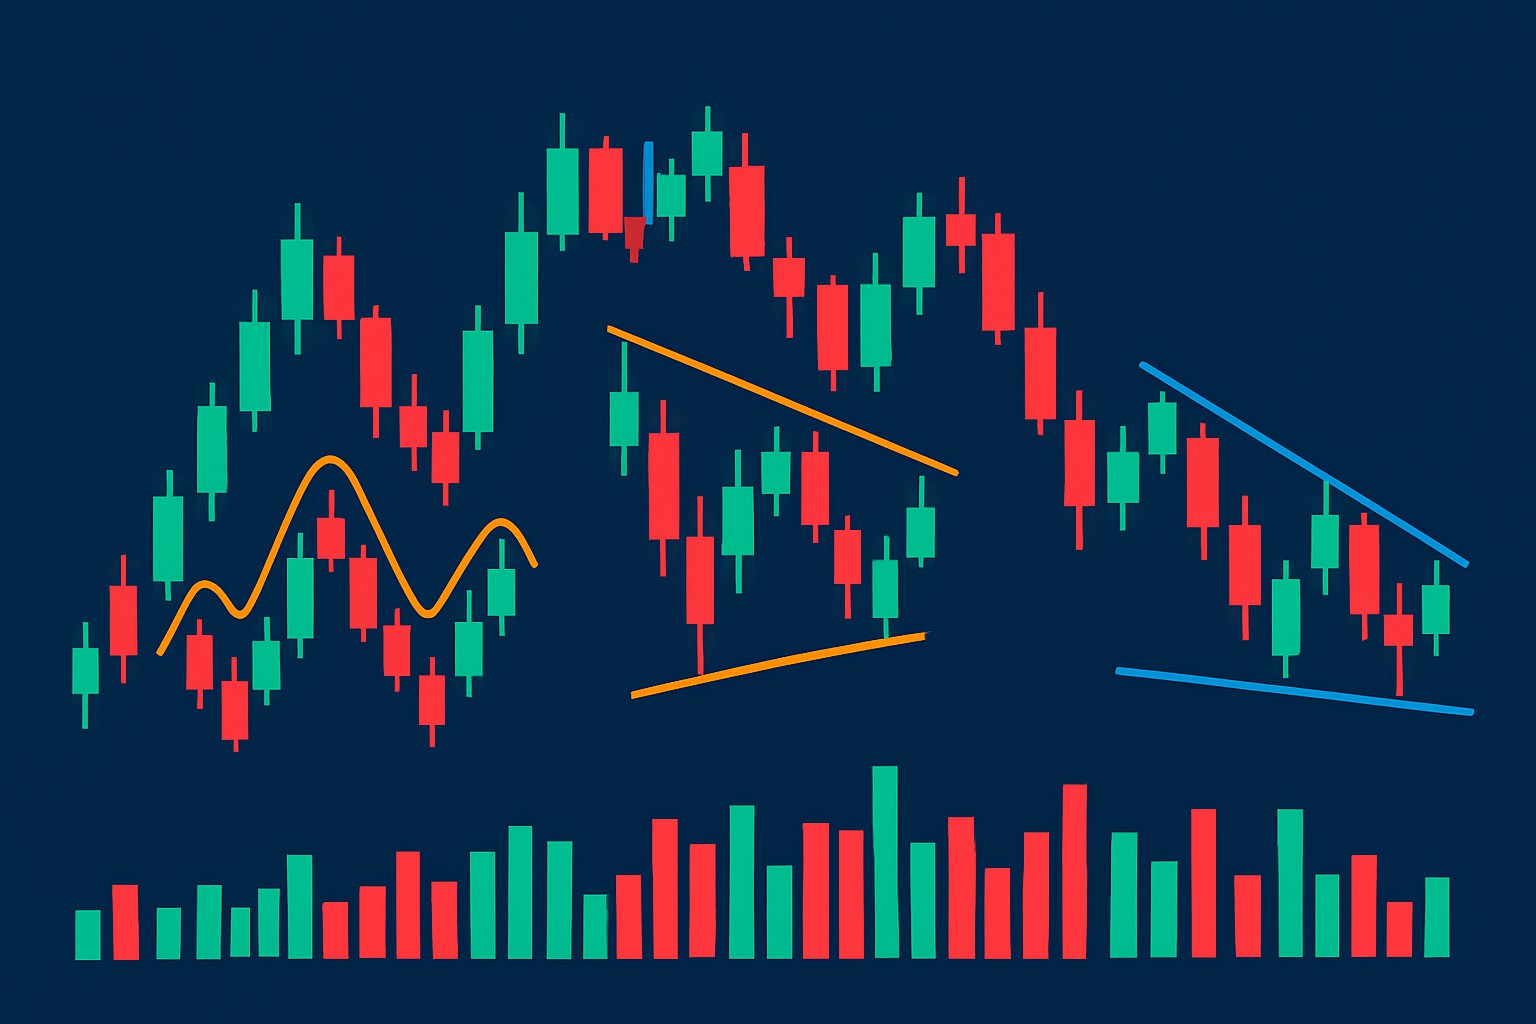
Rising and falling wedges are patterns that hint at either a continuation or a reversal. They are marked by trend lines that slope up in a rising wedge or down in a falling wedge and come together. They suggest momentum is dwindling even though prices keep moving along—kind of like running on fumes. A rising wedge usually shows up during an uptrend and often foreshadows a bearish turn. A falling wedge can point to a bullish reversal in the middle of a downtrend. The real clincher is a breakout through the wedge’s support or resistance, ideally with a noticeable spike in volume. Waiting for both the breakout and a retest before jumping into a trade tends to pay off more reliably.
| Pattern Name | Visual Features | Trend Direction Before Pattern | Typical Volume Behavior | Confirmation Signal | Trading Implication |
|---|---|---|---|---|---|
| Head and Shoulders | Three peaks where the middle one (head) takes the crown as the highest | Uptrend | Volume tends to pick up on the right shoulder and really shows up at the breakout | Price slips below the neckline | Usually signals a bearish reversal, making shorts look pretty appealing |
| Inverse Head and Shoulders | Three troughs with the middle trough digging the deepest hole | Downtrend | Volume often ramps up at the breakout | Price pops above the neckline | Points to a bullish reversal, lending a hand to long positions |
| Double Top | Two peaks standing shoulder to shoulder at nearly the same level | Uptrend | Volume typically fades on the second peak, then throws a party when breakdown happens | Price breaks the support sitting between those peaks | Tells you a bearish reversal is likely on the cards |
| Double Bottom | Two troughs roughly holding hands at the same low point | Downtrend | Volume tends to surge as the breakout gets underway | Price breaks above resistance nestled between troughs | A nudge towards a bullish reversal |
| Triple Top | Three peaks knocking on the same resistance door | Uptrend | Volume often takes a nap with each new peak, winding down nicely | Price drops below the support line | Marks a firm bearish reversal, ready to shake things up |
| Triple Bottom | Three troughs hanging out near the same support level | Downtrend | Volume likes to perk up at the breakout | Price climbs above the resistance level | Signals a robust bullish reversal, no messing around |
| Rising Wedge | Upward sloping trend lines slowly inching closer and closer | Uptrend (reversal) or downtrend (continuation) | Volume generally shrinks as this pattern cozies up | Price falls below the lower trend line | Could be waving a flag for bearish reversal or continuation, so keep your eyes peeled |
| Falling Wedge | Downward sloping trend lines drawing nearer like two old friends | Downtrend (reversal) or uptrend (continuation) | Volume often contracts while the pattern unfolds | Price breaks above the upper trend line | Suggests a bullish reversal or continuation, often bringing some much-needed relief |
Navigating reversal patterns can feel like trying to catch lightning in a bottle, but with a little patience and savvy, it’s definitely doable. Don’t just rush in headfirst—it's often the subtle signs that give away when the market's about to flip its script. Remember, spotting these patterns early can save you from a lot of headaches down the line. So, buckle up, stay sharp, and keep your cool—because success here favors the prepared and the patient.
Trading reversal patterns well really calls for patience, discipline and a rock-solid plan. I’ve found it’s best to hold your horses and wait for the pattern to fully take shape and confirm at those important breakout levels before jumping into a trade. Volume is often the unsung hero here helping you gauge how powerful that reversal might be. When managing risk, setting stop-loss orders just beyond key support or resistance zones is a smart move to keep losses in check if the pattern throws you a curveball. Profit targets usually tie back to the pattern’s height or the swing of the previous trend and give you a handy reference point.
"Patience and double-checking those signals really are the trader's best friends when it comes to reversal patterns. Jumping the gun tends to bite you in the wallet more often than not, while hanging tight for those clear confirmations usually stacks the odds in your favor quite nicely." – Experienced Technical Analyst
Traders often stumble over reversal patterns because impatience gets the better of them or they have not quite wrapped their heads around the details. Common slip-ups include diving into trades before the setup gives a clear thumbs-up, obsessing over the pattern's shape while ignoring volume, confusing reversal patterns with continuation ones and giving too much weight to small or flimsy setups. Ignoring the bigger market picture is another classic blunder that can lead to misreading patterns and usually means losses or missed opportunities.
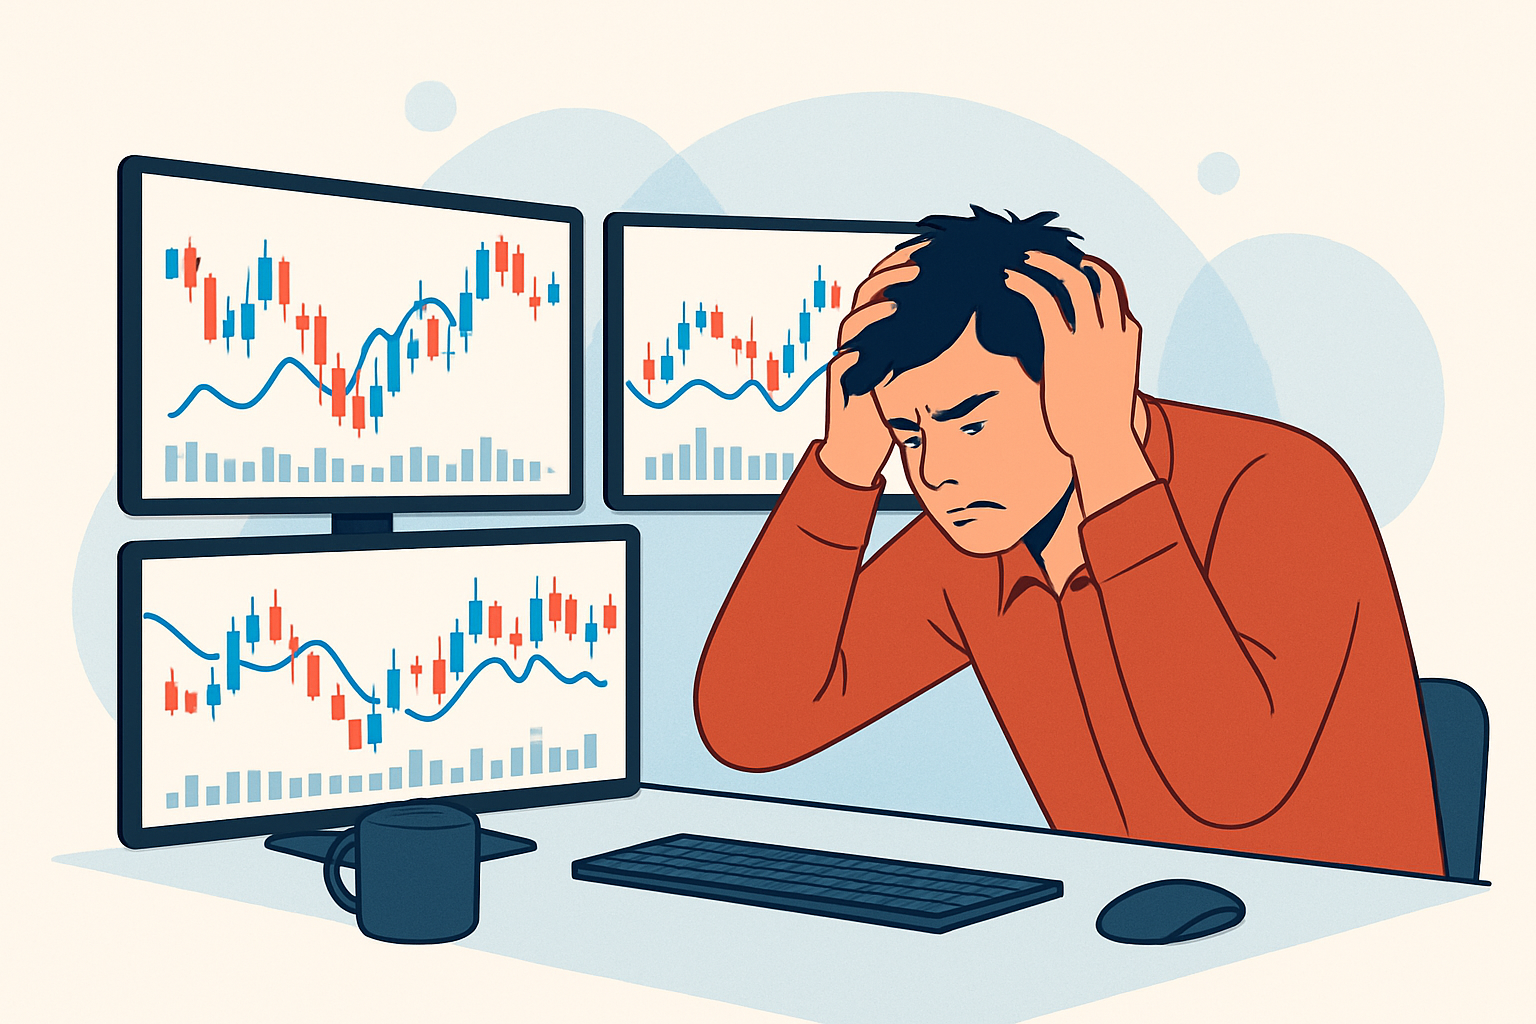
Visual depiction of common trading pitfalls such as premature entries, ignoring volume, and confusion between pattern types.

Tired of missing opportunities and making suboptimal trading decisions? TrendSpider's cutting-edge platform automates complex technical analysis, saving you time and reducing human error.
With multi-timeframe analysis, dynamic alerts, backtesting, and customizable charting, you'll gain a competitive edge in identifying trends and making informed trades across global markets.

Driven by a passion for democratizing trading knowledge, she focuses on behavioral finance and psychological aspects of market decision-making.
Read PostsDiscover how to recognize the evening star candlestick pattern—a powerful signal highlighting potent...

Discover how inside bar patterns signal key market pauses and possible breakouts or reversals. This...
Trend lines are essential tools in technical analysis that help traders identify market direction an...

Master the momentum indicator to gauge price speed and trend strength. This ultimate guide covers ca...