

Technical Analysis
What Is a Trend Line in Technical Analysis?
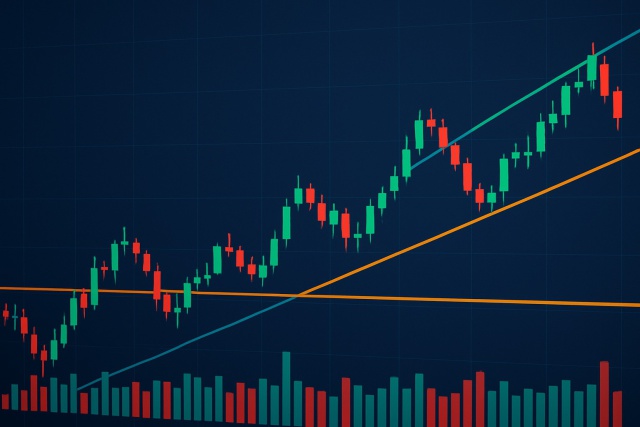
Trend lines are essential tools in technical analysis that help traders identify market direction an...
Candlestick charting is a cornerstone of technical analysis, offering traders a neat visual snapshot of how prices dance over a set period. Among the many candlestick shapes out there, the doji candlestick pattern really stands out with its unmistakable form and the juicy clues it often drops about market mood. Catching a doji can be like spotting a little flicker of hesitation between buyers and sellers, usually signaling that a trend might be taking a breather or turning on a dime.
A doji candlestick pattern pops up when the opening and closing prices are pretty much neck and neck, resulting in a tiny or almost invisible body. It’s like the market can’t make up its mind—the price might have danced around during the session, but buyers and sellers ended up in a stalemate.
A doji is like two people locked in a tug-of-war, each pulling just as hard on opposite ends of a rope and leaving the poor thing totally still. This back-and-forth tugging hints at market uncertainty or a brief pause before things might swing one way or the other.
Doji candlesticks don’t all wear the same hat. Their subtle quirks in shape and shadow length offer traders a variety of hints to mull over. Whether it’s where those shadows decide to hang out or how far they stretch away from the body, these little differences can whisper different market moods and potential signals
| Doji Type | Appearance Description | Typical Market Implication | Common Occurrence Context |
|---|---|---|---|
| Standard Doji | Tiny body with upper and lower shadows roughly equal in length | Often points to a market caught in a bit of a limbo, unsure where to head next | Usually pops up during sideways trading, when the market’s just catching its breath |
| Dragonfly Doji | Noticeably long lower shadow with little to no upper shadow | Often seen as a hopeful sign, hinting at a possible bullish turn or a testing of support levels | Commonly strikes after a downtrend, like a quiet pause before a potential bounce |
| Gravestone Doji | Long upper shadow paired with almost no lower shadow | Can be a warning flare for a bearish reversal or a level where sellers step in firmly | Typically found near price peaks or climbing markets, where the bulls might be losing steam |
| Long-legged Doji | Exceptionally long shadows both above and below a minuscule body | Signals serious indecision and hints at high volatility, like a tug-of-war between buyers and sellers | Seen at market tops, bottoms, or key turning points, where nothing’s quite set in stone yet |
Each kind of doji brings its own message from the market's messy mood. The Dragonfly Doji often hints that the bulls might be gearing up and nudging prices to bounce back after a selloff. Meanwhile, the Gravestone Doji flashes a caution light, suggesting the bears could be ready to take the reins. This might mean a dip after a stretch of upward momentum.

Visual illustration comparing the shapes of different doji candlestick types
Identifying a doji starts with closely examining the candlestick's bodies and shadows. There is nothing tricky here, just good old-fashioned observation. Traders should pay attention to more than just the size of the body because those tiny details often have the biggest impact. It is also important to consider the surrounding price action and the larger trend to fully understand what the doji is signaling.
Take a good look to see if the candle’s open and close prices are nearly identical. This results in a tiny or even nonexistent body like the candle just can’t decide where to land.
Check out the shadows and see if the candlestick lines up with familiar doji varieties like the dragonfly or gravestone. These shapes can tell you a story if you pay close attention.
Put this candle side by side with the recent ones to figure out if it’s popping up at a trend’s peak, bottom or in the middle of a consolidation phase. Context is everything here.
Zoom out and consider the bigger market picture. The doji may be appearing after a strong move up or down or just hanging out amid sideways price action where nothing much is happening.
Whenever you’ve got volume data on hand, keep an eye out for volume spikes because higher volume tends to give the doji’s signal more punch and credibility.
The context surrounding a doji candle plays a huge role. In an uptrend a doji often signals hesitation, like the market is catching its breath before a possible pullback. In a sideways market it usually reflects ongoing uncertainty as if the market cannot make up its mind.
The doji captures a moment where the market is caught in limbo. Neither buyers nor sellers are calling the shots so traders keep a close eye on the next few candles hoping for clarity on what’s around the corner. Depending on where the doji appears in the price action it might hint at a reversal, suggest the trend will continue, or simply signal a brief pause in momentum.
A doji captures that brief moment of hesitation, when neither side manages to snag the upper hand, signaling a key turning point just before the final outcome begins to take shape.
Traders often weave doji pattern recognition into their bigger strategies to fine-tune timing and keep risk in check. Since dojis signal a bit of market indecision, it generally pays off to hold tight for a confirming candle before jumping in—this little patience can really help cut down risk.
A trader might spot a Dragonfly Doji popping up right at a key support level and notice the volume starting to pick up steam. They might also get a thumbs-up from an oversold RSI. When these clues come together they tend to build a convincing case for jumping into a long position.

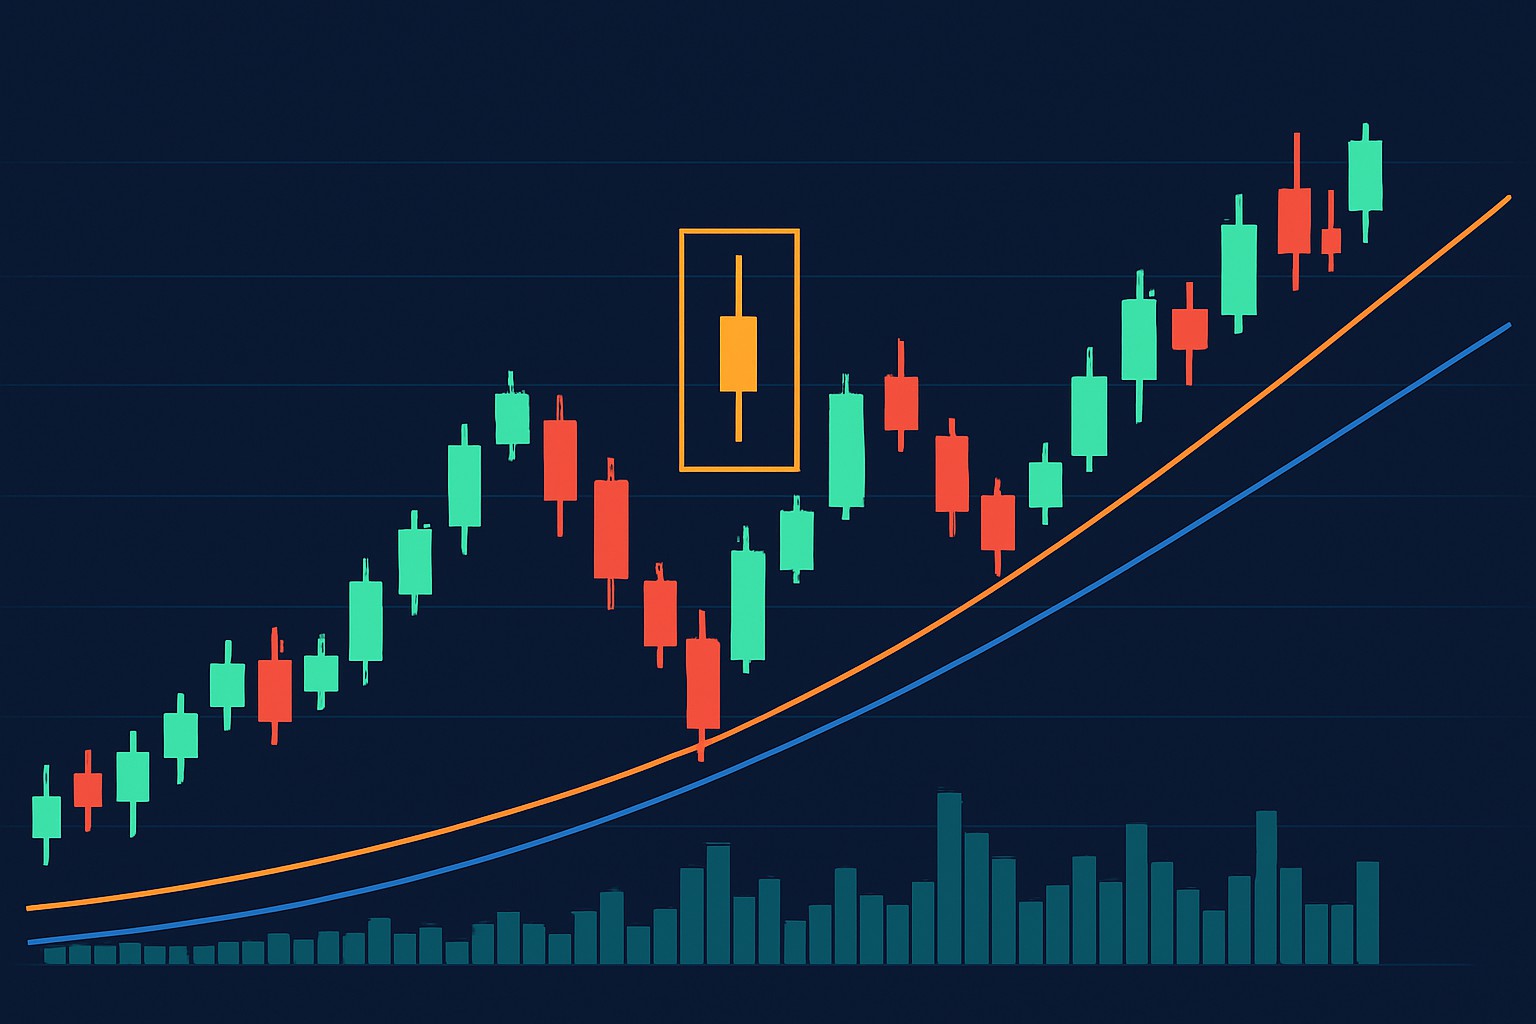
Example chart showing a doji pattern preceding a trend reversal confirmed by other signals
Doji patterns can be pretty handy I’ve noticed a lot of traders treat them a bit like magic beans—expecting automatic signals every time. The trick is not to jump to conclusions and assume every doji means a reversal. You really need to step back and take in the whole chart for some proper context.
The doji candlestick pattern offers traders a fascinating glimpse into market psychology, highlighting those brief moments of hesitation that often sneak in just before major price swings.

Tired of missing opportunities and making suboptimal trading decisions? TrendSpider's cutting-edge platform automates complex technical analysis, saving you time and reducing human error.
With multi-timeframe analysis, dynamic alerts, backtesting, and customizable charting, you'll gain a competitive edge in identifying trends and making informed trades across global markets.

Known for demystifying complex derivatives trading through accessible education, this former Wall Street trader turned educator empowers retail investors with institutional-level strategies.
Read PostsTrend lines are essential tools in technical analysis that help traders identify market direction an...

Discover how to recognize the evening star candlestick pattern—a powerful signal highlighting potent...
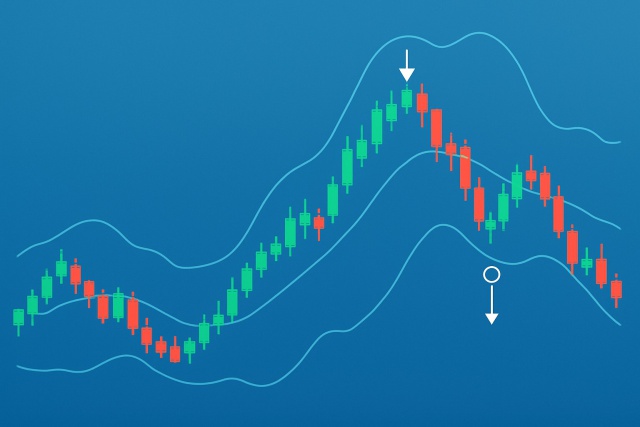
Master trading with Bollinger Bands by understanding volatility, setup patterns, and risk management...

Master the momentum indicator to gauge price speed and trend strength. This ultimate guide covers ca...