


Technical Analysis
What Is a Trend Line in Technical Analysis?
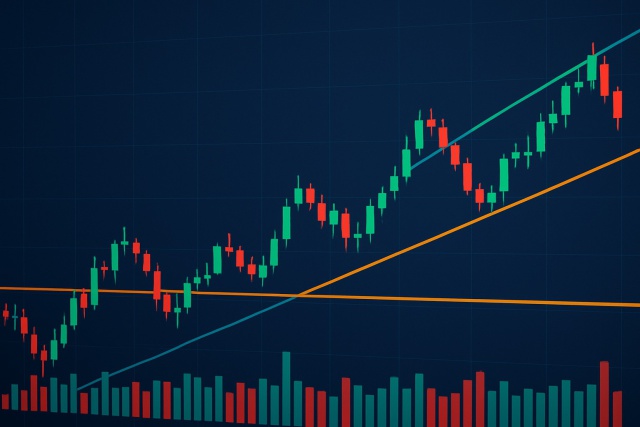
Trend lines are essential tools in technical analysis that help traders identify market direction an...
The double bottom chart pattern is a handy tool in technical analysis that often signals a potential bullish reversal after a downtrend that’s been dragging on.
A double bottom chart pattern typically shows up after a noticeable downtrend and looks a lot like the letter W on a price chart. It’s marked by two distinct lows sitting around the same price level, with a moderate peak sandwiched in between. This pattern really matters because it often signals a shift from bearish to bullish momentum, suggesting that sellers are starting to lose their grip while buyers gradually step into the spotlight.
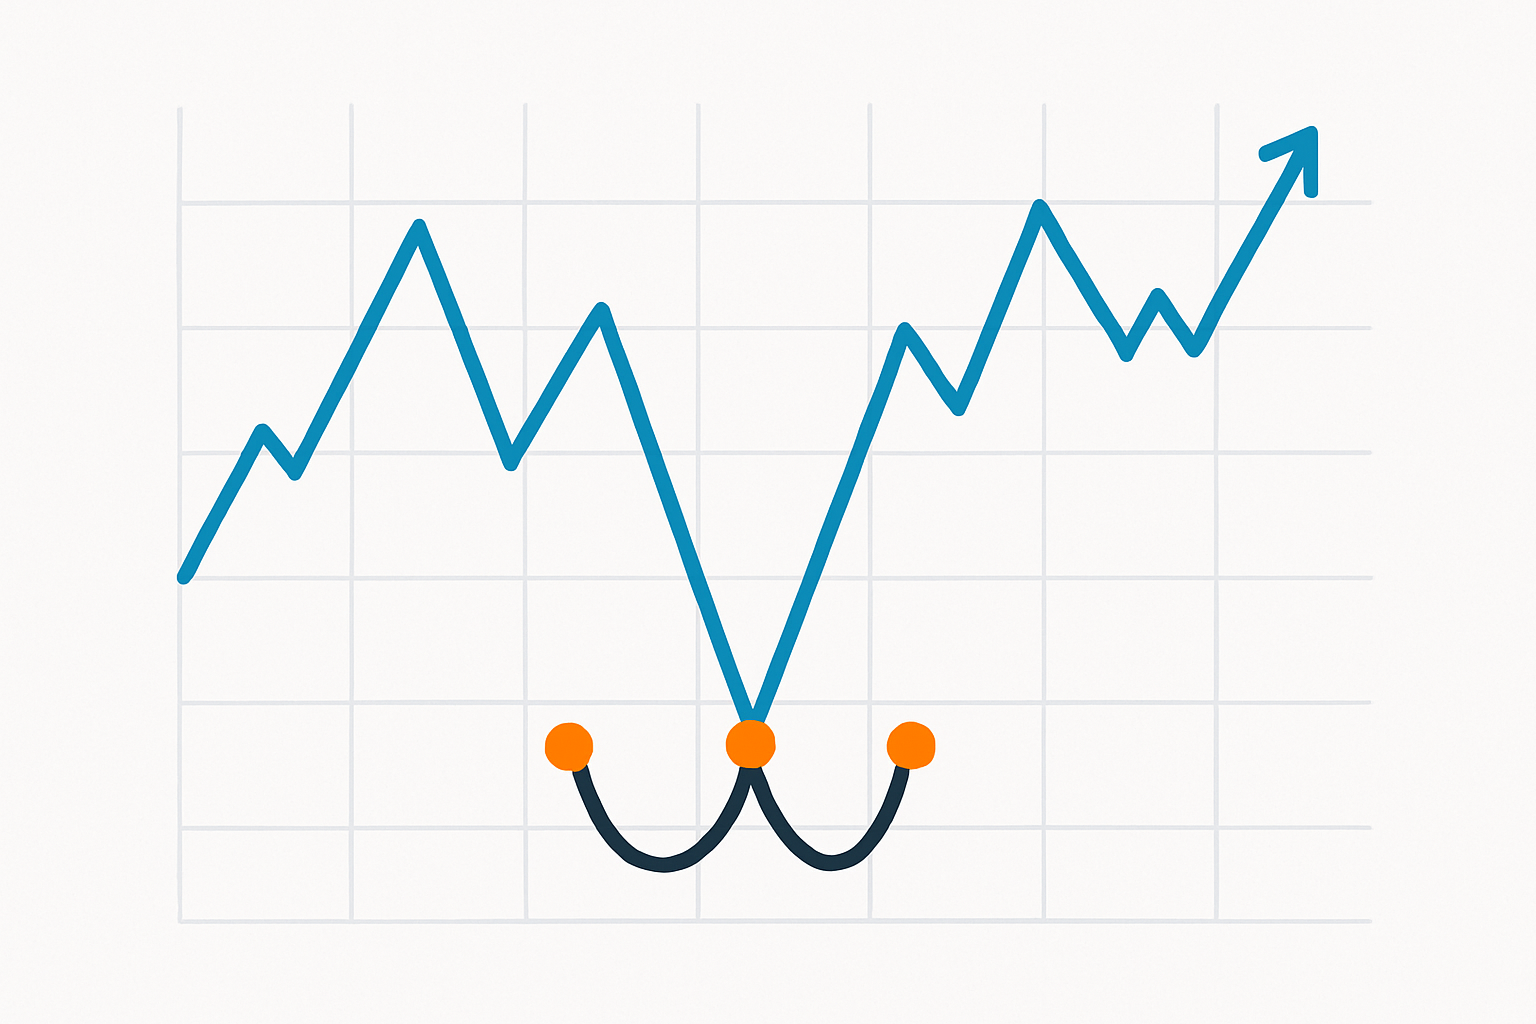
Illustration of a typical double bottom pattern forming a 'W' shape on a stock price chart.
The two lows in a double bottom pattern create a solid support area where prices don’t seem to fall any further on two separate tries. This signals that buyers are jumping in to grab a bargain. The peak between them acts as a key resistance level called the neckline. Traders watch it closely.
Recognizing a valid double bottom pattern calls for a careful eye to distinguish it from similar-looking shapes or those tricky false signals that throw traders off. Typically, traders look for a clear downtrend leading into the pattern and keep an eye out for those low points that hang around the same level.
Spot a clear downtrend where prices have been steadily dropping. Nothing too choppy just a consistent slide.
Look for two distinct lows that sit close in price with no big gap between them.
Keep an eye on the volume especially if it increases during the second low or the breakout above the small peak between the bottoms.
Hold your horses until the price breaks above the resistance created by that peak between the lows. Ideally, this happens on higher volume to confirm it.
Make sure the time gap between the two bottoms is meaningful. If it’s too short it might be market noise and if it’s too long the pattern could lose its strength.
One common slip-up I often see is getting double bottoms tangled up with other patterns like wedges or double tops, or jumping the gun on a breakout before there’s enough volume to make it stick.
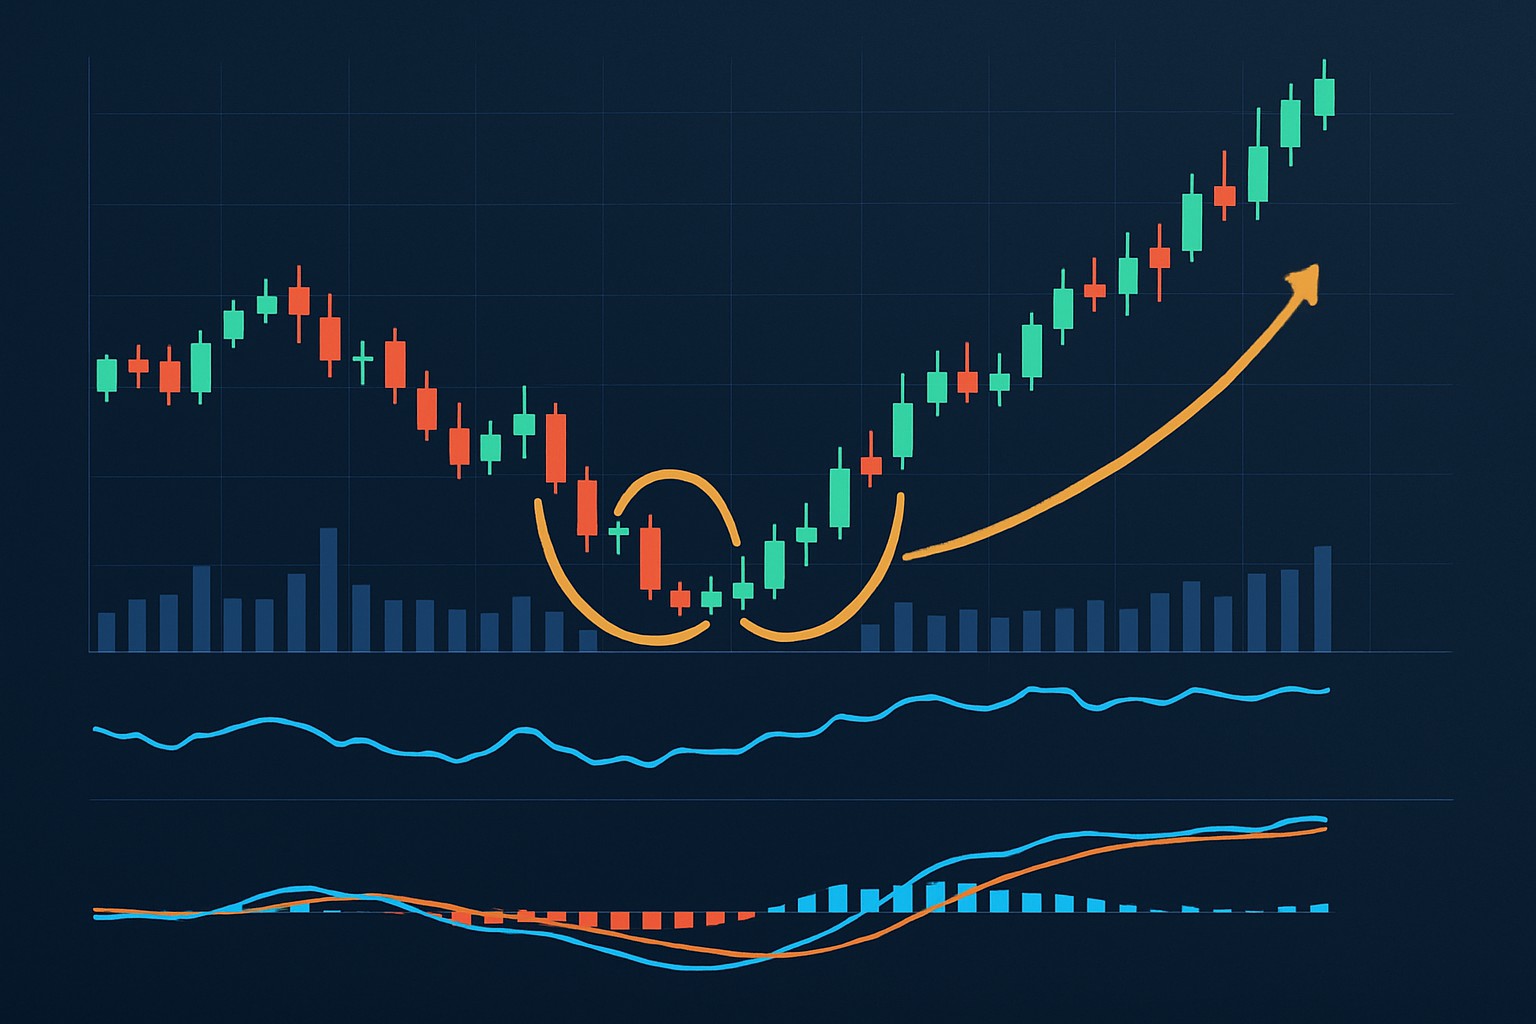
Price action still holds the crown, but a handful of trusty technical indicators and some good old volume analysis can really help nail down just how strong and dependable a double bottom pattern might be.
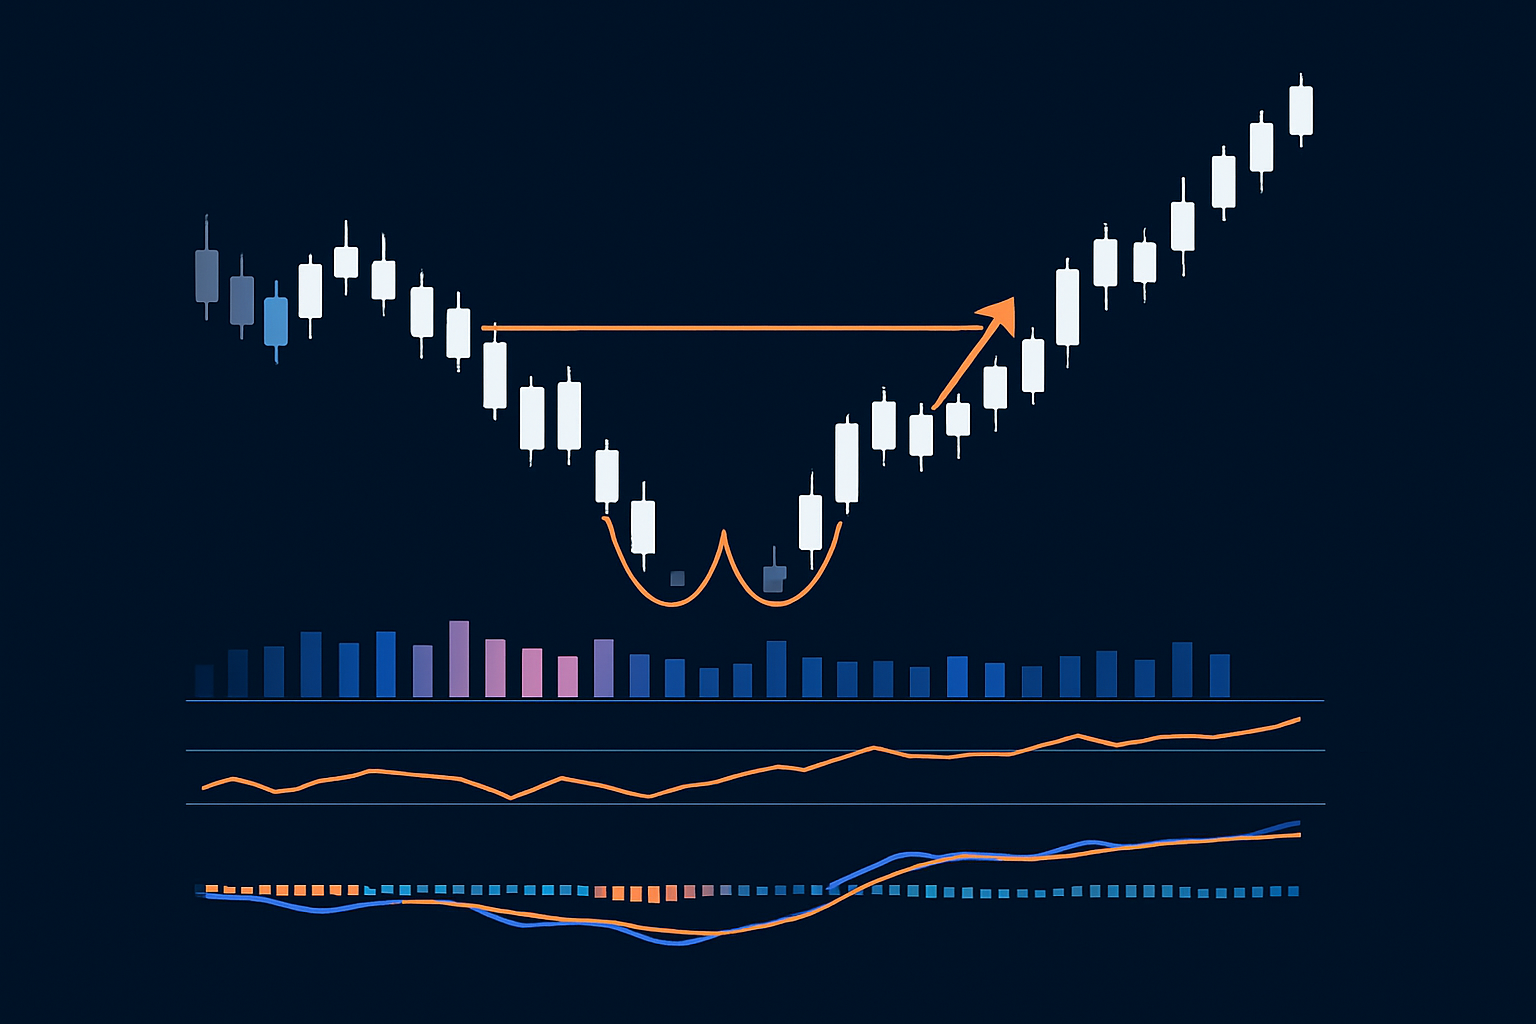
Chart showing a double bottom pattern with supporting volume and technical indicators such as RSI and MACD.
Traders often lean on the double bottom pattern when looking to jump into bullish trades that tend to carry less risk and come with clear profit targets. The usual game plan is to hang tight until the breakout gives a thumbs-up. Then manage risk carefully with stop-loss orders and aim for profit goals that reflect the pattern’s height.
Jump into the trade only after the price convincingly closes above the middle peak or neckline. This little confirmation step really helps avoid false breakouts.
Place a stop-loss just below the second bottom as a safety net because nobody likes watching their hard-earned money slip away if the pattern falls apart.
Gauge the distance between the bottoms and the middle peak to set a profit target, aiming for a similar upward move usually does the trick.
Consider using trailing stops to lock in your gains if the price keeps climbing beyond your target. It is like holding on while the gravy train keeps rolling.
Risk management is the unsung hero here, as traders routinely tweak their stop-losses and profit targets depending on market volatility and the specific asset they are juggling. Take stocks that have a knack for jumping around a bit more—they often call for wider stops or a few extra indicators to double-check signals.
Take a look at a recent daily chart of a tech stock that had been sliding steadily for several weeks. It dipped down to a low around $50 then bounced back up to $54 only to dip again close to $50. Traders keeping a close eye noticed the volume picking up at that second bottom and started waiting for the price to push past $
When it finally closed above that mark with stronger volume they jumped in with long positions. Stops were carefully placed just below $50 while profit targets were set around $58 based on the height of the pattern.
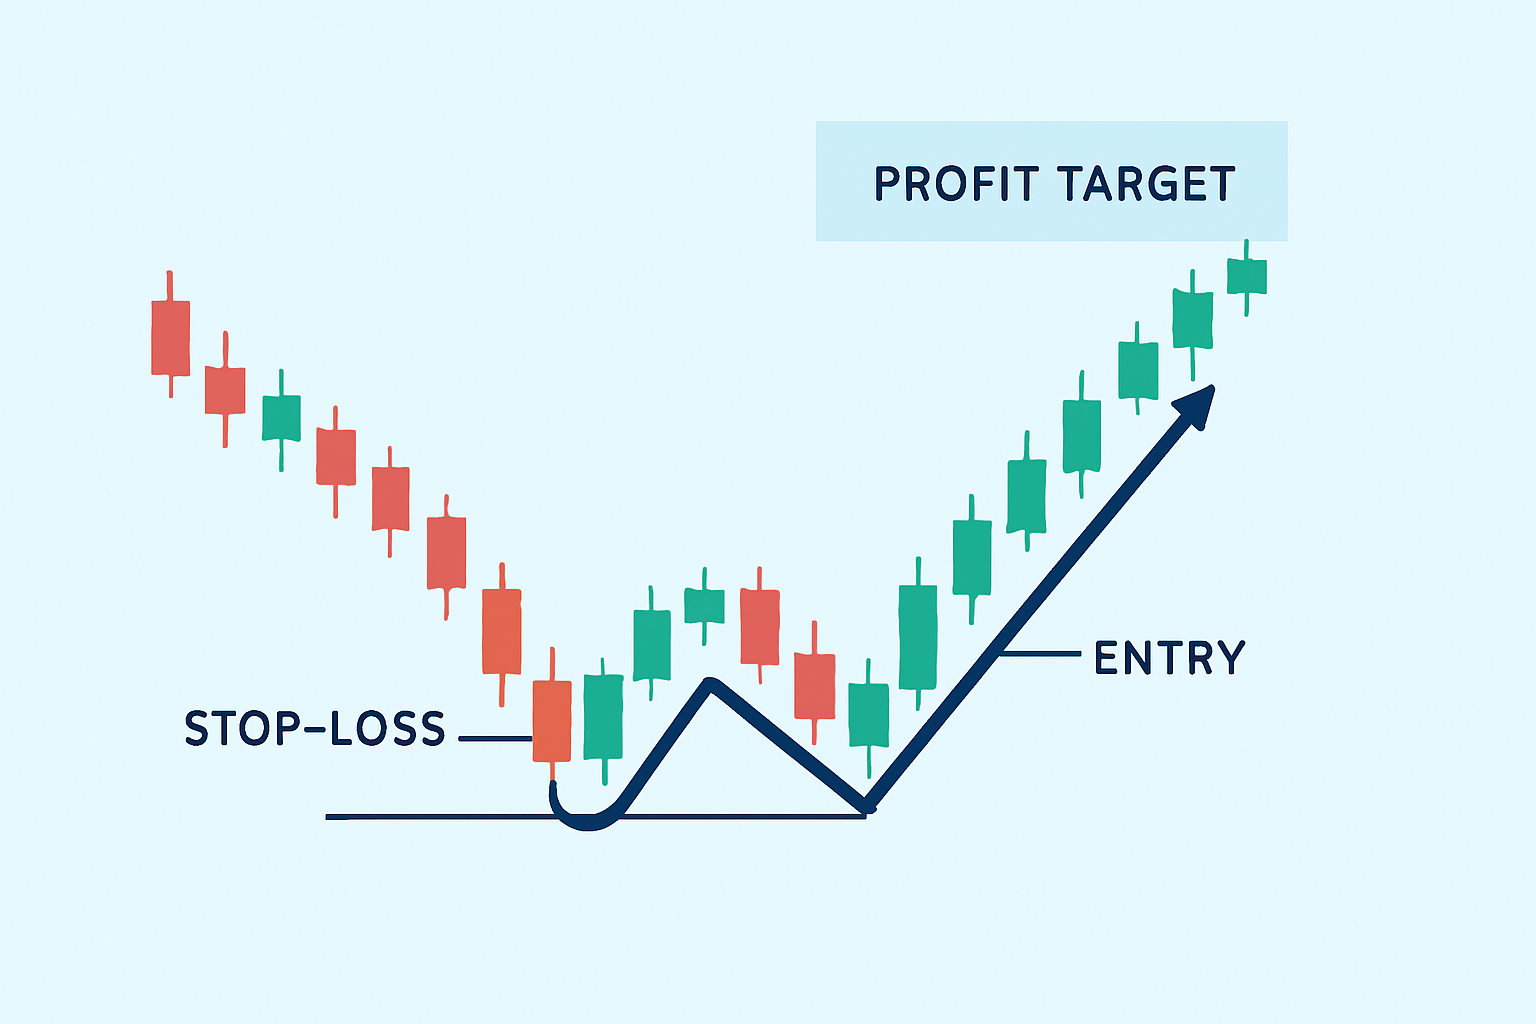
Annotated chart demonstrating trade entry, stop-loss, and profit target for a double bottom pattern.
The double bottom pattern can be quite handy though it’s not exactly foolproof. Traders often find themselves tangled in false breakouts that sneakily lead to losses, or stuck in those frustrating sideways markets where the pattern just refuses to signal a clear trend reversal. As you might guess, volatile market conditions tend to throw a wrench in the pattern’s reliability.
Traders usually don’t put all their eggs in one basket when spotting a double bottom chart pattern. They pair these signals with other forms of analysis, like fundamental data and a handful of technical indicators.

Tired of missing opportunities and making suboptimal trading decisions? TrendSpider's cutting-edge platform automates complex technical analysis, saving you time and reducing human error.
With multi-timeframe analysis, dynamic alerts, backtesting, and customizable charting, you'll gain a competitive edge in identifying trends and making informed trades across global markets.

With 20 years of experience in derivatives trading, she specializes in options strategies and volatility trading, known for her innovative approaches to portfolio hedging.
Read PostsTrend lines are essential tools in technical analysis that help traders identify market direction an...

Discover the wedge falling pattern's secrets and learn step-by-step how to trade this powerful techn...

Master the momentum indicator to gauge price speed and trend strength. This ultimate guide covers ca...

Hidden bullish divergence is a key technical indicator revealing strong buying pressure beneath unce...