


Technical Analysis
What Is a Trend Line in Technical Analysis?
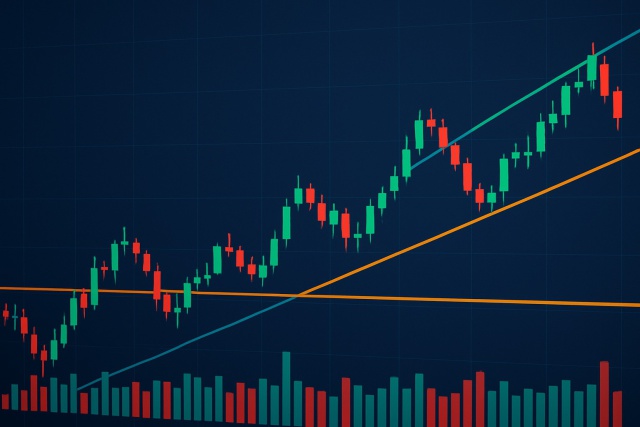
Trend lines are essential tools in technical analysis that help traders identify market direction an...
Hidden bullish divergence is one of those nifty concepts in technical analysis that hints at buying pressure lurking beneath the surface, even when prices seem a bit soft or murky. It’s like a quiet whisper of underlying upward momentum.
Divergence pops up when a price chart and a technical indicator seem to be dancing to different tunes, hinting at a shift in momentum or even a possible reversal. It’s like a little window into market psychology, revealing when buyers or sellers might be starting to lose their grip on the reins.
Hidden bullish divergence is a special kind of bullish divergence that usually signals a trend is likely to keep on truckin’ rather than flipping direction. It happens when the price makes a lower high, but the indicator throws a higher high into the mix. This little quirk suggests that buyers aren’t ready to throw in the towel just yet, even during those minor price pullbacks.
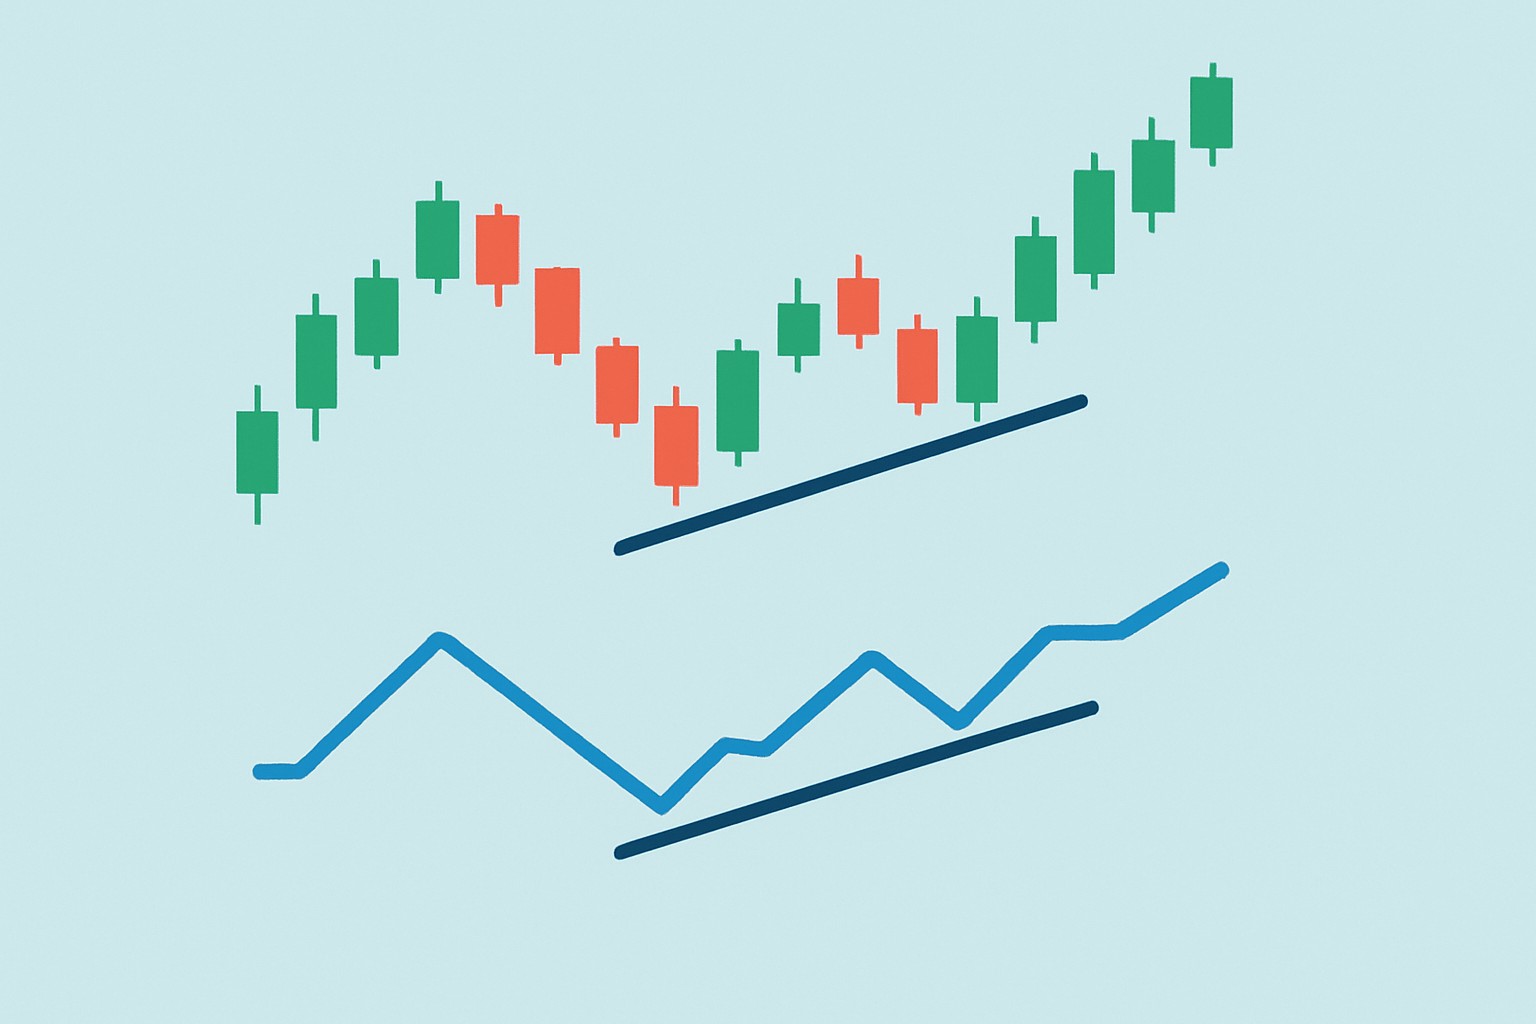
Example of hidden bullish divergence where the price forms lower highs while the RSI indicator forms higher highs, signaling strong buying pressure.
Hidden bullish divergence can be a bit slippery, especially if you’re just starting out. It’s best to kick things off with straightforward indicators like RSI and MACD, keeping a close eye on how price and indicator highs line up.
Take a close look at the price chart to see if the current price is making a lower high compared to the last peak. It’s a subtle but important detail.
Next, check your chosen momentum indicator like RSI or MACD to see if it’s making a higher high during the same period. This divergence can be quite telling.
Ensure the overall trend is bullish or moving upward because this suggests the hidden divergence might support the trend’s continuation. This is always reassuring.
Finally, verify the signal with a few additional indicators such as rising volume or support levels. Taking extra caution helps avoid false alarms.
One common slip-up people often make is confusing hidden bullish divergence with the regular kind or worse trying to trade against the trend that is already in motion. Signals can lose their punch or go stale when the market is moving sideways or acting choppy so getting the bigger picture is key. Luckily tools like TradingView come in handy to help spot divergence without breaking a sweat.
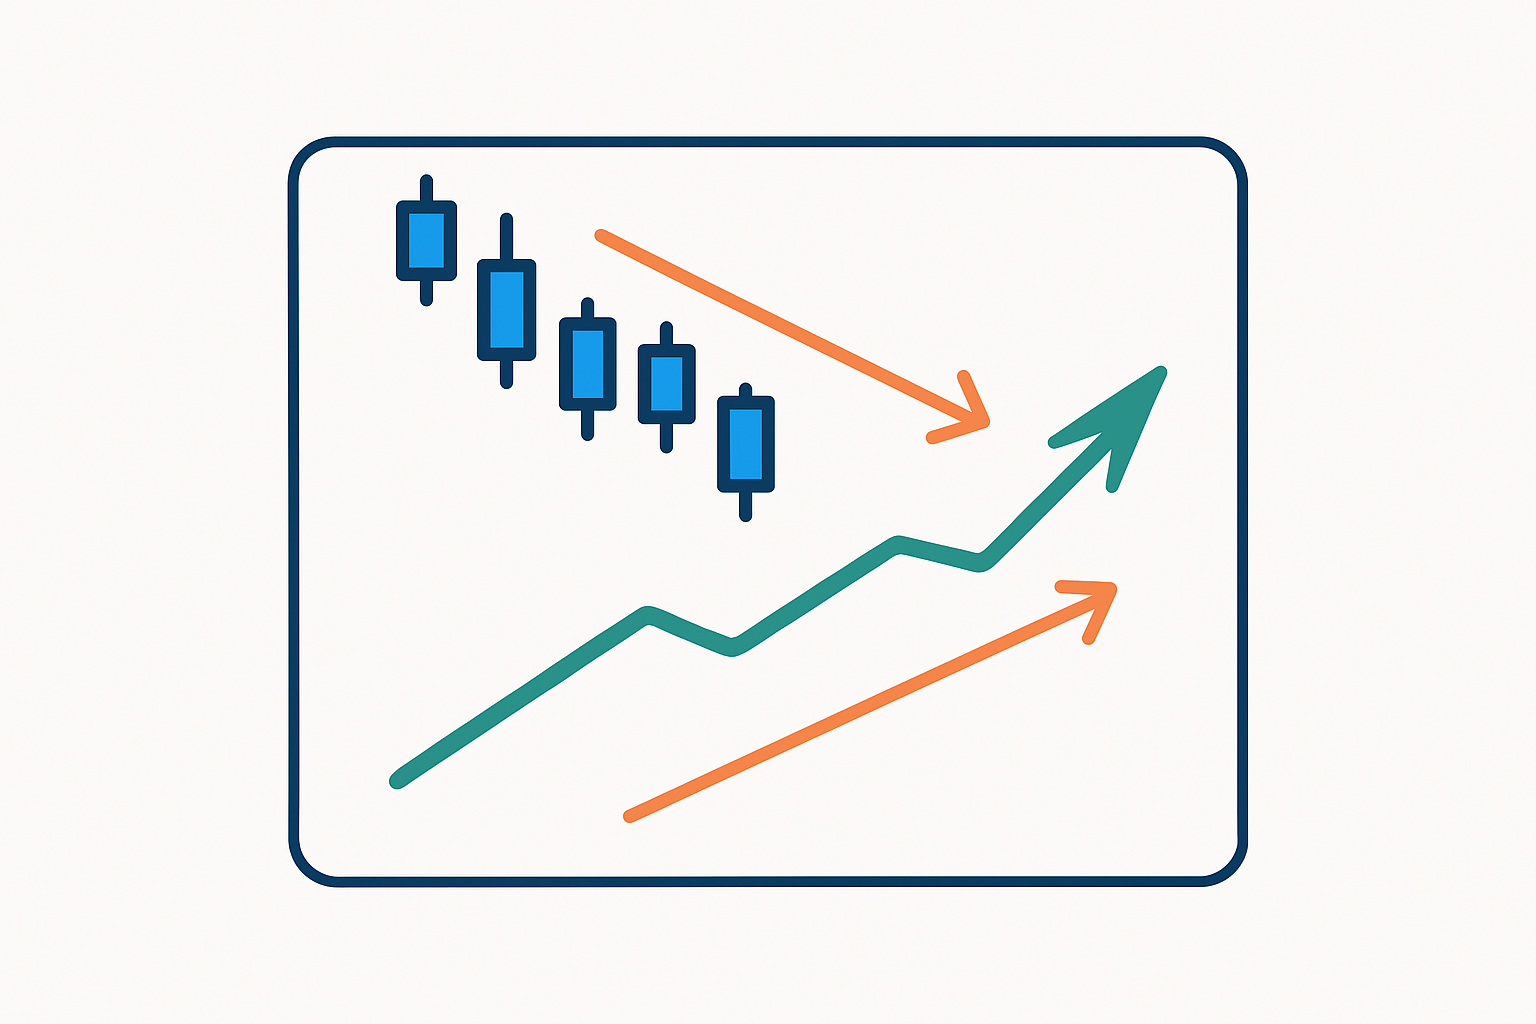
Hidden bullish divergence is a subtle sign that buyers haven’t lost their grip, even when prices take a brief dip.
Hidden bullish divergence often feels a bit like a runner who eases up just before hitting a steep hill — but then, with a surprising burst of grit and stamina, kicks it into a higher gear right after cresting the top.
Traders often lean on hidden bullish divergence as a sneaky trick to spot better entry points and keep risk in check. When you use tools like trendlines and volume analysis with moving averages, these signals feel a lot more trustworthy.
A trader using TradingView noticed a subtle bullish divergence on the RSI that aligned with sturdy moving average support. After a slight dip in price they jumped in and their position rode the wave of an impressive rally.
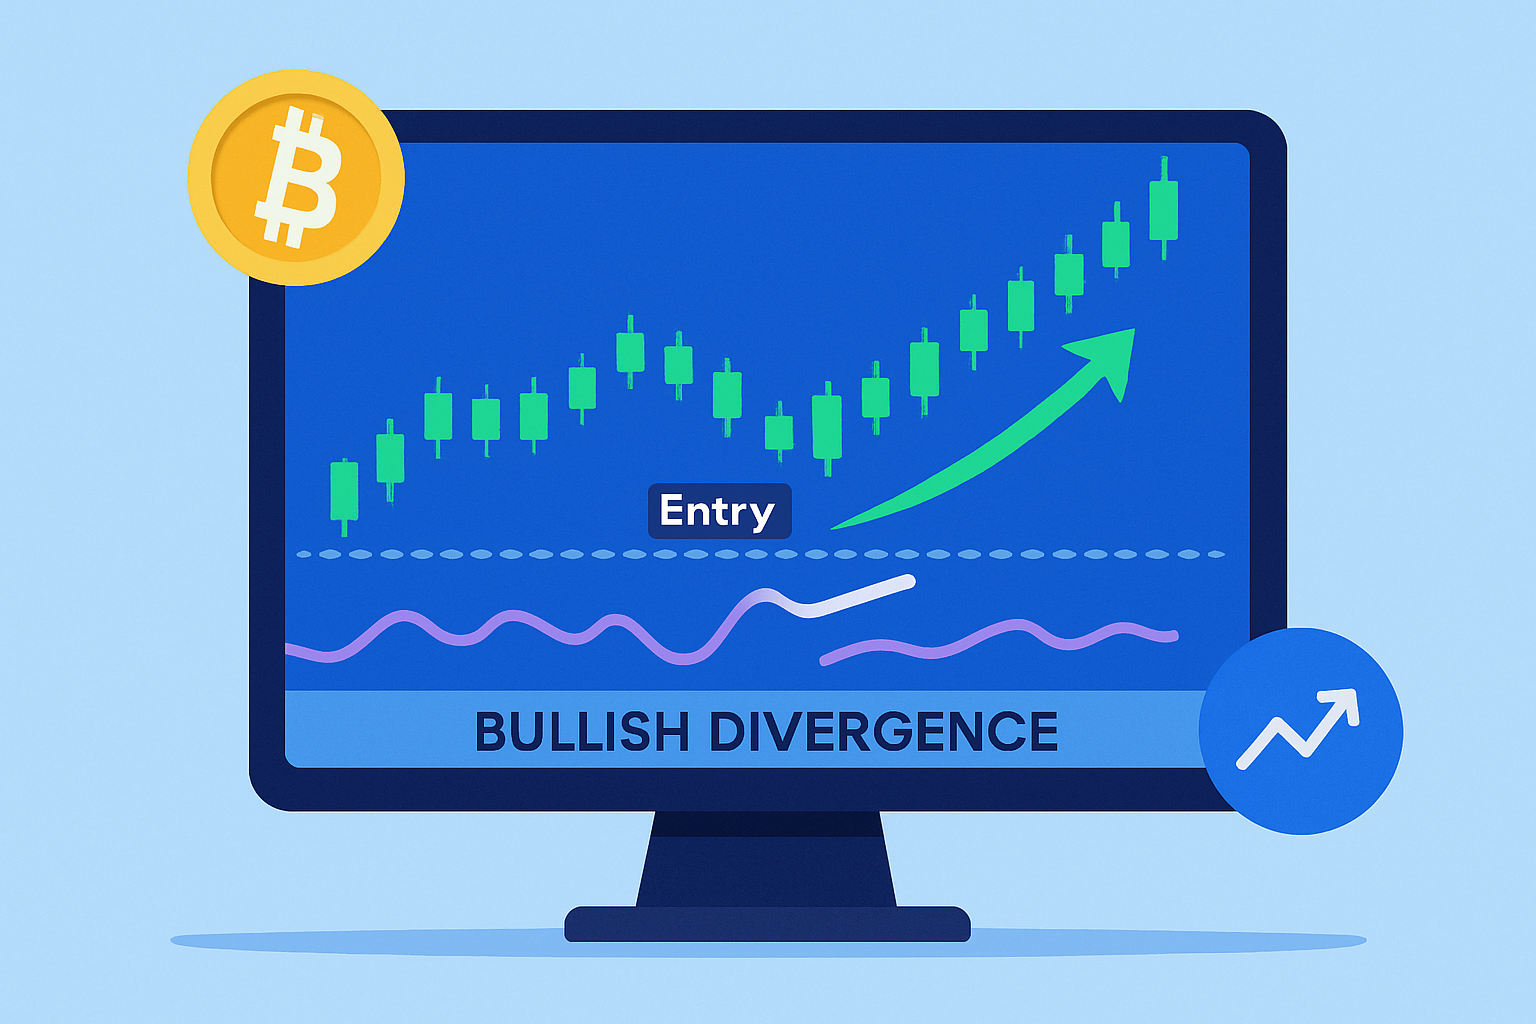
Trading chart example highlighting an entry point based on hidden bullish divergence seen in the RSI indicator and subsequent price increase.
Hidden bullish divergence can be a pretty strong signal though it’s far from a silver bullet. People often jump the gun and treat it as a guaranteed green light to buy or they end up misreading it when the market decides to throw a wild tantrum.

Are you tired of juggling multiple tools for your trading needs? TradingView is the all-in-one platform that streamlines your analysis and decision-making.
With its powerful charting capabilities, real-time data, and vibrant community, TradingView empowers traders like you to stay ahead of the market. Join thousands who trust TradingView for their trading success.

Transforming the field of technical analysis through innovative charting techniques, Scarlett specializes in pattern recognition and momentum trading strategies for equity markets.
Read PostsTrend lines are essential tools in technical analysis that help traders identify market direction an...

Discover the wedge falling pattern's secrets and learn step-by-step how to trade this powerful techn...
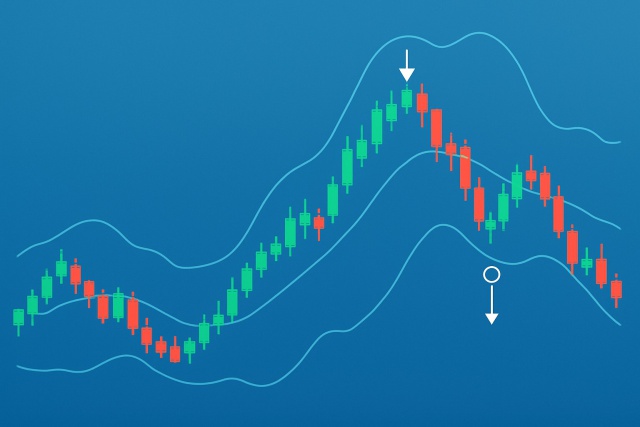
Master trading with Bollinger Bands by understanding volatility, setup patterns, and risk management...
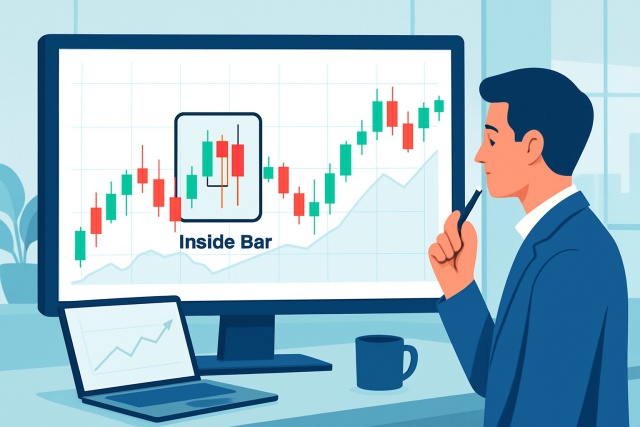
Discover how inside bar patterns signal key market pauses and possible breakouts or reversals. This...