


Technical Analysis
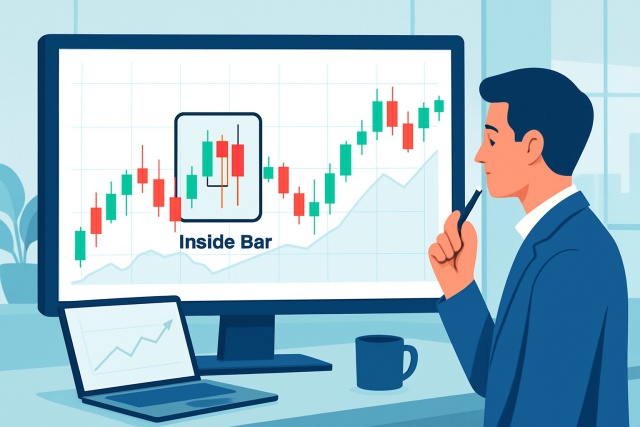
Inside Bar Pattern To Spot Breakouts And Reversals
Discover how inside bar patterns signal key market pauses and possible breakouts or reversals. This...
The hanging man reversal pattern is a candlestick signal that traders can’t seem to get enough of because it often hints at a potential shift from a rising market to a falling one. Despite its spooky name the pattern is pretty straightforward to spot once you know what to look for and understand the context. I’ll guide you through what the hanging man reversal really is, how it appears on price charts, and why traders and investors keep a close watch on it when making decisions
The hanging man reversal is a single candlestick pattern that often appears after an uptrend and hints that sellers might be edging their way in. It has a small real body near the top of the candle and a long lower shadow. It has barely any upper shadow—giving it the unmistakable look of a hanging figure, hence the quirky name.
People often mix up the hanging man with the hammer candlestick since they can look downright similar at first glance. The hammer shows up after a downtrend and tends to wave a little flag for a bullish reversal. The real trick lies in paying close attention to the trend leading up to it and the candlestick’s context.
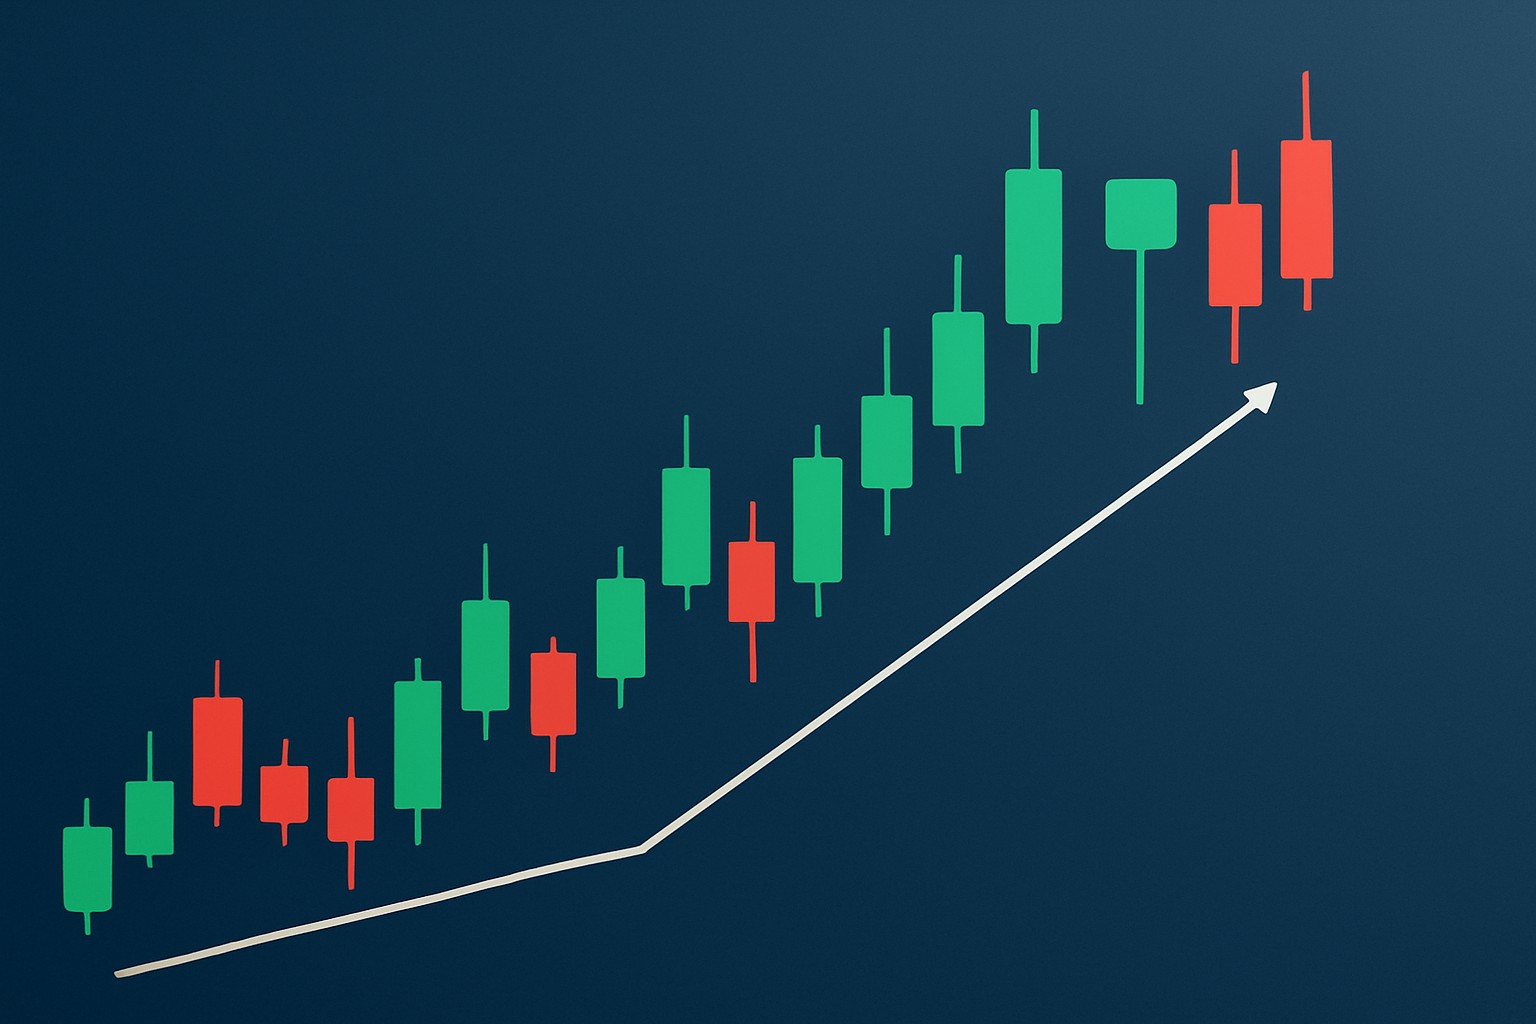
Candlestick charts are the bread and butter of technical analysis designed to lay out price movements in a way that’s easy on the eyes and brain. Each candle tells a little story showing the open, high, low and close prices within a specific slice of time.
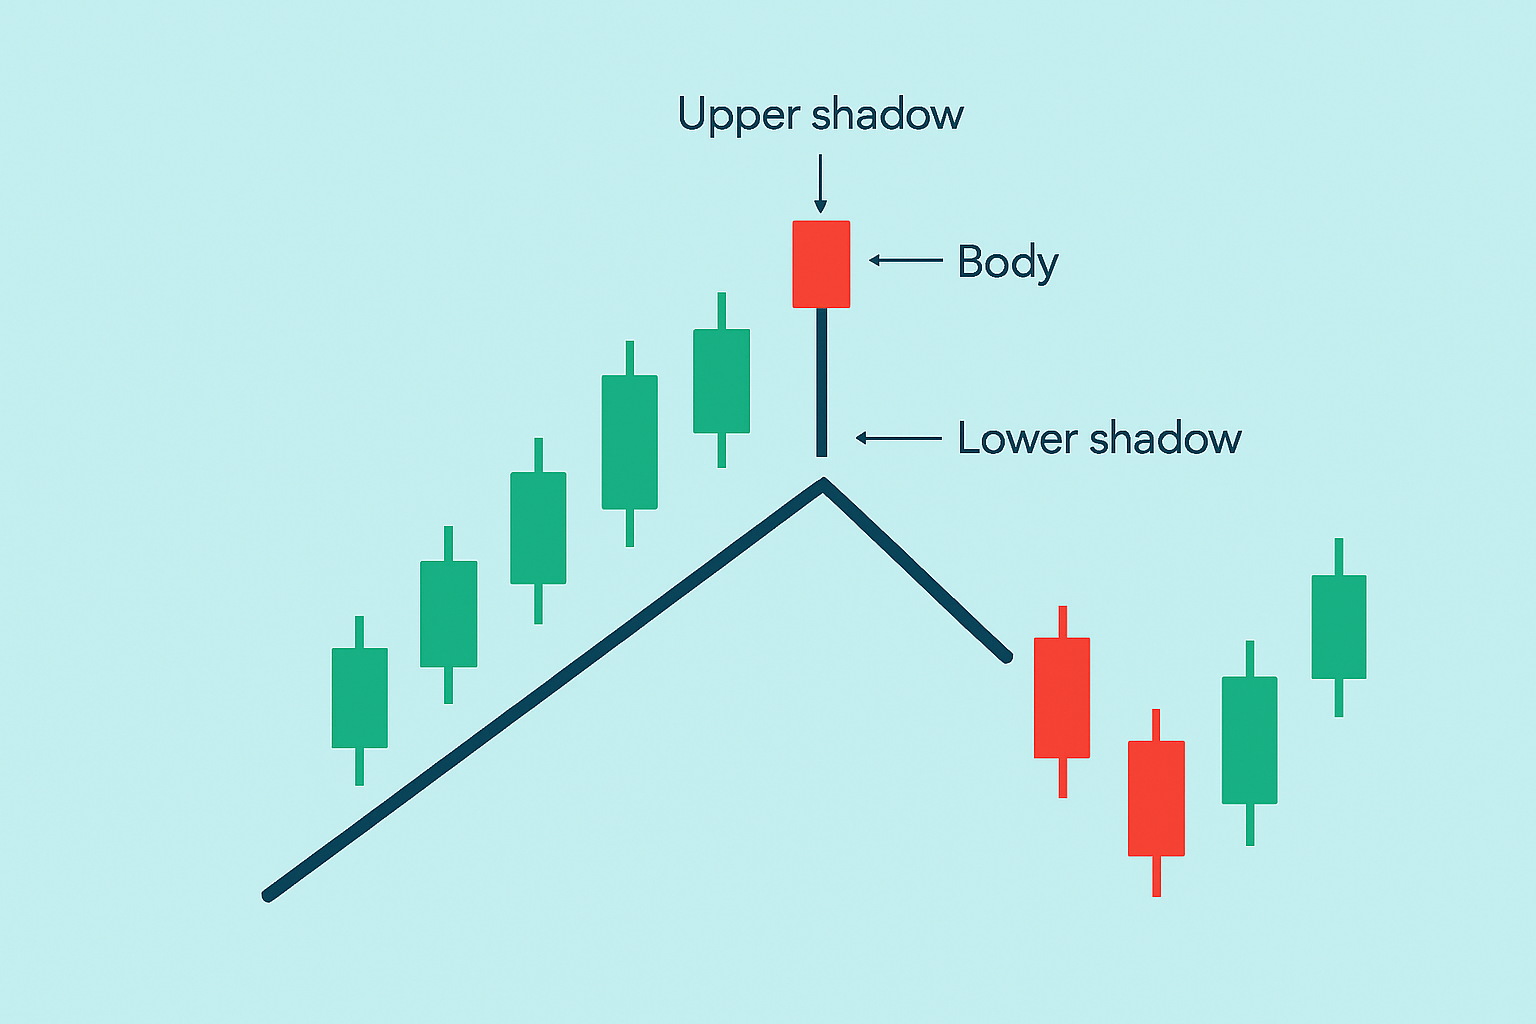
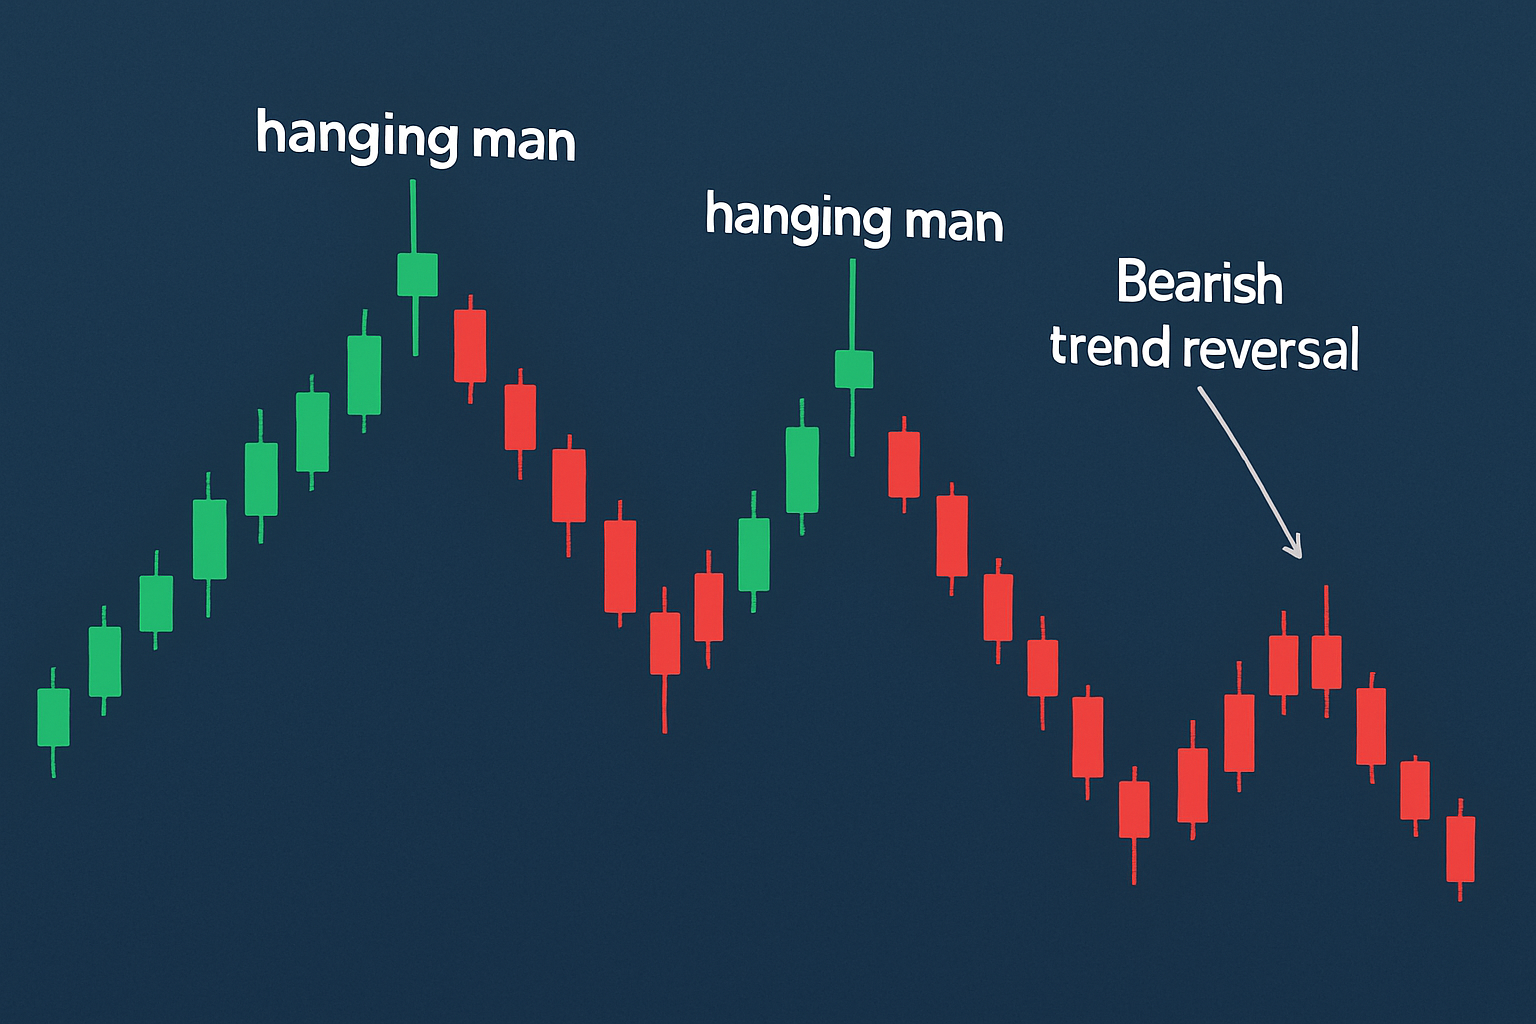
A candlestick chart showing a hanging man pattern after an uptrend, with clear labels for the small body, long lower wick, and minimal upper shadow.
Reversal signals are nifty patterns that nudge you to expect a market change. They come in two types: bearish reversals hint the market is shifting from climbing to tumbling and bullish reversals suggest a bounce back after a dip. The hanging man stands out because it often appears near the peak of an uptrend and signals sellers are starting to push back against buyers.
Make sure the price chart shows a clear uptrend. Remember that hanging man patterns usually indicate bearish reversals only after prices have been climbing.
Keep an eye out for a candlestick with a small real body near the top of its trading range where the open and close prices are close together.
Look for a long lower shadow that is at least twice the size of that tiny real body because this hints at strong selling pressure during the session.
Check the volume when the hanging man appears. Generally, higher volume gives the signal more strength and credibility.
Make sure the upper shadow is barely visible or completely missing. This supports the idea that sellers took control after buyers pushed prices up.
Be patient and wait for the next candle to close below the hanging man’s real body. This confirmation helps avoid false alarms and confirms the bearish reversal.
Every single step counts. Catching sight of an uptrend is your first clue that the hanging man might be waving a red flag for a potential reversal. The size and position of the candle’s body and wick speak volumes about the tug of war between supply and demand. Volume tends to tag along and often confirms how strong the move really is. I’ve found that hanging tight for the next candle’s confirmation can save you from jumping the gun.
The hanging man candle highlights those pivotal moments when market sentiment begins to wobble during a price rally. Buyers initially drove prices up, but the long lower shadow shows a different story. Sellers pushed back hard and dragged prices down within the same session. Closing near the opening price despite the selling pressure speaks volumes about the uncertainty in the air. It feels like buyers are starting to slip out of the driver’s seat and the market might be gearing up for a turnaround.
While the hanging man candle often wraps up its day near where it kicked off, that long lower wick is whispering about some serious selling pressure lurking beneath—definitely not something to just brush aside. It’s like a subtle red flag waving low, hinting at some hidden weakness bubbling under the surface.
This subtle yet important shift in trader behavior really cracks open the door for price drops. When the next candle steps up and confirms the bearish signal by closing below the hanging man’s body, it often sets off waves of selling
Traders often lean on the hanging man reversal as just one piece of the bigger technical analysis puzzle to keep risk in check and figure out the best times to jump in or get out of the market. Catching this pattern early can be a real lifesaver for locking in profits or gearing up for a short sell, especially when you pair it with other indicators and volume data.
The hanging man reversal often gives some pretty solid insight, but leaning on it alone can sometimes lead to jumping the gun or getting caught in whipsaw trades.
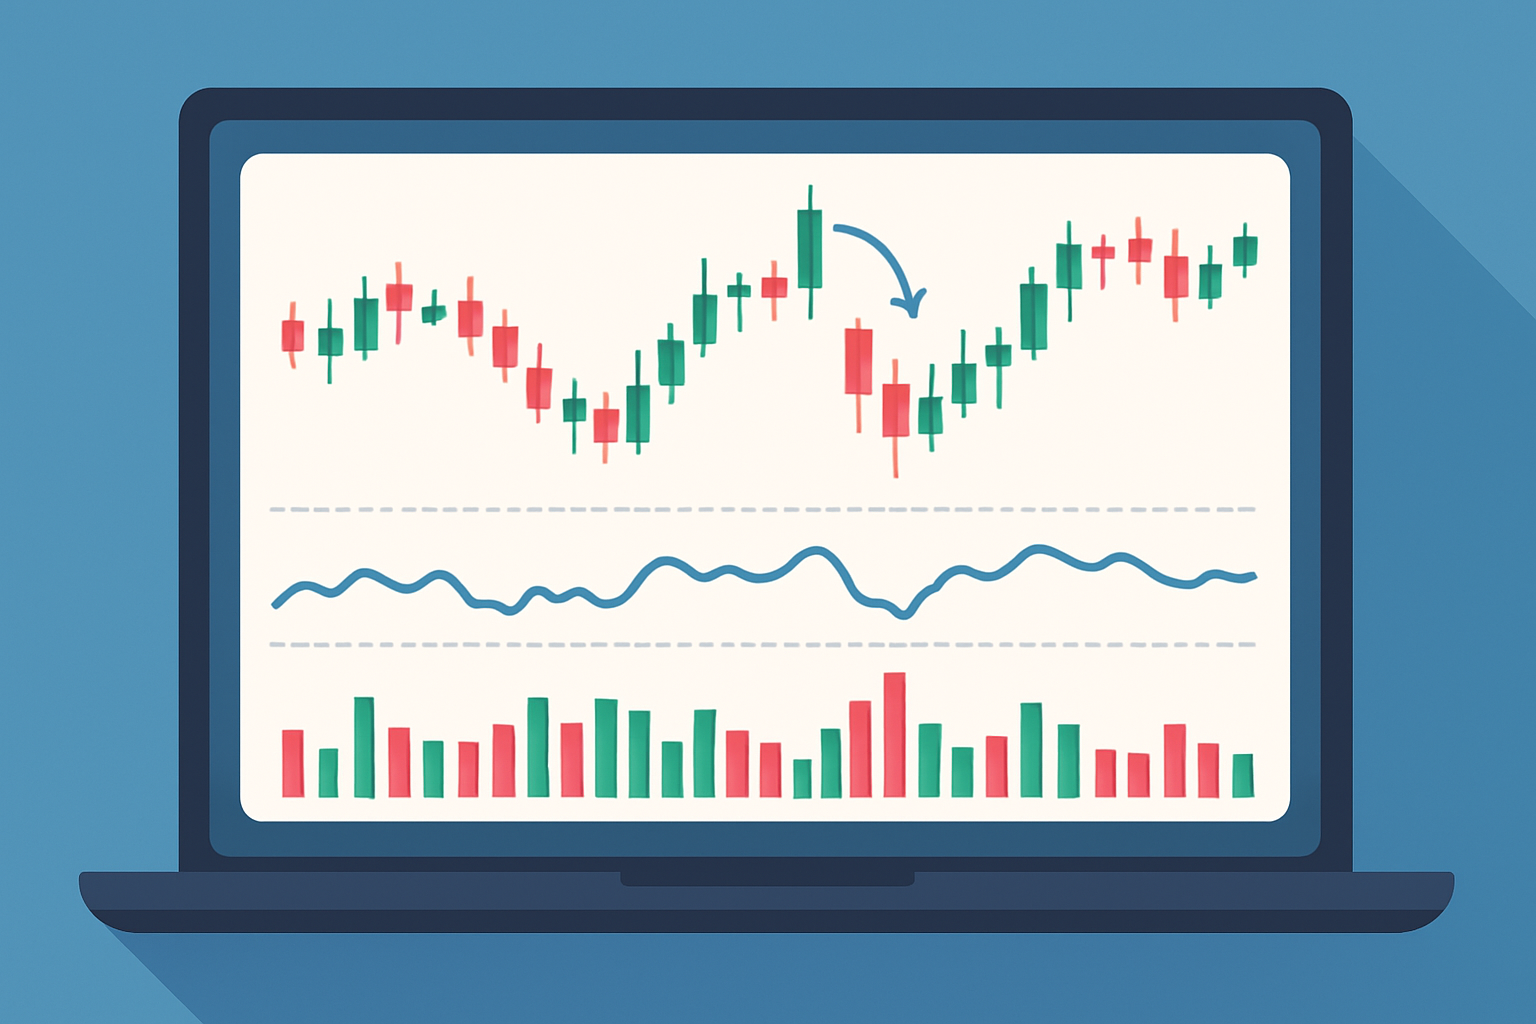
Chart showcasing a hanging man reversal candle confirmed by RSI indicator trend and volume spike, suitable for advanced trading platforms like TradingView.
These common slip-ups usually sneak in when impatience takes the wheel or when the situation isn’t given a good, hard look.
Let’s dive into some real-market examples where hanging man reversals popped up right before notable price drops. You’ll notice how a long lower shadow shows up after those solid uptrends, only to be followed by bearish confirmation candles that kick off the sell-offs.
Annotated real market charts demonstrating hanging man patterns with subsequent price drops for practical study.
Beginners can kick things off by trying out free or premium charting tools like TradingView to spot a hanging man reversal. These handy tools offer clear visuals and make it easier to hunt down hanging man patterns without breaking a sweat. I have found that regularly practicing how to spot these candles and then double-checking with volume or other indicators really helps build confidence—sort of like training wheels before hitting the busy streets of the market.

Are you tired of juggling multiple tools for your trading needs? TradingView is the all-in-one platform that streamlines your analysis and decision-making.
With its powerful charting capabilities, real-time data, and vibrant community, TradingView empowers traders like you to stay ahead of the market. Join thousands who trust TradingView for their trading success.

Driven by a passion for democratizing financial markets, he creates accessible trading education content that bridges the gap between complex strategies and retail investors.
Read PostsDiscover how inside bar patterns signal key market pauses and possible breakouts or reversals. This...

Hidden bullish divergence is a key technical indicator revealing strong buying pressure beneath unce...

Master the momentum indicator to gauge price speed and trend strength. This ultimate guide covers ca...

Discover how to recognize the evening star candlestick pattern—a powerful signal highlighting potent...