


Technical Analysis
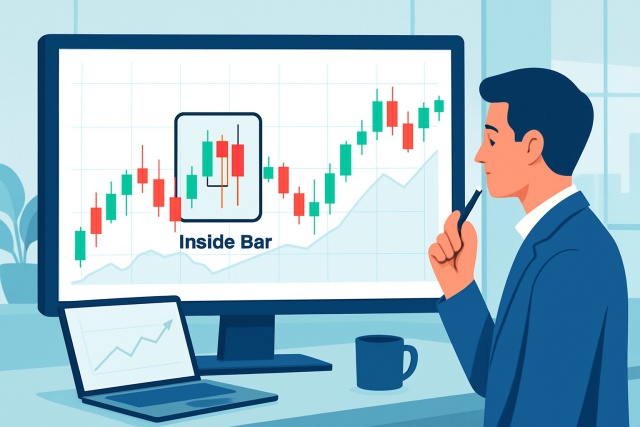
Inside Bar Pattern To Spot Breakouts And Reversals
Discover how inside bar patterns signal key market pauses and possible breakouts or reversals. This...
Getting a handle on chart patterns is absolutely key for traders aiming to get a leg up by spotting possible market moves before they actually happen. The upside down hammer might not be the star of the show everyone’s talking about, but it’s definitely a strong candlestick pattern that often hints at shifts in market sentiment. It usually signals potential reversals or at least a pause in those stubborn downtrends.
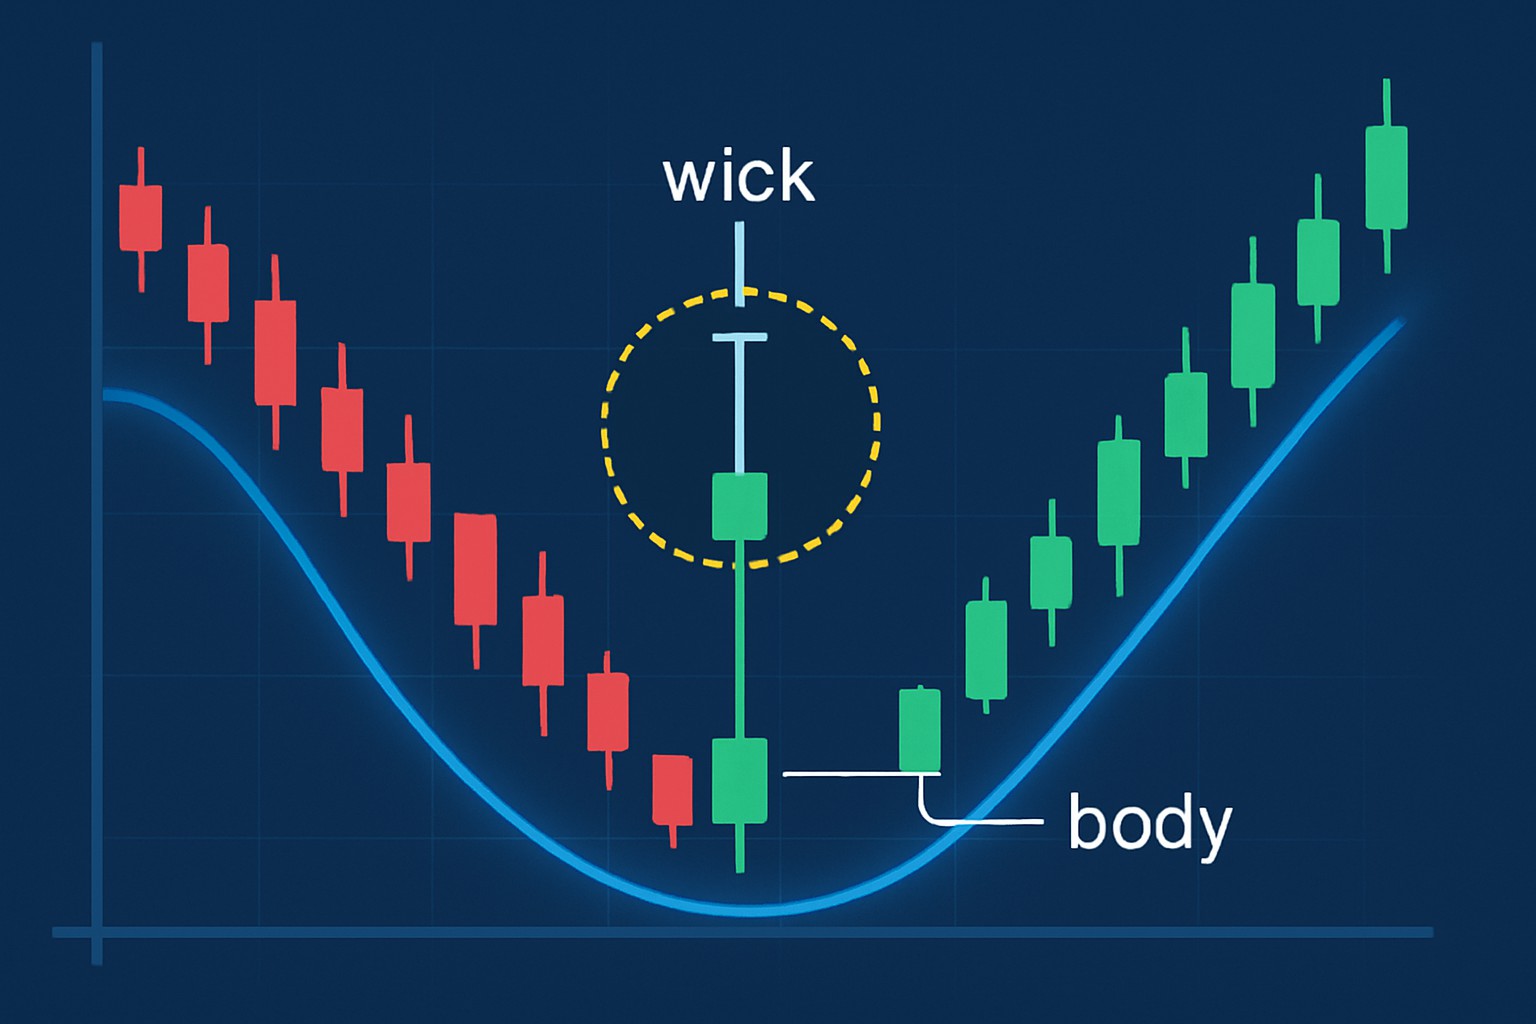
An upside down hammer is a single candlestick pattern that appears during a downtrend and often hints at market hesitation or a possible reversal. It features a small real body near the lower end of the price range with a long upper wick that is generally at least twice as long as the body. It usually has little to no lower wick.
Visually, an upside down hammer looks like the classic hammer candle has taken a nosedive and flipped itself upside down. The traditional hammer is known for its long lower wick, while the upside down hammer sports an extended upper wick that really stands out. This similarity often causes mix-ups with other patterns like the shooting star, which can be a bit of a headache if you’re not careful. The real kicker is the context—it usually shows up after downtrends, unlike the shooting star that pops up following uptrends.
Spotting an upside down hammer takes a keen eye and patience with each candle and the overall market vibe. Whether you are glancing at daily, weekly or intraday charts, watch for that small body near the bottom paired with a long upper wick waving hello. You need to consider what came before and weigh the wick-to-body ratio carefully.
Make sure the market is actually in a downtrend or bearish phase before this pattern appears. There is no point calling it too early.
Keep an eye out for a candlestick with a very long upper wick that is at least twice as long as its real body because that is the giveaway.
Double-check that the real body is small and snug close to the bottom of the candle's total range as if it is barely holding on.
Confirm there is little or no lower wick. This usually means sellers kept the pressure on without any relief.
Whenever you can, watch for volume spikes since they add muscle to the pattern's importance.
Pay close attention to where this candle appears in the trend because patterns near key support levels often have a bigger impact.
Timeframes play a vital role when reading upside down hammers. On daily charts these signals hold up better than on super short intraday charts where noise is like trying to hear a whisper at a rock concert. Weekly charts smooth out bumps and jolts but might sweep some shorter-term signals under the rug. The bigger picture is the overall trend strength and nearby support or resistance levels that can change how much weight you give this pattern.

Example of an upside down hammer candlestick pattern appearing after a downtrend on a typical trading chart.
The psychology behind the upside down hammer really boils down to the tug-of-war between buyers and sellers. That long upper wick? It tells a story of buyers trying their best to push prices higher, only to have sellers swoop back in and drag the close near the lows.
The upside down hammer looks like a cautious buyer who gave prices a gentle nudge upward but then quickly ran out of steam. It’s as if the sellers still hold the cards in this tug-of-war for control.
Many traders see the upside down hammer as a bullish signal mainly because of its eye-catching upper wick. But in reality it usually tells a different story—one where sellers have snatched the reins despite buyers' first attempts to push upward. This pattern often points to ongoing bearish pressure or a breather rather than a straightforward reversal.
Traders often like to have a few extra voices chiming in before fully trusting the upside down hammer. They usually lean on volume data and support and resistance levels along with RSI or moving averages to either give the green light or wave off the trade setups hinted at by this pattern.
Waiting for confirmation after spotting an upside down hammer is pretty vital before diving into any trading moves. Usually, a confirming sign could be a bearish candle popping up right after the pattern or a break below those all-important support levels.
Let us dive into some real market charts where the upside down hammer makes its cameo. We will check out situations when this pattern pops up following a clear downtrend and take a closer peek at how the market behaves in the candles that come after.

Side-by-side examples of upside down hammer patterns in different markets including stocks, forex, and cryptocurrencies.
Upside down hammers often pop up near technical resistance levels signaling an uneasy pause before prices either take a dive or settle into sideways action. In the forex realm you’ll spot similar patterns after a sharp drop in currency pairs usually followed by sideways trading or quick pullbacks that keep traders on their toes. When it comes to cryptocurrencies and those rollercoaster rides we all love, upside down hammers tend to show up amid wild price swings as handy short-term warning flags. Seeing this pattern crop up across different asset classes really underscores how versatile it is.
Many traders trip up when spotting the upside down hammer by overlooking the prior trend or misjudging the wick lengths. They often confuse it with other similar candlestick patterns.
Steer clear of these errors by starting with stepping back and looking at the bigger trend, making sure you carefully double-check the pattern’s features. I’ve found it really helps to blend candlestick analysis with volume and other technical indicators—kind of like getting a second opinion before making a call.
Including the upside down hammer in your trading plan takes more than just spotting the candle. You’ve got to keep your wits about risk management, nail down your entry and exit points and watch for confirmation signals.
Keep an eye out for the upside down hammer right after a solid downtrend because you want to make sure the context is spot on.
Don’t just rely on that pattern alone. Double-check it with other trusty indicators like volume or RSI to back up your hunch.
Jump in at the open of the candle following the upside down hammer only if you get bearish confirmation to seal the deal.
Always set a stop loss just above the upper wick since it acts as your safety net against unexpected price spikes.
Manage your risk like a pro by sizing your position to keep losses in check with your overall portfolio so you stay in the game.
Having an exit strategy matters. Set target price levels or watch for signs the trend might flip before you close out the trade.
Using the upside down hammer effectively calls for patience and discipline. No candlestick pattern can guarantee profits but when you pair it with solid risk management and confirmation signals it usually boosts trade quality.

Struggling to improve your trading performance? Edgewonk's advanced analytics tools are designed to give you the edge you need.
With detailed trade journaling, robust strategy analysis, and psychological insights, you'll gain a comprehensive understanding of your strengths and weaknesses. Don't miss out on this game-changing opportunity.

With 20 years experience in commodity trading, Jasper provides insights into energy markets, precious metals, and agricultural futures with a focus on macroeconomic trends.
Read PostsDiscover how inside bar patterns signal key market pauses and possible breakouts or reversals. This...
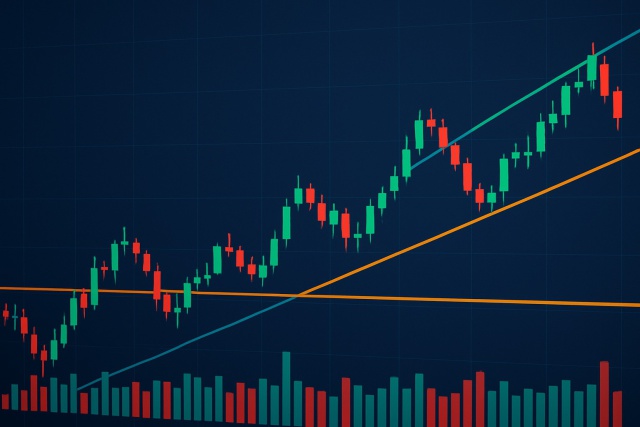
Trend lines are essential tools in technical analysis that help traders identify market direction an...

Discover how to recognize the evening star candlestick pattern—a powerful signal highlighting potent...

Learn how the True Range indicator captures market volatility and price swings, empowering traders t...