


Technical Analysis
Using The True Range Indicator To Spot Price Swings
Learn how the True Range indicator captures market volatility and price swings, empowering traders t...
This article breaks down how to read reverse hammer candles and gives you a leg up to make smarter trading decisions.
Candlestick patterns offer traders handy visual clues about where market sentiment and price movements might be headed. The reverse hammer candle tends to stand out, often grabbing attention as a potential sign of trend reversals. Catching these reverse hammer candles on your charts can really help traders jump in at just the right moment, making it that much easier to spot possible buying or selling opportunities.
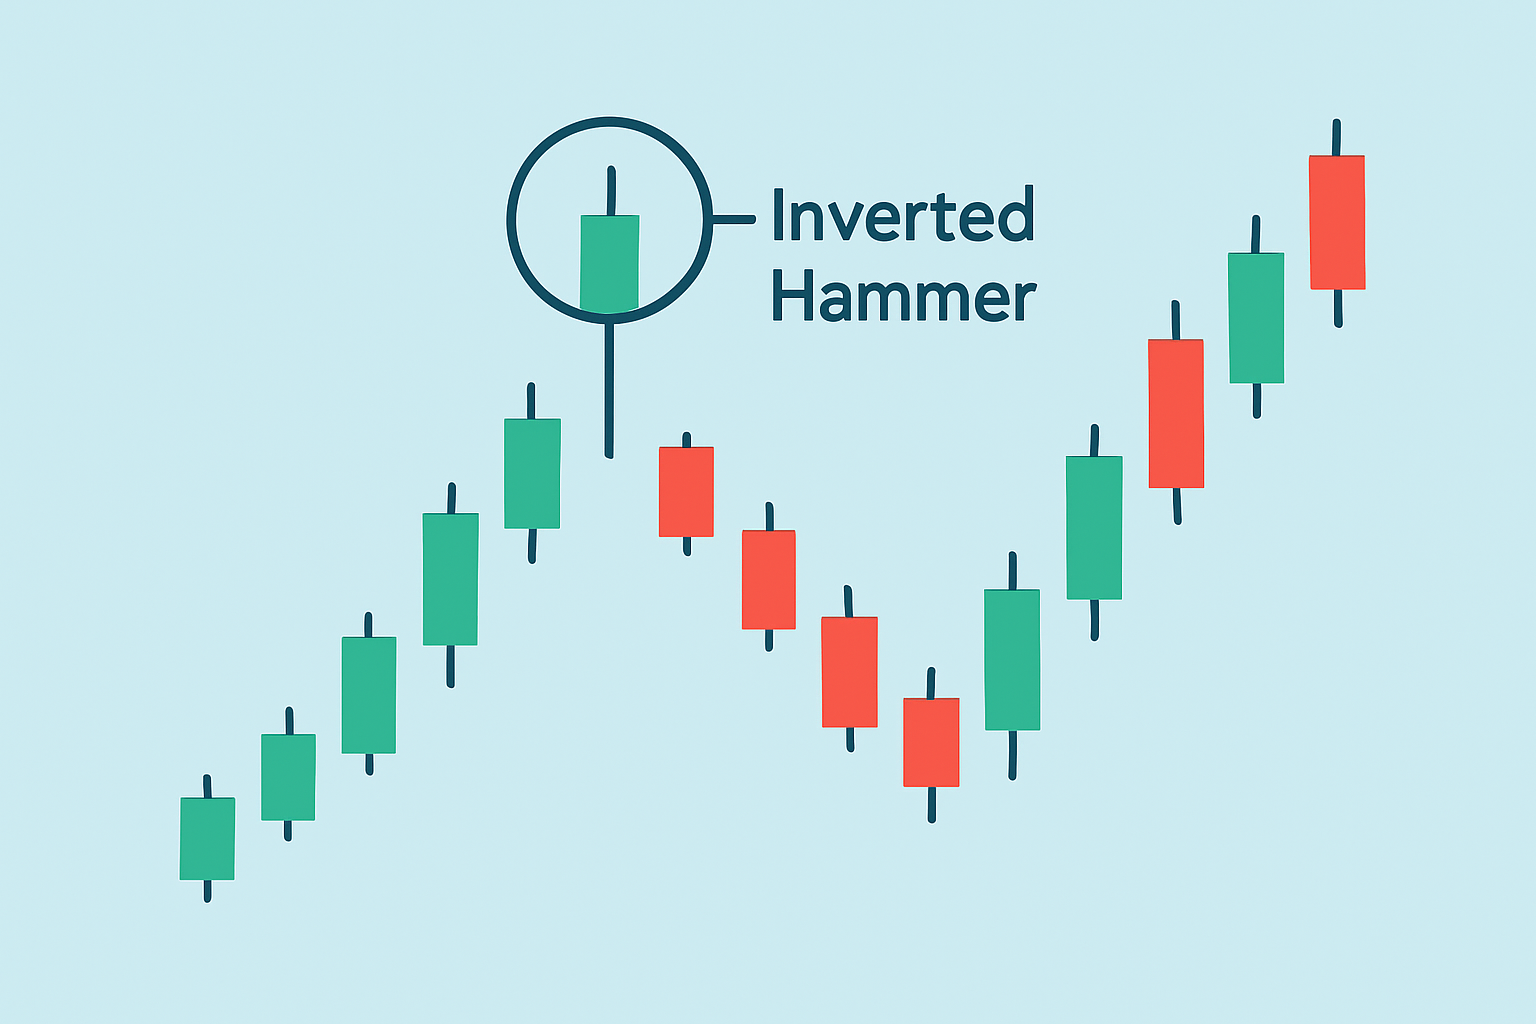
A reverse hammer candle has a quirky little real body that tends to hang near the bottom. It is topped with a long upper shadow and barely any lower shadow to speak of. If you picture it, it’s like an upside-down 'T' and clearly different from the regular hammer candle which sports a long lower shadow instead.
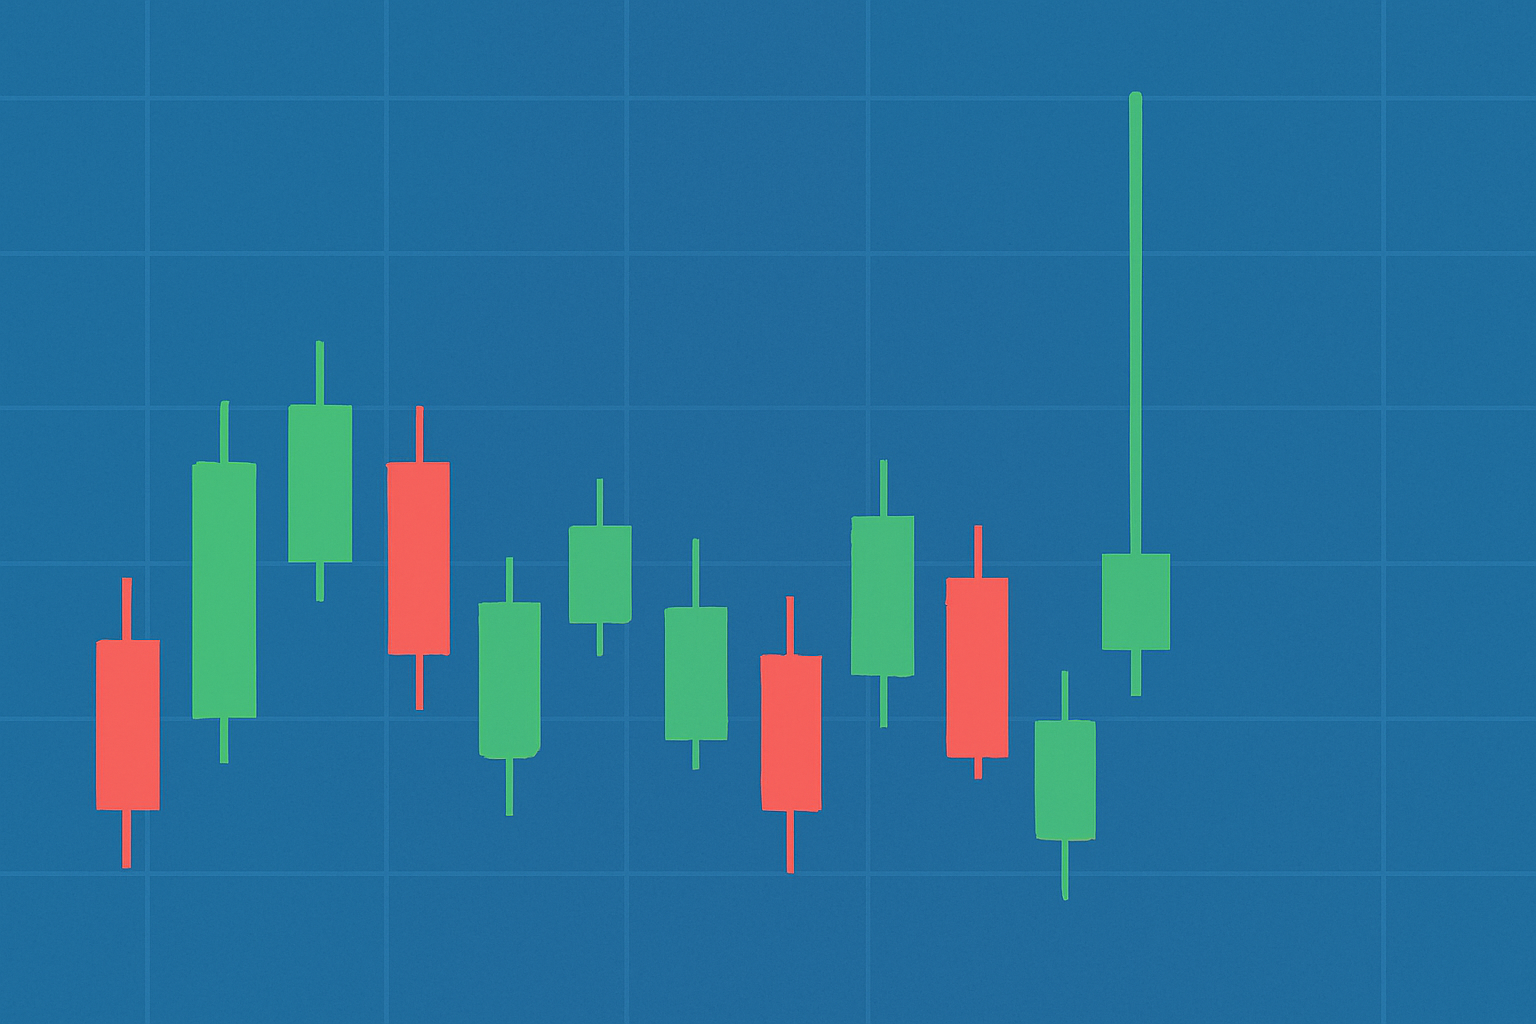
Illustration of a reverse hammer candle highlighting its long upper shadow and small real body near the bottom.
Reverse hammer candles often pop up when the market is giving a subtle nudge back against rising prices, usually waving a little flag for a possible reversal or at least a breather in a downtrend. They capture that classic trader uncertainty and softly whisper about a shift in momentum.
Spotting a reverse hammer candle is about paying close attention to its shape and the length of its shadows. It also requires noticing where it appears in relation to recent price moves.
Spot a candle with a small real body hanging out near the lower end of the price range. There is no need to chase the fancy ones.
Make sure the upper wick is at least twice as long as the body, kind of like a tall hat on a tiny figure.
Confirm there is little to no lower wick or shadow because less clutter means a clearer signal.
Check that the candle shows up right after a price drop or during a downtrend as if it is quietly waving a flag.
Look for a boost in trading volume to back up that strong market rejection. Think of volume as the crowd cheering or booing.
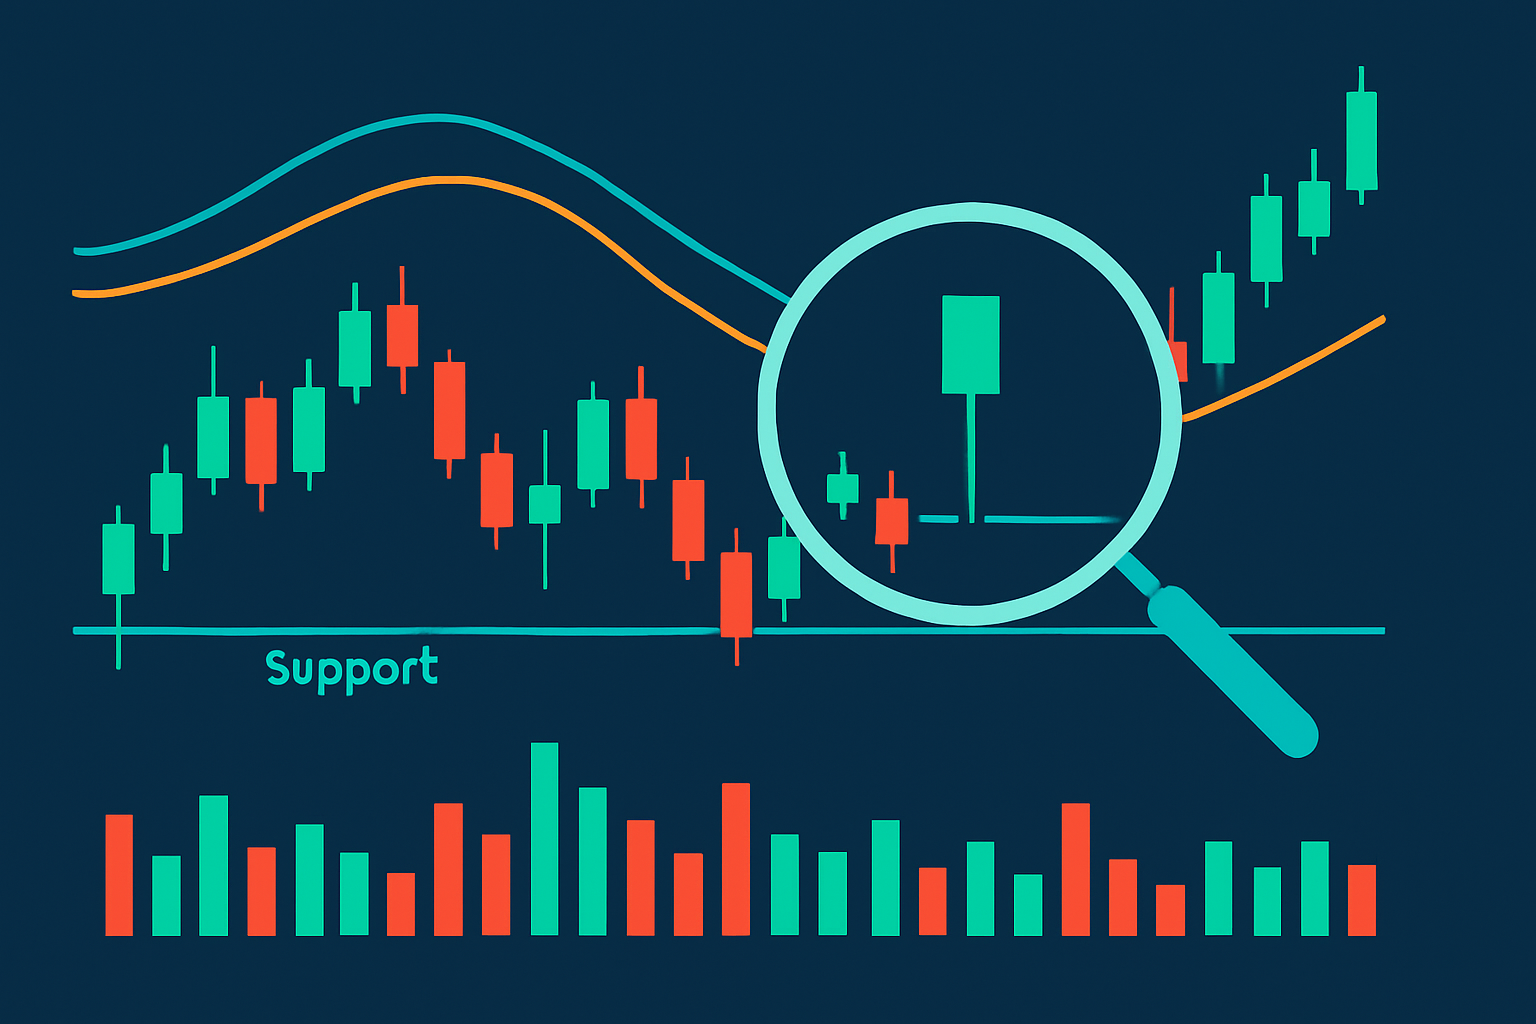
Keep an eye on where the candle sits in relation to key support or resistance levels on the chart since it’s all about context in the end.
Annotated chart illustrating each step of identifying a reverse hammer candle within a downtrend.
Reverse hammer candles often hint at a bullish reversal when they show up after a downtrend, though sometimes they’re more like a heads-up—signaling a pause or a slowdown in the momentum during an uptrend. It really boils down to the context.
Combining reverse hammer candle signals with support and resistance levels, volume analysis and RSI and moving averages can help traders see the bigger picture and confirm reversals confidently.
| Indicator | Role | How it Confirms or Refutes Reverse Hammer Signal |
|---|---|---|
| Support & Resistance | Highlights key price levels | The reversal signal tends to pack more punch when the reverse hammer shows up near these key levels |
| Volume | Reflects market activity | A spike in volume on the reverse hammer candle usually lends some serious weight to the signal |
| RSI (Relative Strength Index) | Indicates overbought or oversold states | When you see bullish divergence near the reverse hammer, it often backs up the reversal story quite nicely |
| Moving Averages | Smooths price movements to spot trends | If the price crosses moving averages right after a reverse hammer, it’s a pretty solid nod to shifting momentum |
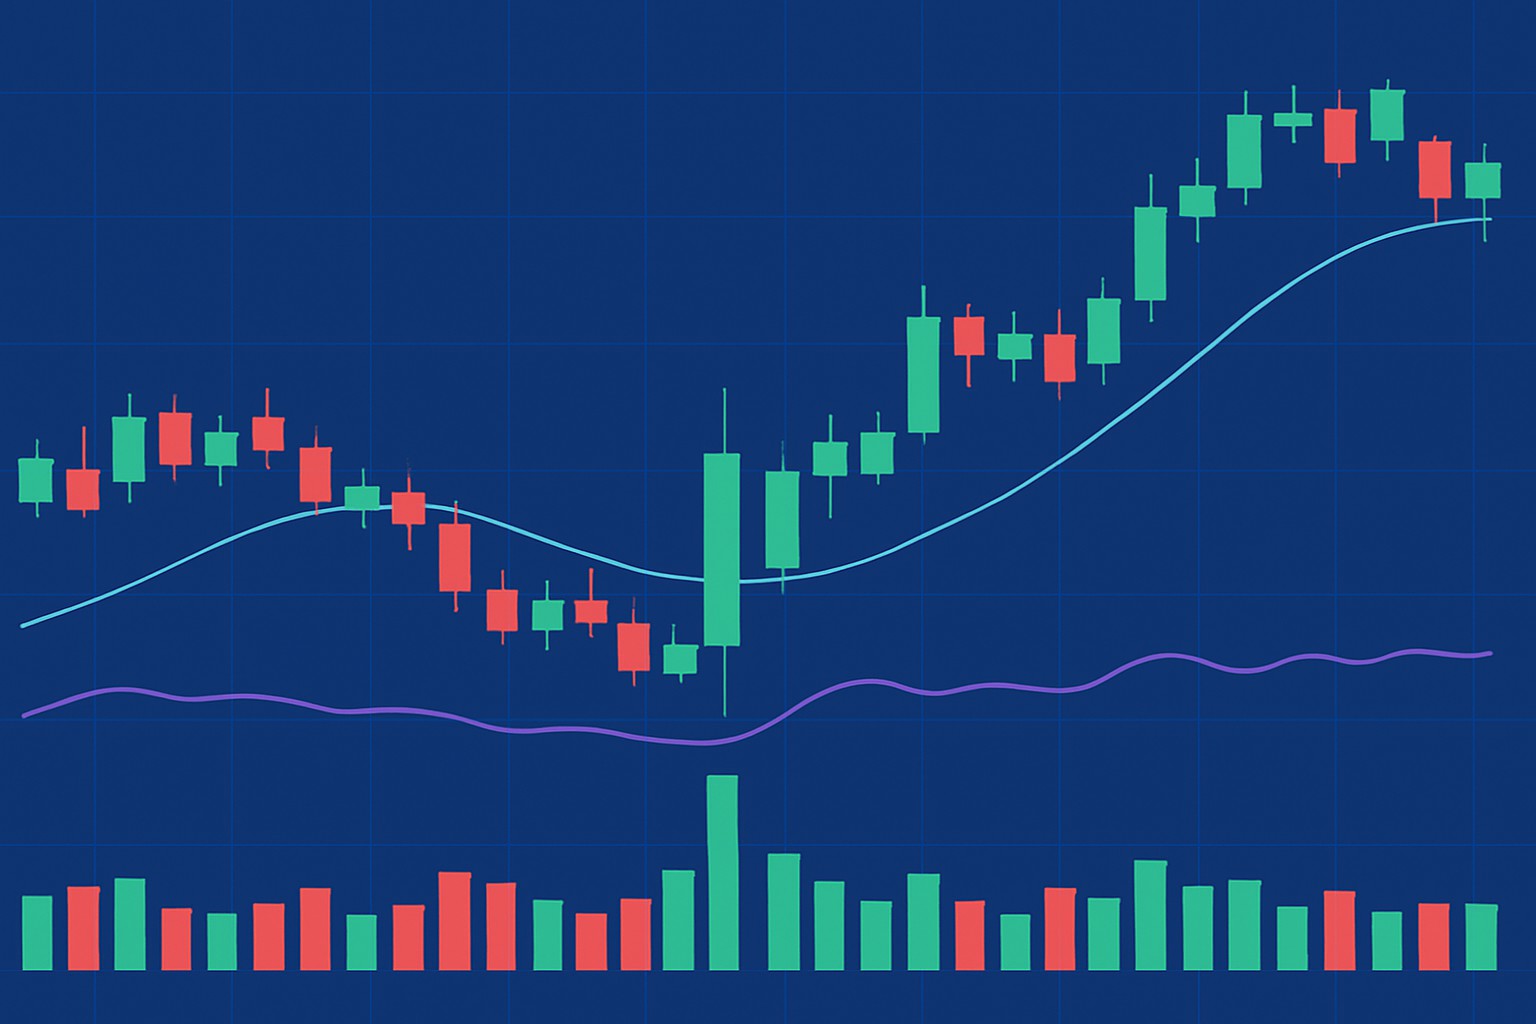
Picture this: a stock sliding steadily downwards when suddenly a reverse hammer pops up right near a well-worn support level, and volume starts to tick up. It’s often a subtle hint that buyers are cautiously testing the waters, feeling out the market floor. If the next candle manages to close higher, you’ll often find traders gaining a bit more confidence to jump into long positions. Flip the script to an uptrend if a reverse hammer shows up close to resistance and the RSI is dropping, that usually signals a short-lived pullback.
Example of a reverse hammer candle forming at a support level with corresponding high volume.
Spot that downtrend on the chart heading into the candle. It is like the calm before the storm.
Hunt down the reverse hammer which usually has a long upper wick and a small body. It is like a little signal waving frantically.
Keep an eye out for a bump in trading volume to support what the pattern is telling you.
Double-check with other technical signals such as RSI divergence or being near a solid support level. It is like getting a second opinion from a trusted friend.
Play it safe by watching the very next candle for confirmation before jumping into a trade. Patience often pays off here.
Many traders often get tripped up by reverse hammer candles, especially when they forget to check the bigger picture—things like the overall trend or volume confirmation.
Really get the hang of trading reverse hammer candles by mixing candlestick analysis with other strategies and setting clear stop-loss orders. Keep your profit goals grounded in reality.

Struggling to improve your trading performance? Edgewonk's advanced analytics tools are designed to give you the edge you need.
With detailed trade journaling, robust strategy analysis, and psychological insights, you'll gain a comprehensive understanding of your strengths and weaknesses. Don't miss out on this game-changing opportunity.

Driven by a passion for democratizing financial markets, he creates accessible trading education content that bridges the gap between complex strategies and retail investors.
Read PostsLearn how the True Range indicator captures market volatility and price swings, empowering traders t...

Master the momentum indicator to gauge price speed and trend strength. This ultimate guide covers ca...

Hidden bullish divergence is a key technical indicator revealing strong buying pressure beneath unce...
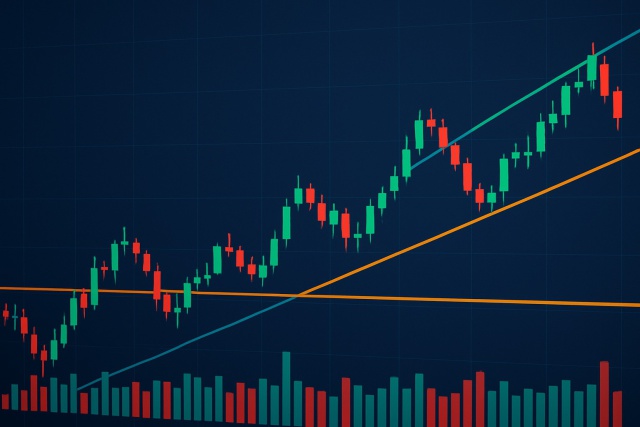
Trend lines are essential tools in technical analysis that help traders identify market direction an...