


Technical Analysis
Inside Bar Pattern To Spot Breakouts And Reversals
Discover how inside bar patterns signal key market pauses and possible breakouts or reversals. This...
The head and shoulders chart pattern is a classic, trusty reversal pattern that many traders swear by in technical analysis. If you’re just dipping your toes into the world of chart patterns or starting to make sense of them, this article will walk you through spotting this pattern with ease.
We will dive into the main components of the head and shoulders chart pattern, breaking down each part in plain straightforward terms that won’t make your head spin. Along the way, you’ll discover why this pattern has won over so many traders.
The head and shoulders chart pattern is one of those classic setups in technical analysis that tends to signal an upcoming trend reversal—kind of like a reliable old friend waving a warning flag. It’s made up of three peaks: the middle one stands tall as the "head," flanked by two shorter peaks on either side that play the part of the "shoulders."
There are two main types that you really want to keep on your radar. The standard or bearish head and shoulders pattern usually hints at a shift from an uptrend heading south to a downtrend. On the flip side, the inverse or bullish head and shoulders often points to a possible bounce back from a downtrend to an uptrend.
Traders and analysts often lean on the trusty head and shoulders chart pattern because it usually gives a heads-up about an upcoming reversal, be it downwards or upwards.
The psychology behind the head and shoulders pattern is closely tied to the ebb and flow of supply and demand. Buyers initially take the reins and push the price upward to form the left shoulder. As the price reaches a peak, sellers begin to creep in and nudge it back a bit. Then buyers muster a stronger rally that creates the more pronounced peak known as the head. However, just when you might expect the momentum to continue, sellers ramp up their efforts leading to a lower high—the right shoulder. Volume often drops off during this right shoulder, quietly signaling that buyer enthusiasm is waning.
"The head and shoulders pattern is like a visual tug-of-war between buyers and sellers, capturing the moment when the bulls start to lose steam and the bears begin to seize control. It often serves as a pretty reliable heads-up that a trend reversal might be just around the corner."
Recognizing the head and shoulders pattern calls for a bit of patience and a sharp eye think of it like spotting a familiar face in a crowd. This guide is tailored for beginners, breaking down each piece so you can confidently pinpoint it on just about any chart.
Make sure there is a clear uptrend leading into the pattern if it is a classic head and shoulders or a downtrend if you are dealing with an inverse one. This pattern usually signals a reversal.
Pinpoint the peak of the left shoulder and its drop. Think of this as your first major clue in the unfolding story.
Keep an eye out for a higher peak above the left shoulder which forms the head and then declines. This part sets the stage.
The right shoulder is a lower peak roughly the same height as the left shoulder. It hints that momentum is running out of steam.
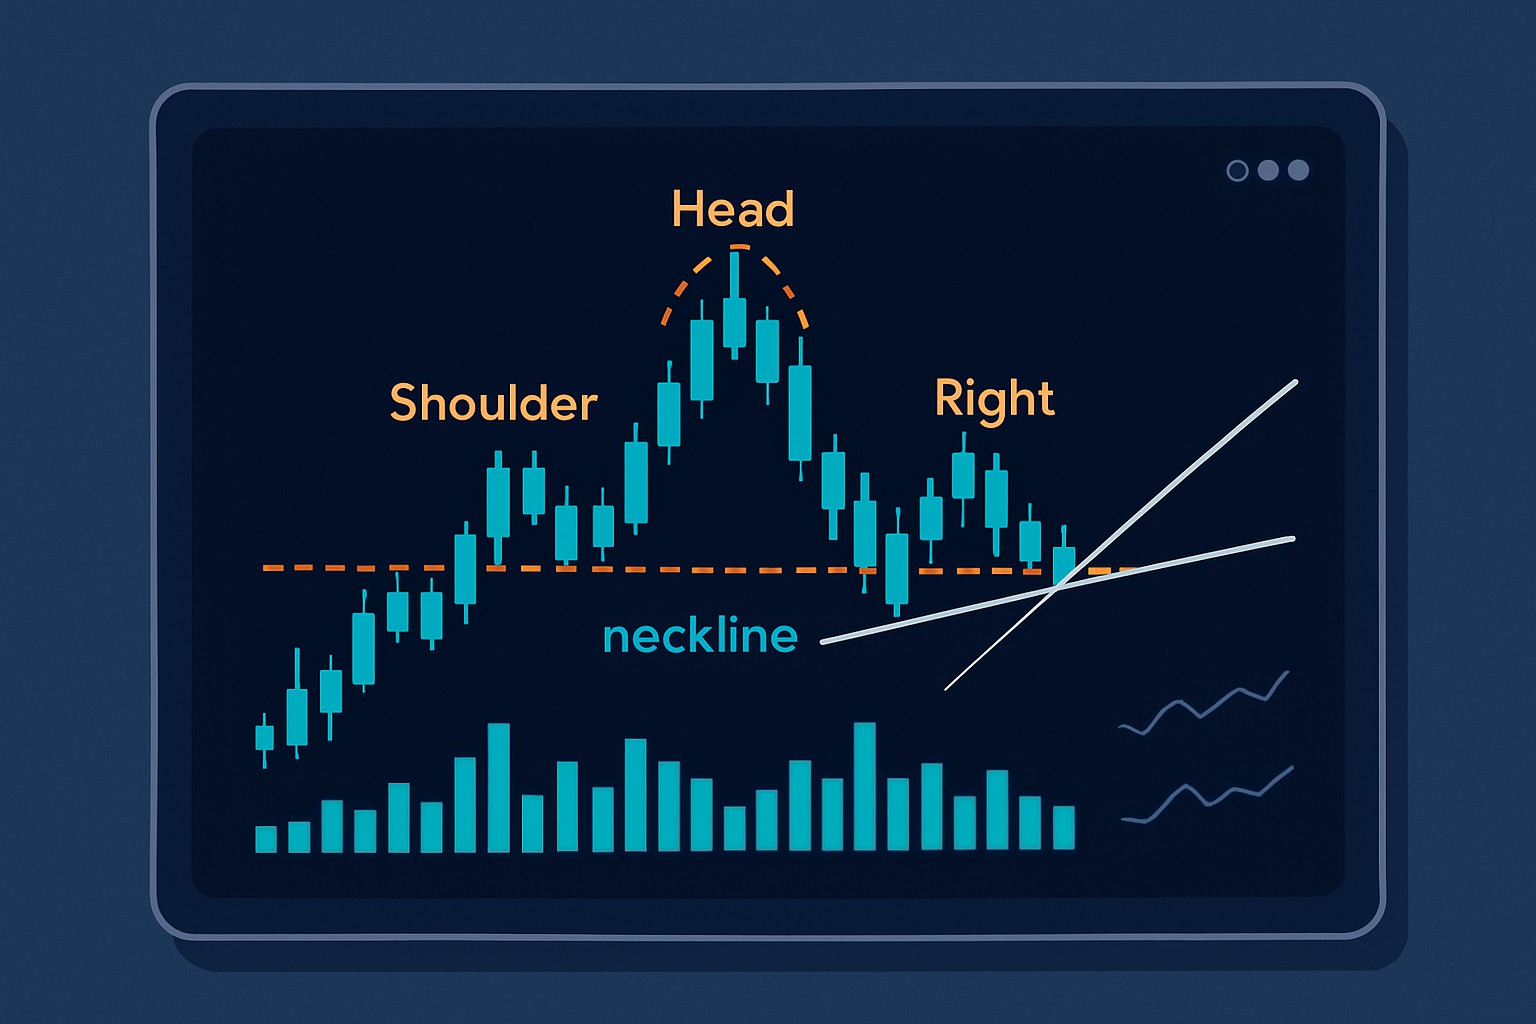
Draw the neckline by connecting the low points between the shoulders and the head. This line serves as your confirmation checkpoint.
Pay attention to volume trends. Typically, volume hits a high at the left shoulder and head but dips during the right shoulder, which supports the pattern's credibility.
Confirm the pattern when the price breaks below the neckline with rising volume. This signals that the trend might be shifting gears.
Be careful not to jump to conclusions by calling every peak a shoulder or head. Price action can throw some pretty quirky shapes at you—often they look familiar but don’t quite fit the usual pattern.

Annotated example of a bearish head and shoulders chart pattern demonstrating all key components on a candlestick chart
Visually the head and shoulders pattern stands out because of its distinct triple peak shape—hard to miss once you know what to look for. In the classic version the peaks climb higher with each rise. The inverse flips the script completely by showing troughs that form the head and shoulders instead. Some charts can get a bit fancy by throwing in extra shoulders or sloping necklines that keep you on your toes.

Comparison of standard and inverse head and shoulders patterns with annotations highlighting the key differences
Traders often keep an eye on the head and shoulders pattern to better time their entries and exits, leaning on the neckline breakout as a trusty signal.
Hold off until you see a clear sign of confirmation, like the price breaking cleanly through the neckline on noticeably higher volume. Do not jump the gun.
Set your entry orders just below the breakout point if you are working with a standard pattern or just above it if it is inverted. This way, you’ll be positioned to catch the new trend as it starts.
Figure out a price target by measuring the vertical distance between the head and neckline and then projecting that same distance upward or downward from the breakout. It’s a neat little trick that helps keep your goals grounded.
Place a stop-loss order just above the opposite shoulder in a standard pattern or below it for an inverse one. This acts as your safety net to manage risk without worrying about every tick.
Keep a keen eye on volume and momentum indicators because they’re your best friends for confirming the breakout’s strength and adjusting your trade as things evolve.
Applying disciplined risk management is absolutely key. It’s usually best to resist the urge to jump into trades too quickly. Breakouts can be tricky—they often fail or the volume might stay weak, giving off signals that can easily lead you astray.
Many new traders often take the head and shoulders pattern for just random price swings or half-baked shapes. It’s easy to overlook vital details like volume and the neckline’s angle, which can lead to some pretty costly misunderstandings.
Steer clear of common pitfalls by taking a good, hard look at your charts and double-checking every little detail before weaving the pattern into your trading strategy. It’s worth taking your time here—patience pays off.
Getting better at spotting the head and shoulders chart pattern means bringing in a few trusty sidekicks like moving averages, RSI and volume-based indicators.

Tired of missing opportunities and making suboptimal trading decisions? TrendSpider's cutting-edge platform automates complex technical analysis, saving you time and reducing human error.
With multi-timeframe analysis, dynamic alerts, backtesting, and customizable charting, you'll gain a competitive edge in identifying trends and making informed trades across global markets.

Transforming the field of forex trading through his systematic approach to currency pair analysis, he focuses on macroeconomic indicators and central bank policy impacts.
Read PostsDiscover how inside bar patterns signal key market pauses and possible breakouts or reversals. This...

Master the momentum indicator to gauge price speed and trend strength. This ultimate guide covers ca...

Discover the wedge falling pattern's secrets and learn step-by-step how to trade this powerful techn...

Hidden bullish divergence is a key technical indicator revealing strong buying pressure beneath unce...