


Technical Analysis
How to Trade Using a Bollinger Bands Strategy
Master trading with Bollinger Bands by understanding volatility, setup patterns, and risk management...
Orderblocks are those key areas on price charts where the big institutional players have placed their hefty buy or sell orders.
An orderblock is basically a well-defined price area where big institutional players have dropped sizable buy or sell orders. This kind of hustle creates a pretty noticeable supply or demand zone in the market. Usually, these zones pop up just before a strong price move.
Unlike the usual support and resistance lines individuals draw from past highs or lows or those neat round numbers, orderblocks dig deeper into the clever world of institutional order flow. These spots highlight where the so-called smart money tends to gather and often show up as clusters of hefty candlesticks right before price decides to make a notable move.
Trading near orderblocks brings a few perks like a better shot at catching a price bounce and clearer boundaries for managing risk. It also offers a sneak peek into where the big players might be throwing their chips.
Orderblocks often act like the footprints left behind by the market’s biggest players. Once you get the hang of reading them, they can offer some pretty handy clues about where the price might be headed next—sort of like having a sneak peek backstage.
Spotting orderblock zones is really about tuning into the rhythm of the market structure and keeping an eye out for strong bullish or bearish candles that often shout out institutional activity. It also involves noticing the little consolidation or pause phases that sneak in before big price moves.
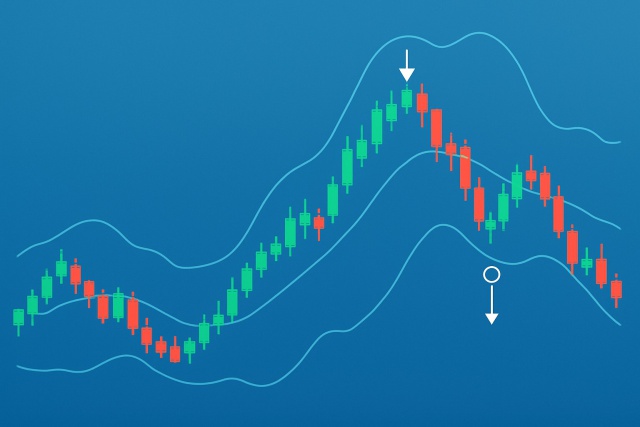
Keep an eye out for recent noteworthy swing highs and swing lows on the price chart. These are your key decision zones and often where the market catches its breath.
Look for sharp, decisive price moves away from these swings that hint at heavy-handed buying or selling. Think of it as the market showing its true colors.
Circle those clusters of candles where price seems to take a little breather or consolidates before making a sudden move. These pockets often tell a bigger story.
Double-check that your potential orderblock aligns with the current trend direction. This step is vital to confirm genuine institutional interest rather than a false alarm.
Back up your hunch by spotting volume spikes or pairing the zone with other technical signals. It is like having a buddy system to boost your confidence before making the call.
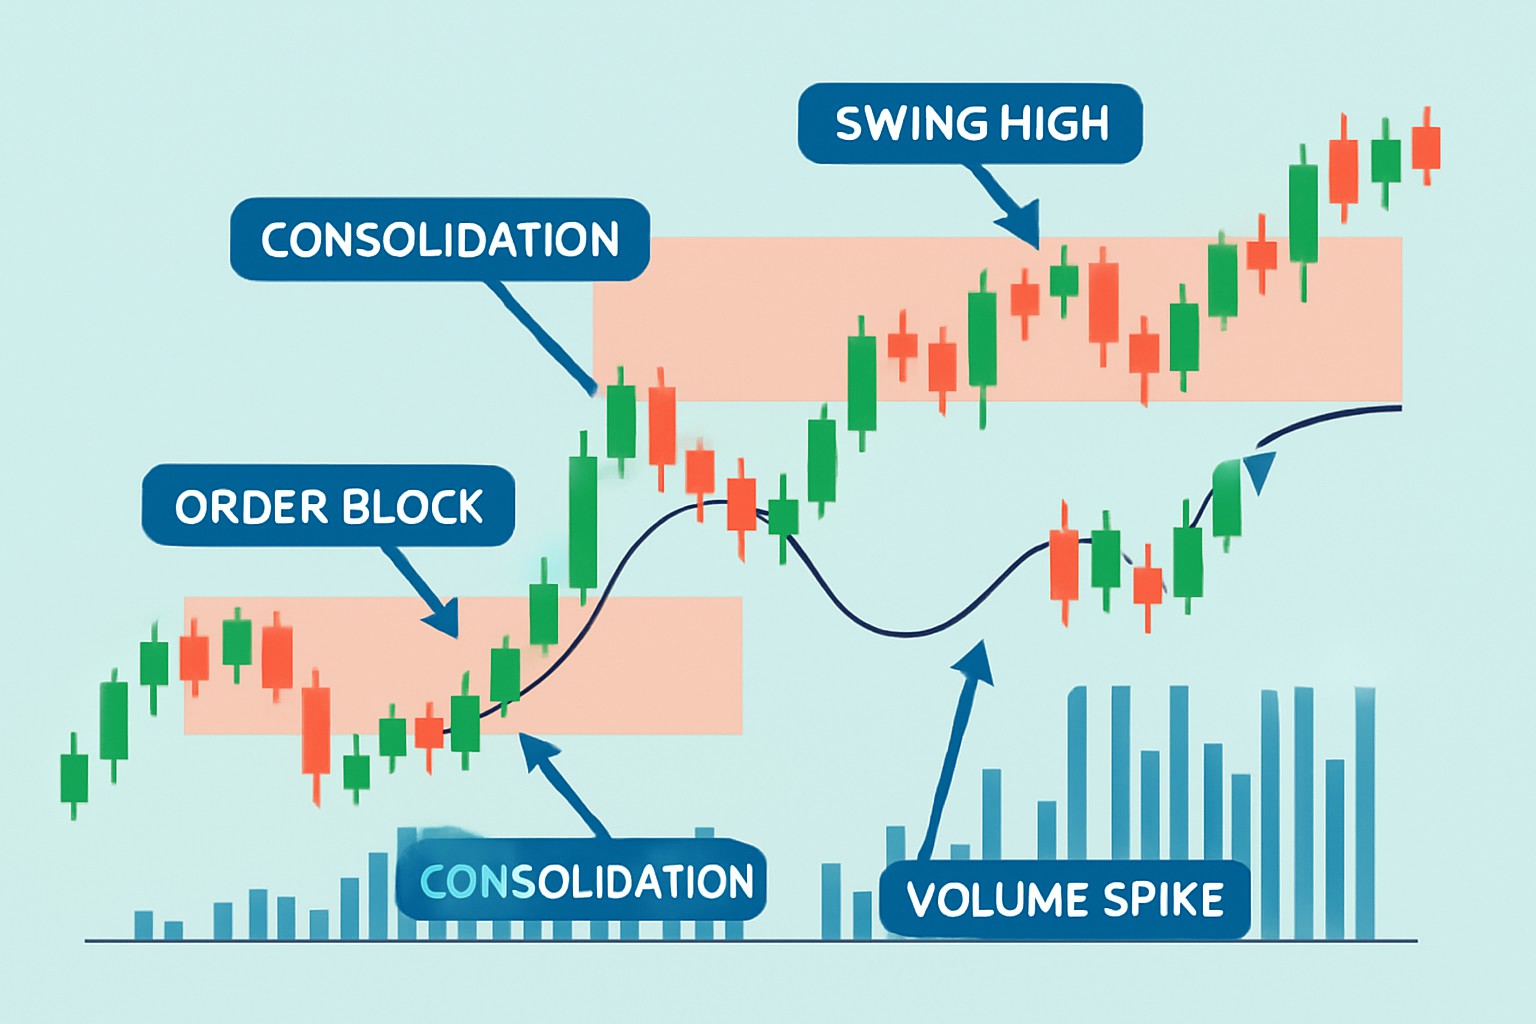
Start by zooming out to catch key swing points. These are spots where the price paused or reversed direction. Next, identify where a strong price move began, often marked by a large bullish or bearish candle breaking out of consolidation as if breaking free. Pay close attention to the price action just before that move. These clusters of candles highlight potential orderblock zones where institutional orders gather. Make sure this aligns with the bigger trend because going against it usually involves extra risk.

Price chart illustrating highlighted orderblock zones identified by swing points, consolidation candles, and volume spikes.
A common slip-up is labeling weak support or resistance as orderblocks. Real orderblocks usually show clear signs of institutional activity like big untested candles or sharp volume spikes that catch your eye. It’s wise to avoid marking zones where the structure is fuzzy or price action overlaps like a messy dance. These spots rarely have enough punch to be trusted entry points.
When trading orderblock zones, timing your entry on a retest that shows confirming candlestick patterns can really make all the difference. I have found that placing stops just beyond the orderblock is a smart way to keep risk in check without feeling like you’re walking a tightrope. Don’t forget to take a good, hard look at the overall market context—it’s like reading the room before making a move.
It is a common misconception that orderblocks are a sure-fire ticket to price reversals or that every one will lead to a winning trade. In reality, orderblocks highlight zones where price is more likely to react but usually need some backup or extra confirmation to really shine.
Combining orderblocks with handy tools like trendlines and moving averages usually helps craft a solid trading strategy. When these factors overlap they tend to boost the reliability of trade signals and weed out pesky false setups.
| Technical Tool | How it Supports Orderblock Trading | Practical Example |
|---|---|---|
| Trendlines | Help confirm the trend direction and highlight key breakout points that align with orderblocks, making the whole picture a bit clearer | An orderblock near where price bounces off an upward trendline often points to a strong buying opportunity — those moments when everything just clicks |
| Moving Averages | Act like moving roadblocks or springboards, serving as dynamic support or resistance that bolster the orderblock area | When an orderblock coincides with the 50-day MA, it’s usually a shoutout to institutional interest lurking in the background |
| Fibonacci Retracements | Nail down likely pullback levels that often overlap with orderblock zones, kind of like nature’s own measuring tape | Price testing the 61.8% fib level, which lines up with an orderblock on the chart, often tells a story worth paying attention to |
| Volume Analysis | Reveal whether price moves inside orderblocks carry genuine muscle or are just all talk | A high volume spike during a bullish orderblock retest usually confirms buyers are seriously in the game |
| Candlestick Patterns | Provide that extra nudge of confidence with entry confirmation through rejection or continuation candles | Spotting a pin bar rejection at an orderblock often signals a prime entry moment — like the market quietly giving you a wink |
For instance, catching a bullish orderblock near an upward trendline and a retest close to the 50-day moving average often gives a solid signal to jump into a trade. When volume suddenly spikes and rejection candles confirm the move at this convergence, that’s usually a setup you can trust more than usual. Platforms like TradingView offer powerful charting tools and technical indicators. Similarly, TrendSpider’s automated pattern recognition and real-time alerts give traders a helpful nudge by quickly highlighting key confluences so decisions can be backed by data rather than gut feelings.

Are you tired of juggling multiple tools for your trading needs? TradingView is the all-in-one platform that streamlines your analysis and decision-making.
With its powerful charting capabilities, real-time data, and vibrant community, TradingView empowers traders like you to stay ahead of the market. Join thousands who trust TradingView for their trading success.

With 20 years experience in commodity trading, Jasper provides insights into energy markets, precious metals, and agricultural futures with a focus on macroeconomic trends.
Read PostsMaster trading with Bollinger Bands by understanding volatility, setup patterns, and risk management...

Discover the wedge falling pattern's secrets and learn step-by-step how to trade this powerful techn...

Discover how to recognize the evening star candlestick pattern—a powerful signal highlighting potent...

Master the momentum indicator to gauge price speed and trend strength. This ultimate guide covers ca...