


Technical Analysis
How to Trade a Wedge Falling Pattern
Discover the wedge falling pattern's secrets and learn step-by-step how to trade this powerful techn...
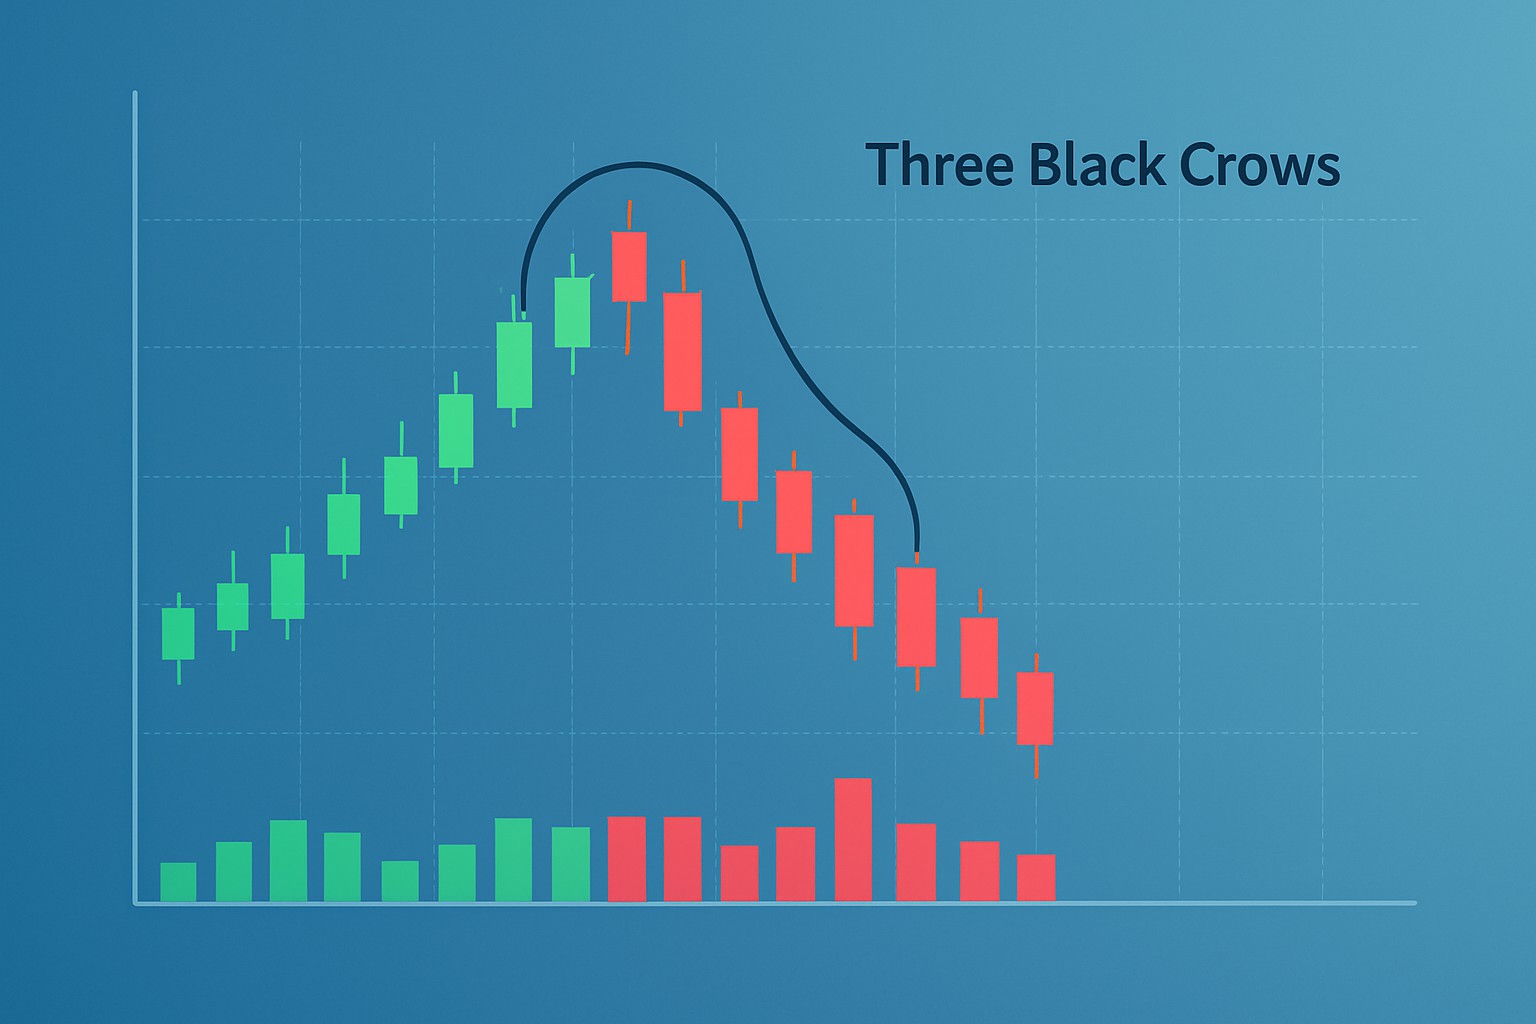
The 3 Black Crows pattern is a classic bearish reversal signal in technical analysis that grabs traders' attention. It’s like the market’s way of waving a red flag and hinting that a downturn might be just around the corner. We’ll walk through how this pattern takes shape, why it’s worth keeping on your radar and how to trade it with confidence.
The 3 Black Crows is a classic candlestick pattern consisting of three long bearish candles lined up one after the other. Each candle kicks off within the real body of the previous one and closes near its low, painting a clear picture of steady and relentless selling pressure.
This pattern is a clear sign of a bearish reversal since it shows a sharp and lasting shift in market mood. The bulls who had been pushing the price upward suddenly face serious selling pressure from the bears. Those steady downward closes don’t lie. Momentum has clearly shifted and often hints at a bigger drop just around the corner.
Candlestick charts have earned their stripes in the world of technical analysis by offering a crystal-clear snapshot of price movements over a set period. Each candlestick lays out the opening and closing prices as well as the highs and lows, making it much easier to catch on to market trends and patterns like the infamous 3 Black Crows.
Spot the 3 Black Crows pattern with a keen eye by looking for three bearish candles lined up one after the other, each ticking off specific criteria. You will typically see these bad boys appear right after an uptrend has had its moment. Each candle starts its journey within the body of the one before it and closes down near the low, usually with barely a lower wick in sight.
Make sure there’s been a clear uptrend. Think of it as the price steadily climbing uphill without too many stumbles along the way.
Keep an eye out for the first long bearish candle. It’s like the first sign that sellers have started to throw in their hats and step onto the scene.
Check that the second bearish candle opens within the body of the first and closes even lower. This detail tells you the selling pressure isn’t just a fluke, but is holding strong.
Watch for a third bearish candle following the same pattern. This pretty much seals the deal that the downward momentum is gathering real steam.
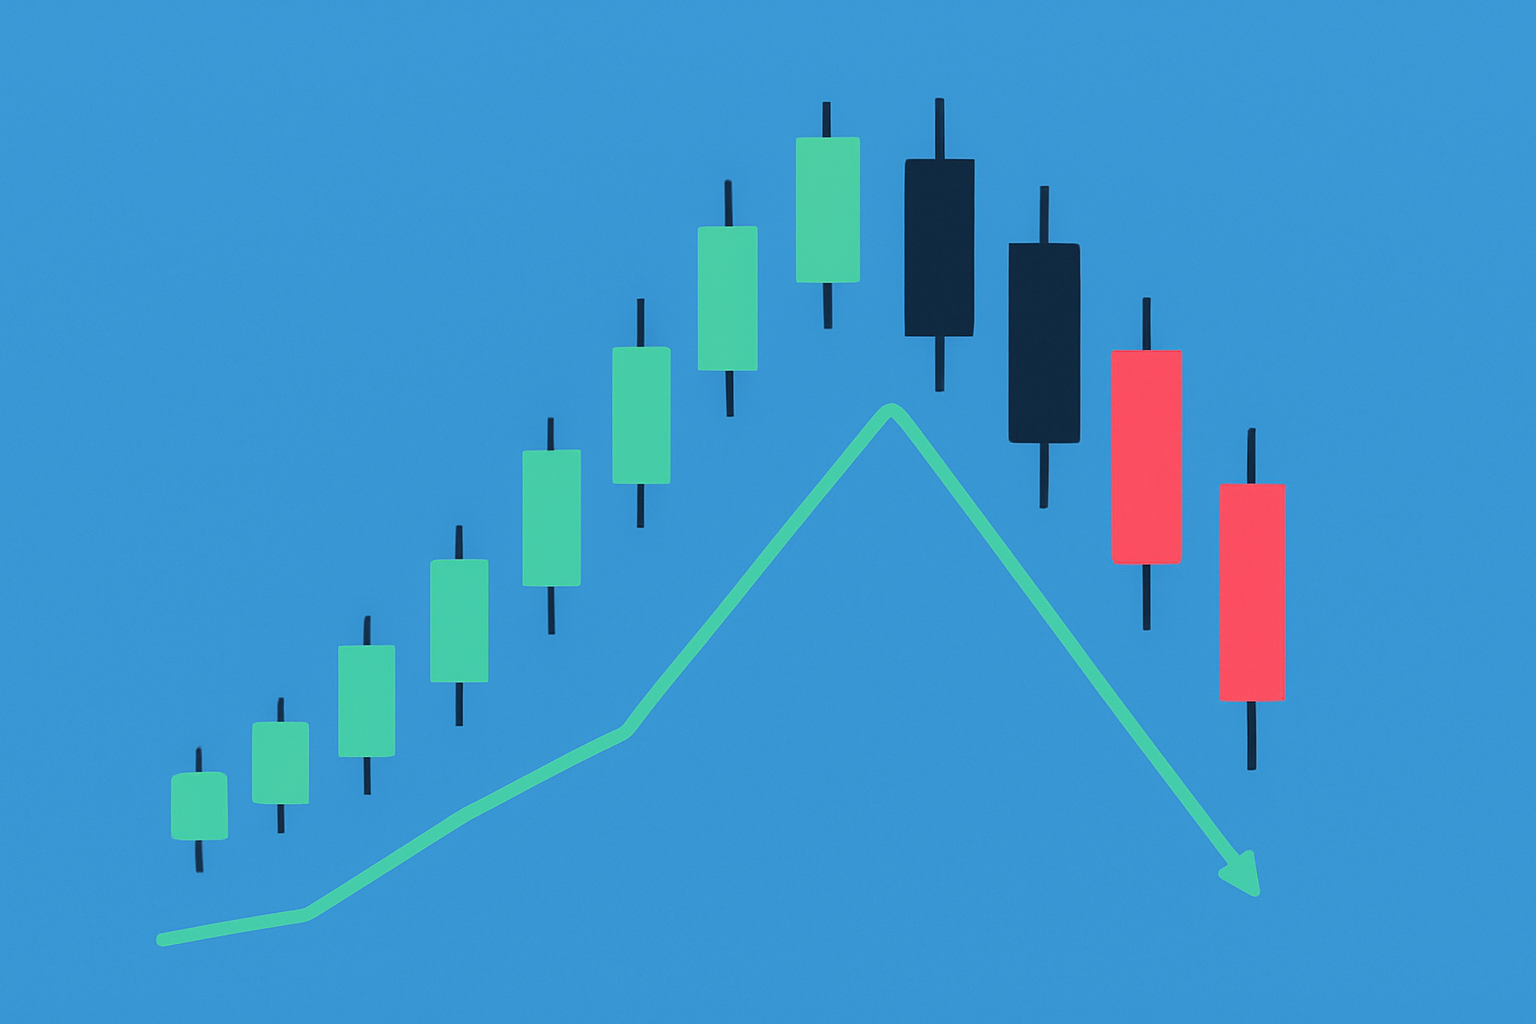
A candlestick chart illustrating the 3 Black Crows pattern with three consecutive bearish candles after an uptrend.
You might spot some subtle quirks like faint upper shadows or candles that seem a tad off in length. While these little oddities can sway how reliable the pattern feels, it’s worth resisting the urge to toss it out completely.
The 3 Black Crows pattern really paints a picture of the market mood turning sour, as sellers begin to take the reins from buyers.
This pattern is a handy tool for traders trying to manage risk, essentially flagging when a bearish reversal might be just around the corner helping them steer clear of jumping into long positions prematurely. It champions the idea of waiting for solid confirmation before making a move, which can save you from chasing after false alarms that often lead nowhere. When paired with other tools, it tends to boost confidence in your trading calls and fosters a disciplined rhythm for knowing exactly when to jump in or step out of the market.
Misunderstanding these points often leads to overconfidence or misuse of the 3 Black Crows pattern. Traders should remember that it’s just one tool in the toolbox and not a magic crystal ball. Factoring in volume and the overall trend plus other supporting indicators usually increases the odds of getting it right.
Adding the 3 Black Crows pattern to your trading plan generally starts with confirming the earlier trends. Then spot the pattern itself and plot your entry points, stop-loss levels and exit targets.
Make sure there’s a clear uptrend in play that seems to be running out of steam.
Keep an eye out for the 3 Black Crows pattern popping up right after that uptrend.
Double-check volume data or other momentum indicators to really confirm the bearish pressure is kicking in.
Jump into the trade just below the closing low of that third candle—timing’s key here.
Always place a stop-loss above the high of the first candle in the pattern to keep your risk in check.
Set your profit targets based on earlier support levels, or play it safe with trailing stops to lock in those gains.
Managing risk is absolutely vital when trading reversal patterns such as the 3 Black Crows. Without a proper stop order in place, pesky false breakouts or sudden market swings can sneak in and wipe out gains faster than you would like. Combining this pattern with trusty tools—think Binance for on-the-dot execution or TradingView for deep-dive technical analysis—lets you stay on your toes and react with a lot more confidence.
Traders often lean on a few extra tools to give their confidence a much-needed boost when spotting 3 Black Crows signals, helping to confirm that bearish momentum and overall market conditions are truly in play. These handy aids usually help cut through the noise, making it easier to tell genuine reversals from those pesky false alarms.
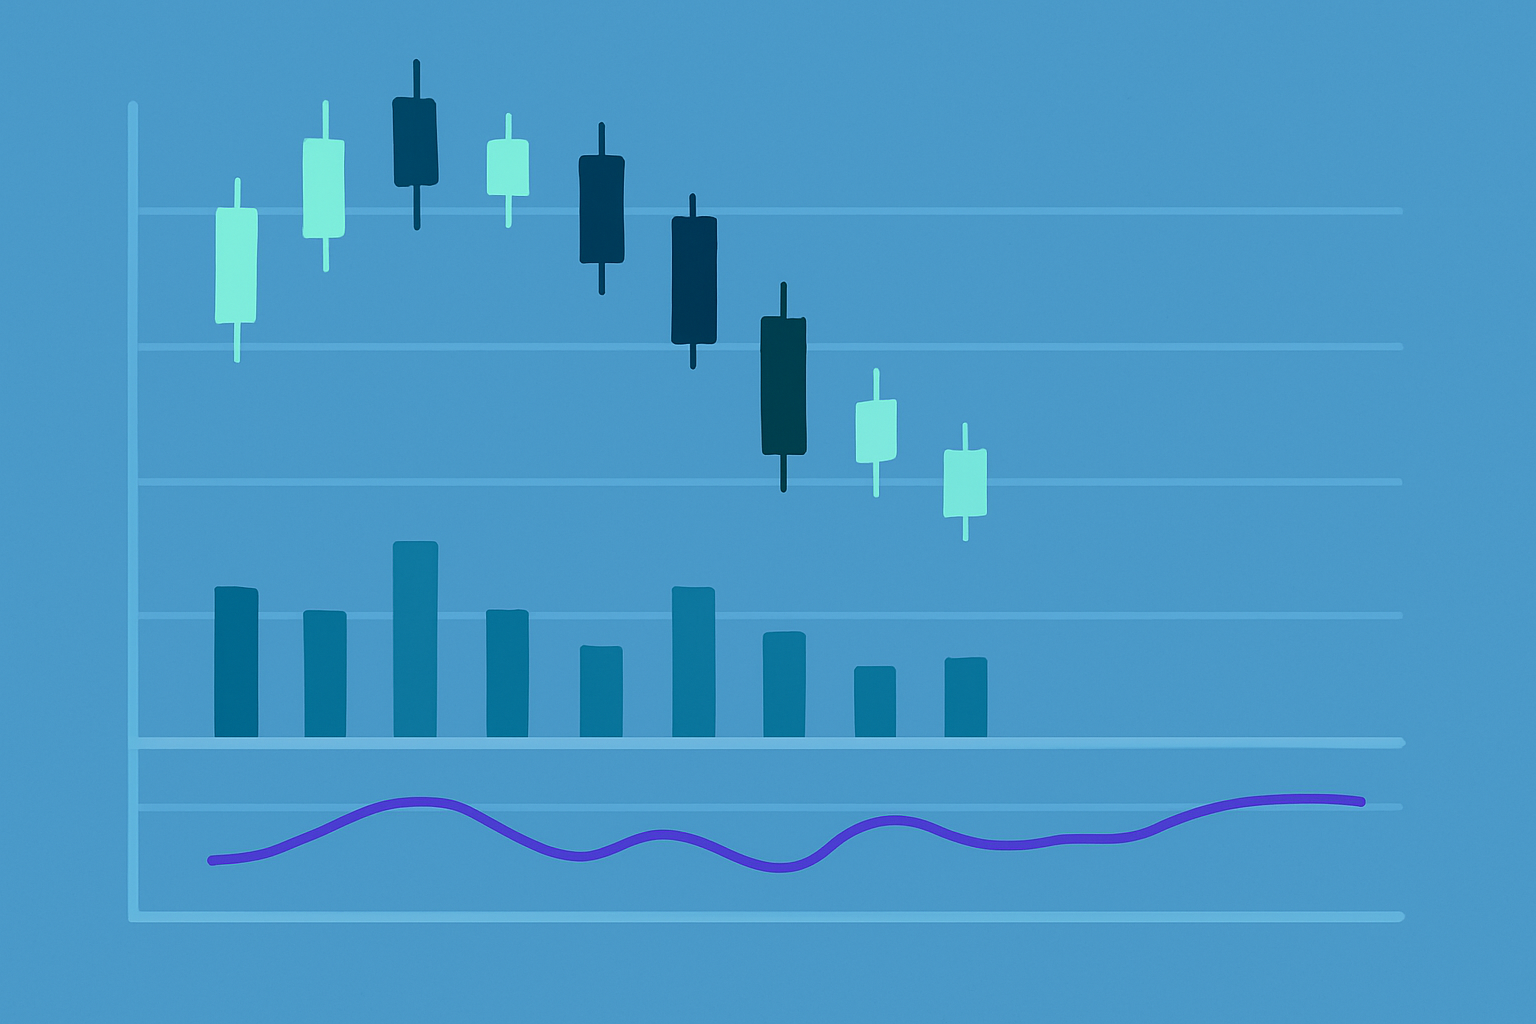
Trading chart integrating 3 Black Crows candlesticks with volume and RSI indicator confirming bearish momentum.
Taking a close look at real market examples can truly help deepen your grasp of the 3 Black Crows pattern and how it plays out in the wild.
These examples drive home some key takeaways worth remembering. Confirming volume spikes usually makes the pattern a lot more trustworthy—it's like getting a second opinion that you can’t ignore. Catching the pattern early on can seriously improve your chances of getting in at just the right moment. When you pair the pattern with solid support and resistance levels, it often helps you nail the timing of your trades a bit better. Platforms like TradingView are a blessing, making those patterns pop out crystal clear.
The 3 Black Crows pattern can serve as a handy heads-up for potential reversals, though it’s far from foolproof. It tends to throw out false alarms, especially when the market is stuck in a sideways shuffle or just meandering without a clear direction. This pattern on its own is a fast track to slip-ups.
For beginners getting comfortable with the 3 Black Crows pattern requires patience and trial and error because nobody nails it right away. It’s usually best to use this pattern with other indicators and stick to solid risk management. Keep your expectations grounded in reality. Starting with small trades and reviewing past charts can help build confidence and skill over time.

Are you tired of juggling multiple tools for your trading needs? TradingView is the all-in-one platform that streamlines your analysis and decision-making.
With its powerful charting capabilities, real-time data, and vibrant community, TradingView empowers traders like you to stay ahead of the market. Join thousands who trust TradingView for their trading success.

With 20 years experience in commodity trading, Jasper provides insights into energy markets, precious metals, and agricultural futures with a focus on macroeconomic trends.
Read PostsDiscover the wedge falling pattern's secrets and learn step-by-step how to trade this powerful techn...

Hidden bullish divergence is a key technical indicator revealing strong buying pressure beneath unce...

Learn how the True Range indicator captures market volatility and price swings, empowering traders t...

Discover how inside bar patterns signal key market pauses and possible breakouts or reversals. This...