

Technical Analysis
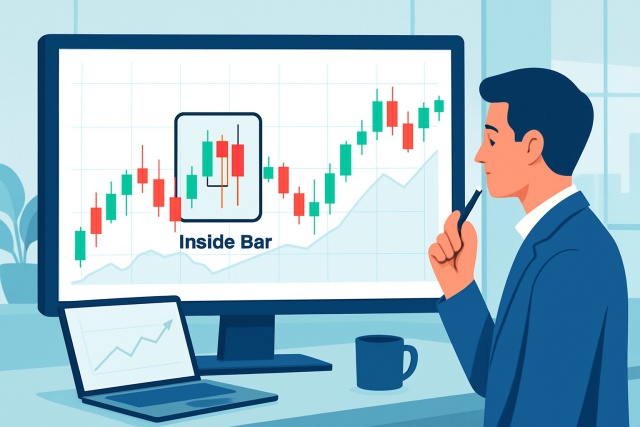
Inside Bar Pattern To Spot Breakouts And Reversals
Discover how inside bar patterns signal key market pauses and possible breakouts or reversals. This...
Knowing which way prices are likely to move is absolutely vital for anyone serious about trading. One of the tried-and-true tools that many investors have come to lean on when trying to get a bead on future price trends is the pattern triangle.
A pattern triangle pops up on a price chart when the highs and lows start inching closer and closer, wrapped up neatly by two trendlines that squeeze together to form a triangle shape.
These triangles pop up whenever the market swings between buyers and sellers, almost like a tug-of-war reaching a brief lull. They highlight those moments when price volatility takes a breather and the market seems to catch its breath, as the push and pull from both sides find a temporary balance. Traders are always on the lookout for the price to break free from the triangle's grip, because that is when the scales start tipping and a decisive move kicks off.
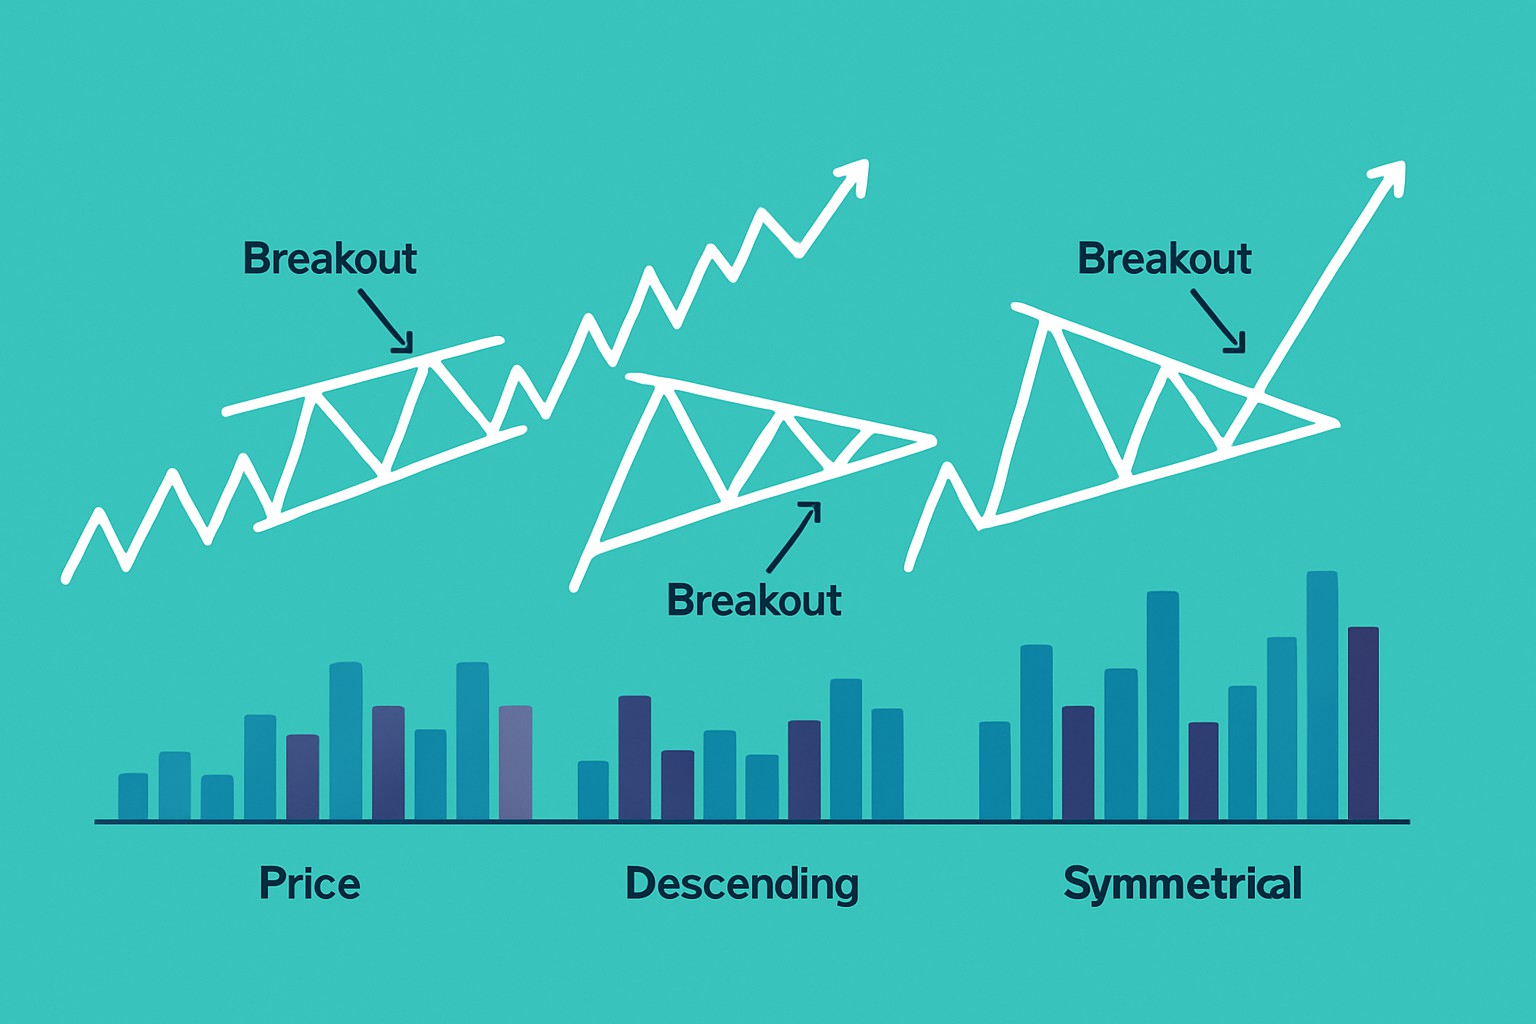
Technical analysis usually zeroes in on three main types of pattern triangles: ascending, descending and symmetrical. Each one has a unique shape and angle in the trendlines that often gives a good clue about where the price might head next.
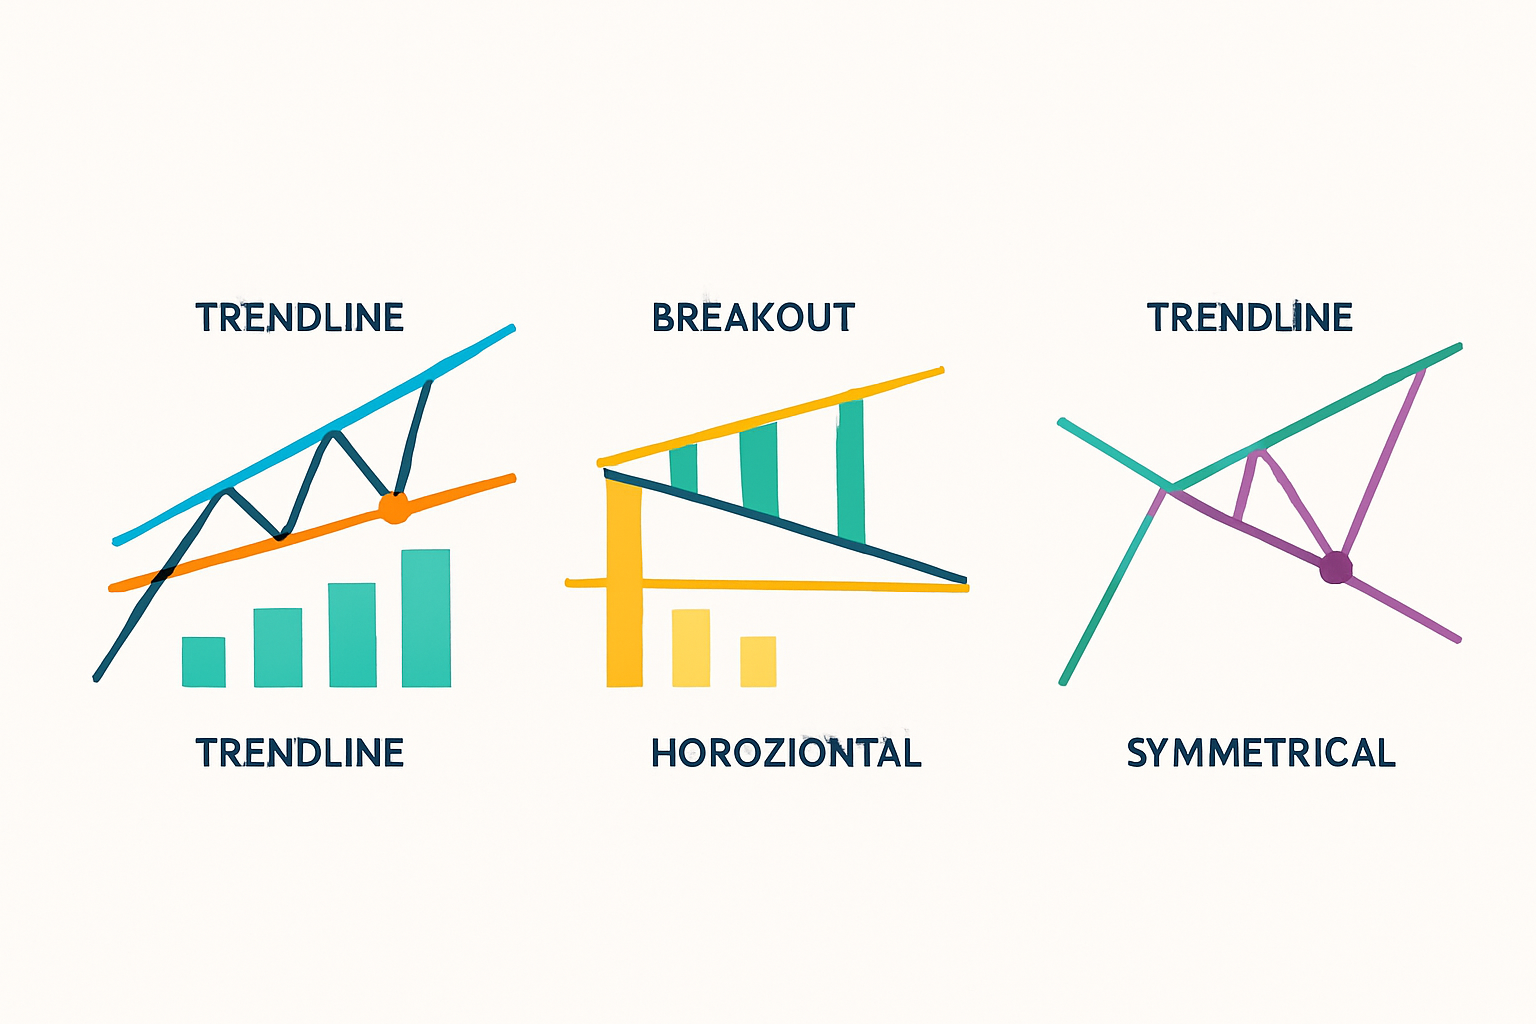
The ascending triangle sports a flat resistance line up top, while the support gradually creeps upward along the bottom. This pattern is a clear sign that buyers are steadily flexing their muscles, nudging prices a bit higher with each rebound.
Descending triangles show up with a flat support line paired next to a resistance line that’s steadily slipping lower, hinting that sellers are inching prices down bit by bit.
Sometimes the market likes to play it cool and keeps things nice and balanced. That is exactly what a symmetrical triangle is all about—a neat little pattern where the price action squeezes in tighter and tighter, like it is holding its breath before the next big move. Think of it as a tug of war where neither bulls nor bears can gain the upper hand for a while, creating those converging trendlines that form the triangle shape. It’s a classic setup that traders often watch closely, waiting to see which way the market finally decides to break free.
Symmetrical triangles pop up when two trendlines slope toward each other, eventually meeting at a single point. This pattern usually signals market uncertainty, with buyers and sellers more or less neck and neck.
Visual depiction of ascending, descending, and symmetrical triangle patterns on price charts with clear annotations.
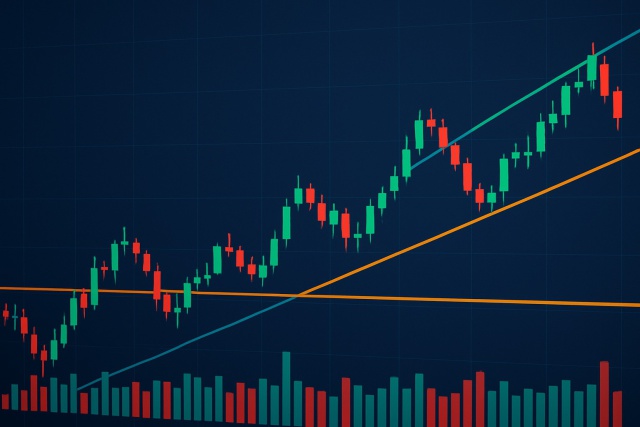
Spotting pattern triangles calls for a keen eye on price movements across different timeframes. Nailing those trendlines just right and keeping a sharp lookout for volume shifts can really help these patterns pop out more clearly.
Spot two trendlines coming together. It’s like connecting the dots between a series of lower highs and higher lows on the price chart. Think of it as drawing a neat little tent.
Make sure each trendline gets a good number of touches without any obvious breaks. This helps confirm the triangle’s boundaries and keeps things legit.
Keep an eye on volume, which usually decreases and takes a little nap as the triangle develops. Don’t overlook this quiet phase.
Watch for the breakout moment when the price clearly pushes beyond one of the trendlines. Ideally, this should be backed by rising volume to convince you it’s the real deal.
Bring in other technical indicators like RSI or MACD to double-check the breakout’s strength, acting as a safety net to avoid those sneaky false signals.
Common mistakes usually come down to misreading trendline angles, missing subtle volume signals or mixing up other consolidation patterns for triangles. Patterns that overlap or weak breakout signals are like little traps that often lead to false predictions. Yep, those can really sting your wallet. The key in my experience is for traders to keep their cool, stay patient and double-check signals across multiple indicators and timeframes.
Pattern triangles are especially handy since they give us a glimpse of where the price might head next, based on the breakout direction. When the price breaks out of the triangle with convincing volume and momentum, it usually signals the dominant market force at play and often drops a hint about whether the trend will stick around or take a sharp turn. Traders tend to zero in on just how quick and strong that breakout is, trying to suss out if it’s the real deal and likely to keep rolling.
Ascending triangles usually break upwards reflecting steady buying pressure that is hard to ignore. On the flip side, descending triangles tend to break downwards with sellers often having the upper hand. Symmetrical triangles keep things neutral until a breakout decides the direction.
After a breakout traders often size up the likely price move by measuring the triangle's height at its widest spot and then projecting that distance from the breakout point. It’s a simple yet handy trick that gives you a solid target to lean on when deciding entries, exits and where to set your stops.
| Triangle Type | Height (Price Units) | Breakout Direction | Projected Target | Actual Movement |
|---|---|---|---|---|
| Ascending | 5 | Up | +5 points | +6 points |
| Descending | 4 | Down | -4 points | -3.8 points |
| Symmetrical | 6 | Up | +6 points | +5.9 points |
| Ascending | 3 | Up | +3 points | +2.5 points |
| Descending | 7 | Down | -7 points | -7.2 points |
This table lays out some real-world examples of triangle patterns, detailing their height, breakout direction, projected price targets, and what actually unfolded. It really goes to show how this technique is often pretty reliable and quite handy when you put it to the test.
Trading pattern triangles really calls for a good dose of patience and discipline. It’s usually wiser to hold your horses and wait for a clear breakout that’s backed up by solid volume. Setting stop-loss orders just beyond the opposite trendline can be a handy way to keep your risk in check without sweating bullets. When you pair pattern analysis with other indicators, you often get signals that feel a bit more trustworthy. Also, I’ve found it’s best to steer clear of trading when liquidity runs low to dodge nasty slippage surprises.
Successful triangle traders usually catch your eye because they’ve mastered the art of patience and discipline—qualities that set them apart from those who dive in headfirst and end up nursing losses. In my experience, it pays off handsomely to hold your horses, wait for the green light of confirmation, and manage your risk with a steady hand.
Many traders often fall into the trap of thinking pattern triangles spell out exact directions or pinpoint breakout timings. Triangles are more like hints, nudging us toward possible outcomes rather than handing over ironclad guarantees. To sidestep those pesky false signals, it’s wise to keep an eye on volume and lean on other confirmation tools.

Tired of missing opportunities and making suboptimal trading decisions? TrendSpider's cutting-edge platform automates complex technical analysis, saving you time and reducing human error.
With multi-timeframe analysis, dynamic alerts, backtesting, and customizable charting, you'll gain a competitive edge in identifying trends and making informed trades across global markets.

Transforming the field of commodities trading through sustainable investing principles, she bridges traditional finance with ESG considerations.
Read PostsDiscover how inside bar patterns signal key market pauses and possible breakouts or reversals. This...

Discover how to recognize the evening star candlestick pattern—a powerful signal highlighting potent...

Learn how the True Range indicator captures market volatility and price swings, empowering traders t...
Trend lines are essential tools in technical analysis that help traders identify market direction an...