


Technical Analysis
How to Trade a Wedge Falling Pattern
Discover the wedge falling pattern's secrets and learn step-by-step how to trade this powerful techn...
The debate over ema vs sma is a staple in the world of technical analysis. Both indicators do a solid job smoothing out price data to reveal trends but differ quite a bit in how they are calculated and, more importantly, how quickly they react to new information.
The Simple Moving Average (SMA) does its job by calculating the average price over a chosen period and gives every price the same weight. Meanwhile, the Exponential Moving Average (EMA) favors the latest prices, so it picks up on recent shifts faster.
SMA is calculated by adding prices over a set period and dividing by the number of periods. EMA, on the other hand, brings more nuance using a smoothing factor that puts extra emphasis on recent prices.
| Feature | Simple Moving Average (SMA) | Exponential Moving Average (EMA) |
|---|---|---|
| Calculation Formula | SMA is simply the sum of prices divided by the number of periods — straightforward and no-frills | EMA comes from multiplying today’s price by a multiplier and then adding that to yesterday’s EMA times one minus the multiplier — a bit of a mouthful, but it keeps things responsive |
| Weighting Distribution | Treats all data points like equals, giving each the same weight without playing favorites | Puts more emphasis on recent prices, gently nudging older data aside as new info rolls in |
| Lag Effect | Usually has a bit more lag, so it’s a bit slower to react when prices change — like catching a late bus | Reacts faster thanks to lower lag, keeping up with recent price moves like a quick-footed friend |
| Computational Complexity | Easy to compute: just add up the numbers and divide — no sweat here | Slightly more complex since it builds on the previous EMA and a smoothing factor, but nothing too intimidating |
| Typical Use Cases | Great for spotting longer-term trends when you want to keep things steady and simple | Favored for tracking short-term momentum and timing entries or exits, perfect when speed matters |
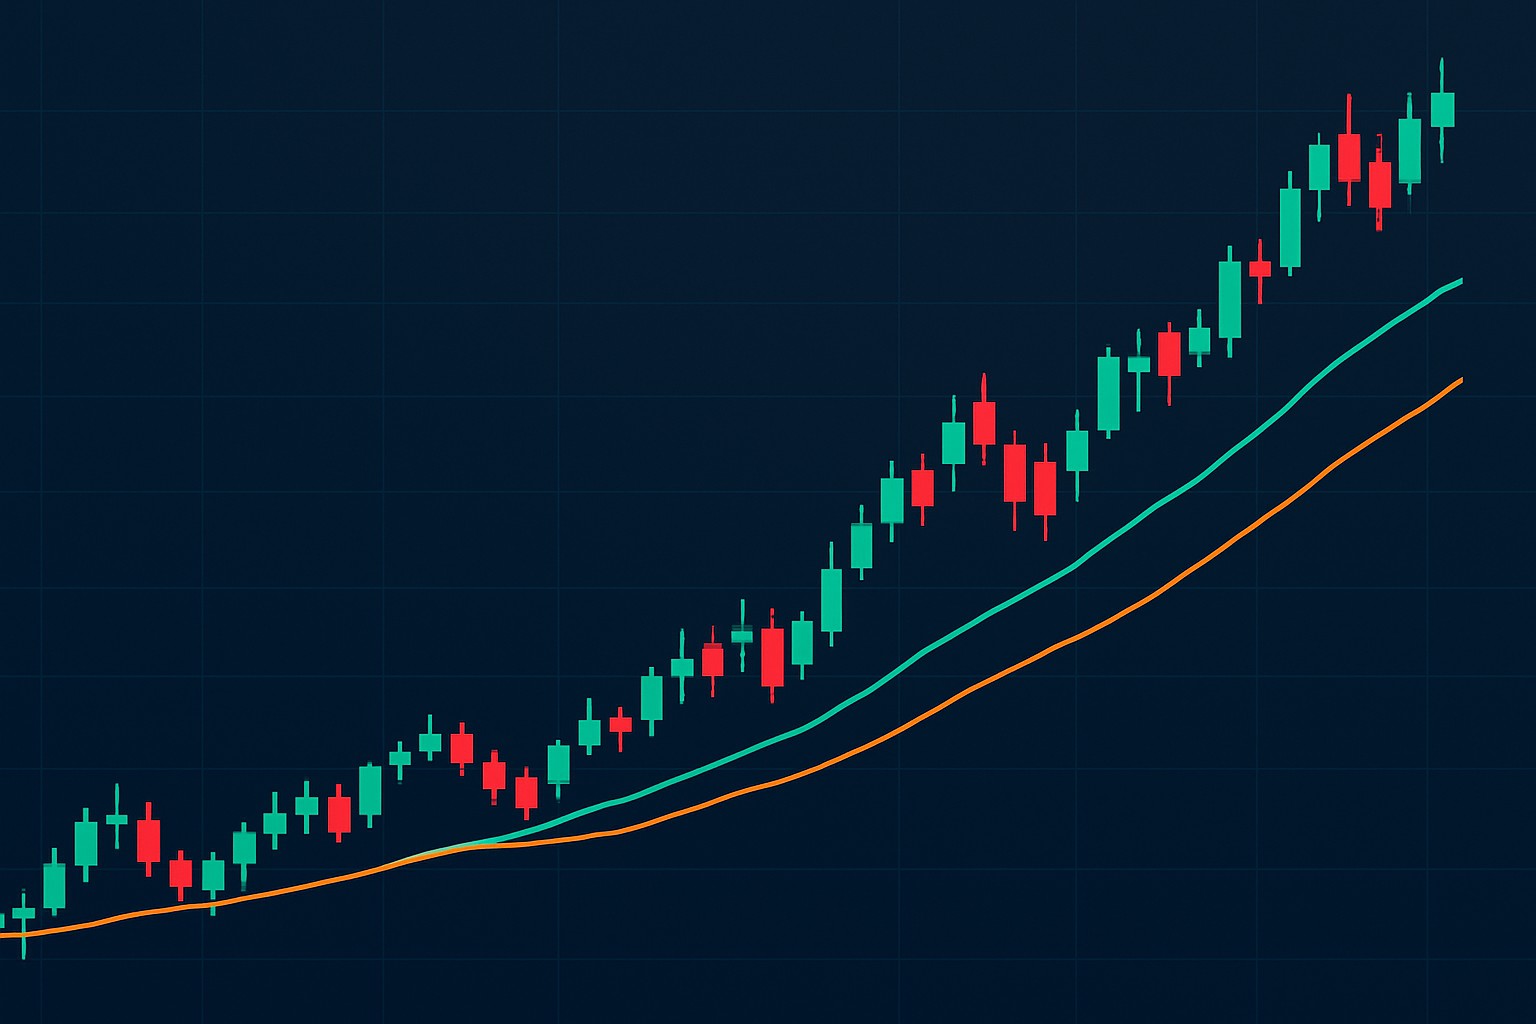
EMA is designed to pick up on recent price changes faster than SMA almost like it’s got its ear to the ground. This often means EMA catches trend shifts earlier though that eagerness can sometimes lead to a few false alarms. Meanwhile, SMA takes its time and moves like a steady tortoise. It drowns out the noise but might leave you a bit late to the party when entering or exiting trades.

Visual comparison chart of price vs EMA and SMA to illustrate lag and responsiveness differences
Traders often lean on the EMA when they need to move quickly in response to market shifts, especially during wild volatile trends or when timing the exact entry really matters. Meanwhile, SMA usually takes the spotlight when the market is doing the sideways shuffle. It helps cut through the noise and confirm longer-term trends.
The EMA tends to jump into action a bit faster, often throwing out earlier signals for entry and exit that try to ride the momentum wave. It has a knack for getting caught in whipsaws, which can really spice up the risk during sideways or choppy conditions. The SMA shines in range-bound markets by filtering out a lot of the noise and showcasing smoother price trends, though it might drag its feet when the market decides to make a sudden move.
"Picking the right moving average really depends on the market situation: EMAs usually shine when you need to move fast and catch momentum, while SMAs tend to keep things grounded and steady when the market feels a bit like a rollercoaster." – A seasoned technical analyst
Both EMA and SMA indicators are staples on nearly every top trading platform. They let you tweak the periods and pick how they’re displayed, making technical analysis more intuitive and useful. Features like alerts and multi-timeframe overlays often give traders an extra edge by helping them react quicker.
This comparison lays out how three top trading platforms stack up in pricing, features, usability, and who they’re best suited for—helping you zero in on the right fit for your trading style.
| Key Differences |  |  |  |
|---|---|---|---|
| Pricing | Spot fees sit at a neat 0.1%, futures fees come in lower at 0.02%, and best of all, there’s no pesky subscription to worry about. | Subscriptions range from Pro at $14.95, Pro+ at $29.95, to Premium at $59.95 per month—something for every budget if you ask me. | Options start at Standard $49.99, move up to Pro $79.99, and top out at Elite $129.99 per month—definitely a premium slice of the pie. |
| Primary Features | Offers spot and futures trading, packs in advanced charting tools, and generally boasts high liquidity that seasoned traders appreciate. | Brings to the table advanced charting, a smorgasbord of technical indicators, and comprehensive market data integration that traders really lean on. | Delivers automated technical analysis, pattern recognition, and backtesting features to keep traders ahead of the curve. |
| Ease of Use | The interface is fairly user friendly, but the fee structure can be a bit of a maze, making it less ideal for individuals just starting out. | There’s a bit of a learning curve, especially for the advanced features; on the bright side, apps are available for both mobile and desktop. | The interface is user friendly, but there’s a steep learning curve—nothing’s free here, especially for the beginners among us. |
| Target Audience | Tailored for active traders who want direct crypto exposure and don’t mind dipping their toes into leverage. | Ideal for traders who want to dive deep into technical analysis while also tapping into a lively community for fresh ideas. | Geared toward active traders eager for AI-driven analysis and tools to test out their strategies in a more scientific way. |
| Integration Options | Supports API integrations to help automate trades — a nice touch for those who like their trading hands-free. | Plays nicely with major brokerages to enable live trading, which is a real convenience. | Offers limited customization and doesn’t explicitly support direct brokerage trading integration, which may disappoint those looking for full plug-and-play. |
| Advanced Tools & Automation | Comes loaded with advanced trading tools and a variety of charting indicators to keep strategists on their toes. | Offers a rich array of technical indicators, though it’s missing AI-based automation tools, so manual input is still king here. | Features AI pattern recognition, dynamic alerts, and automated backtesting that can seriously up your trading game. |
| Community & Collaboration | Doesn’t really offer built-in social networking features, so don’t expect a buzzing chat room here. | Packed with strong social networking features that make sharing ideas and collaborating feel as natural as chatting over coffee. | Lacks built-in social or community features, so you’re mostly flying solo here. |
| Pros and Cons Summary | Strong points include a broad service range, high liquidity, and sophisticated tools; on the flip side, limited support and a complicated fee system may throw beginners off. | Advantages include sharp charts, diverse indicators, and a robust community; drawbacks are that some features come with a price tag, occasional lag, and limited fundamental analysis tools. | Its perks include smart automated tools, precise alerts, and efficient charting; drawbacks are the hefty price, potential overwhelm for newbies, and limited options for deep customization. |
| Visit Binance Site | Visit TradingView Site | Visit TrendSpider Site |
Binance offers user-friendly EMA and SMA overlays tucked within its wide-ranging crypto trading platform, all while keeping real-time updates and competitive fees front and center. TradingView steals the show with its powerful charting tools and highly customizable indicators, making it a top pick for those who love to dig deep into analysis or enjoy a bit of social trading flavor. TrendSpider shines with its automated technical analysis and clever smart alerts, leveraging AI to catch EMA and SMA signals like a seasoned pro.
| Feature | Binance | TradingView | TrendSpider |
|---|---|---|---|
| EMA & SMA Indicator | Offers straightforward presets with real-time updates—nothing too fancy but it gets the job done | Highly customizable with an impressive range of options that let you really dig deep | Leverages AI to spot patterns and deliver insights that might just save you some guesswork |
| Charting Tools | Provides solid, standard charts mainly tailored for crypto traders looking for reliable visuals | Advanced charting capabilities across multiple asset classes, perfect when you want to branch out | Comes with handy automated tools that help identify trends and patterns, making life a bit easier |
| Alerts & Notifications | Comes with essential price and indicator alerts to keep you in the loop without overwhelming you | Offers a broad suite of alert options for all kinds of market moves—you won’t miss a beat | Pushes dynamic alerts powered by AI—smart enough to catch what might fly under your radar |
| User Interface | Designed to be beginner-friendly and easy to navigate, so you’re not scratching your head | A professional-level setup that leans heavily into community features—great if you like a crowd vibe | Balances user-friendliness with built-in automation, making it welcoming without being basic |
| Device Accessibility | Available on both desktop and mobile apps, so you can keep tabs wherever you go | Accessible across desktop, mobile, and tablets—pretty much wherever you like to hang out | Supports desktop and mobile browsers, giving you some nice flexibility without fuss |
| Ease of Use | Generally smooth sailing for new crypto traders—nothing too intimidating right off the bat | Has a steeper learning curve but packs a punch for the advanced users who like to get their hands dirty | Moderate learning curve, best suited for those comfortable with tech but willing to invest a little time |
When deciding between ema vs sma, it really boils down to your trading style and the time frame you pay attention to and the kind of market mood you are dealing with. EMAs tend to shine for traders who need to react quickly and catch signals just in time, especially when the market’s volatile. On the flip side, SMAs usually click better with those who prefer signals that feel steadier during long trends or when the market moves slowly within a familiar range.

Struggling to improve your trading performance? Edgewonk's advanced analytics tools are designed to give you the edge you need.
With detailed trade journaling, robust strategy analysis, and psychological insights, you'll gain a comprehensive understanding of your strengths and weaknesses. Don't miss out on this game-changing opportunity.

Transforming the field of technical analysis through innovative charting techniques, Scarlett specializes in pattern recognition and momentum trading strategies for equity markets.
Read PostsDiscover the wedge falling pattern's secrets and learn step-by-step how to trade this powerful techn...
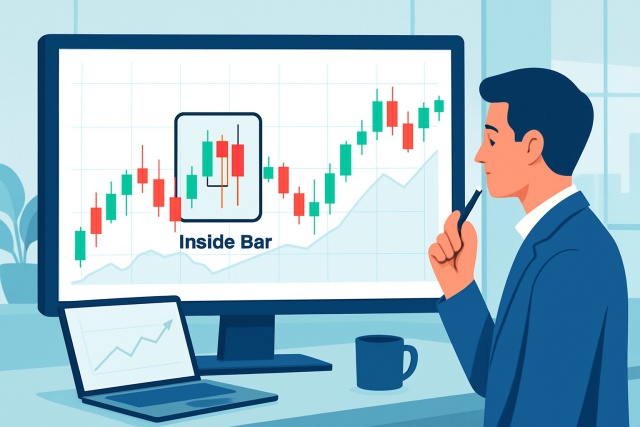
Discover how inside bar patterns signal key market pauses and possible breakouts or reversals. This...
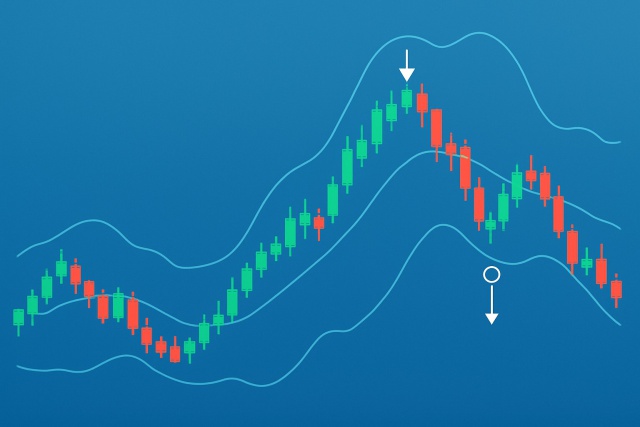
Master trading with Bollinger Bands by understanding volatility, setup patterns, and risk management...

Learn how the True Range indicator captures market volatility and price swings, empowering traders t...