


Technical Analysis
Using The True Range Indicator To Spot Price Swings
Learn how the True Range indicator captures market volatility and price swings, empowering traders t...
Candlestick patterns offer traders a handy visual shortcut to grasp price movements. The Doji really shines as a go-to signal for potential reversals. This article explains what a candlestick Doji is, why it matters, and how to interpret it like a pro.
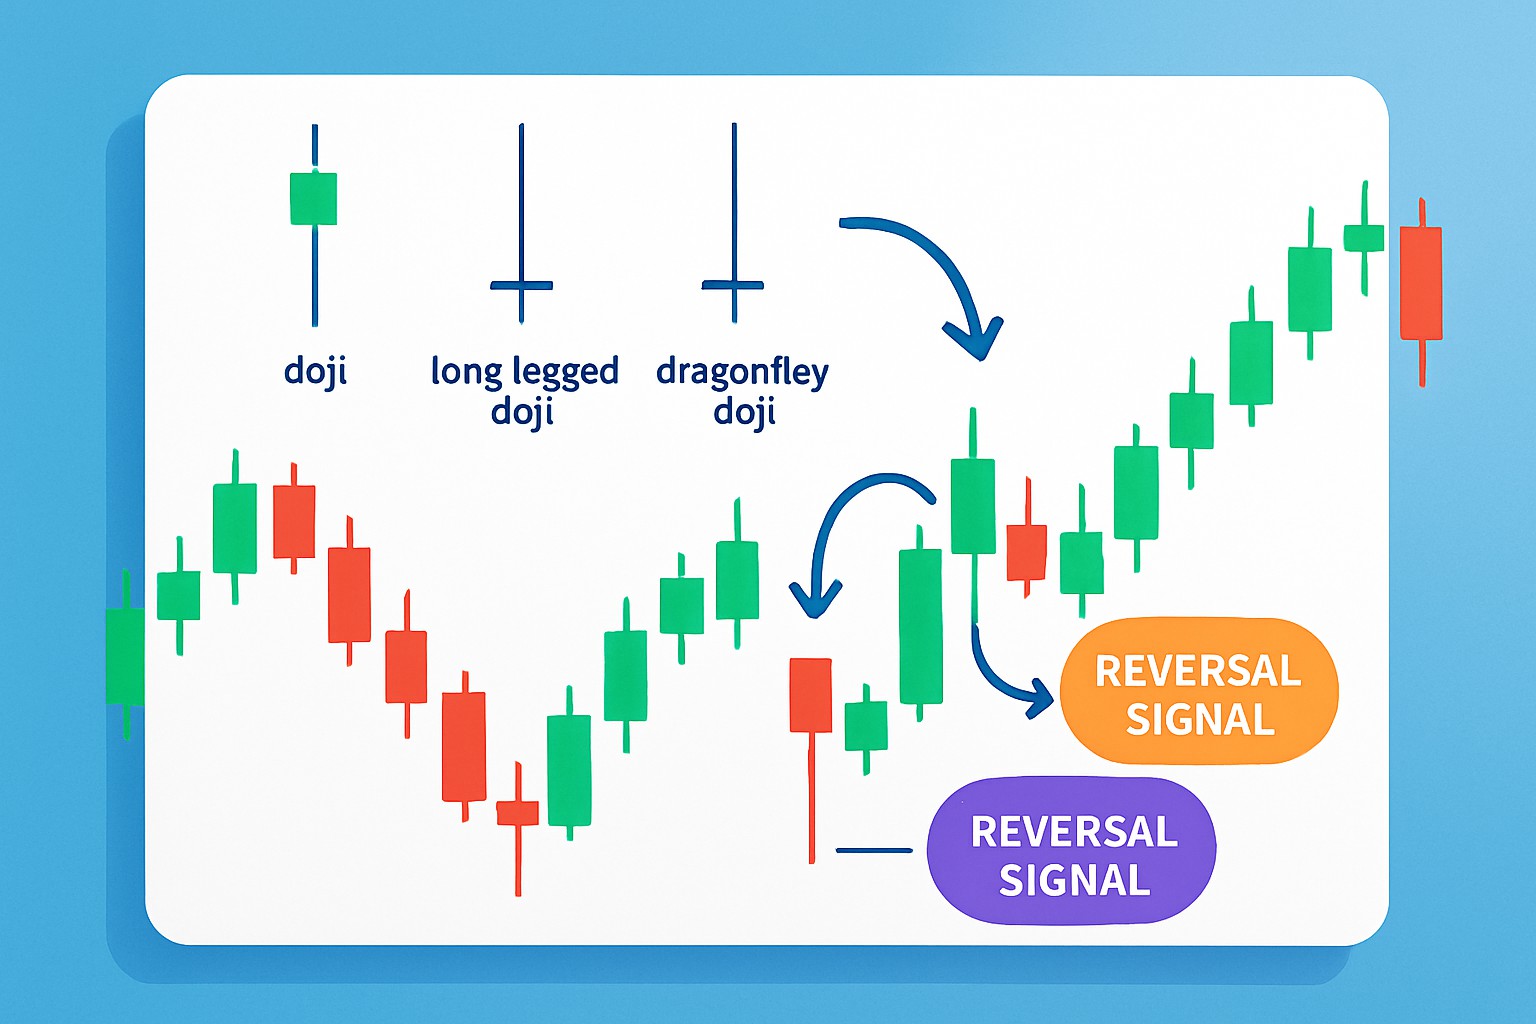
A candlestick Doji shows up when an asset's opening and closing prices are nearly neck and neck, resulting in a candle with either a tiny body or none at all. This pattern looks a lot like a cross or a plus sign and usually signals a bit of market indecision, as buyers and sellers tussle for the upper hand throughout the trading session.
A Doji shows up when the market is caught in a bit of a tug-of-war between buyers and sellers, with prices opening and closing nearly neck and neck.
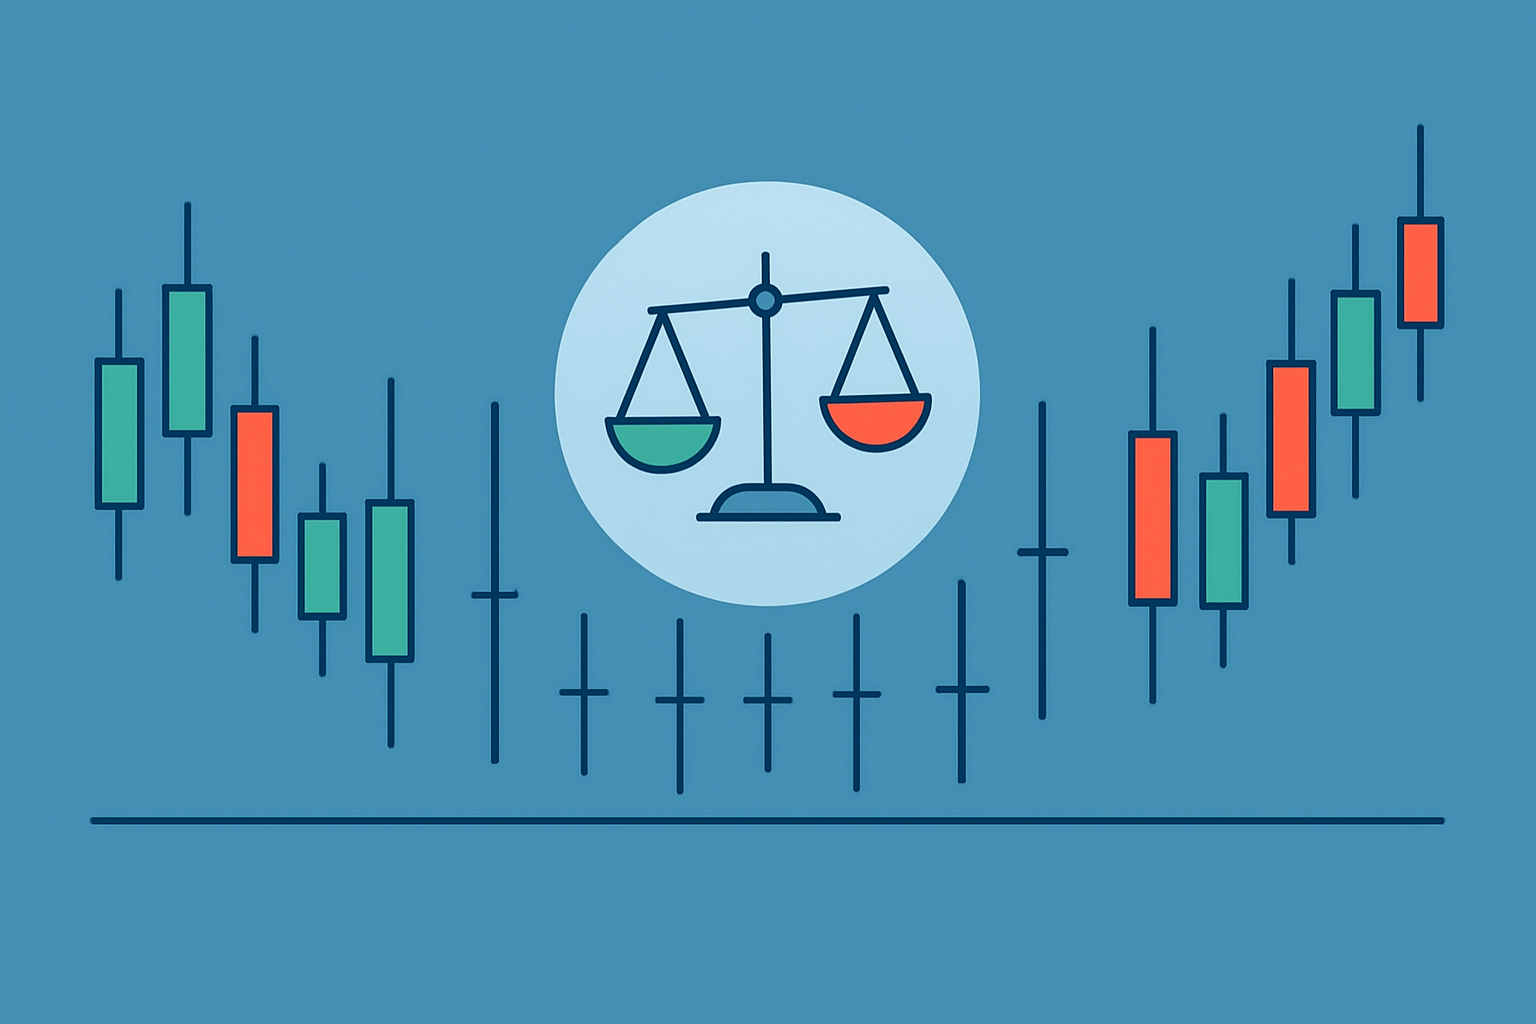
Visual of various Doji candlestick types demonstrating market indecision and balanced price action.
Dojis often appear after big price moves and usually signal that the market’s momentum is losing steam or about to change course. When they appear, neither buyers nor sellers are in control. This nudges traders to stay alert for potential trend reversals or sideways action.
Dojis often point to market indecision but it’s easy to fall into the trap of treating them as a guaranteed sign of a reversal on their own. They make more sense when you consider them alongside volume and the bigger trend and other technical clues—kind of like piecing together a puzzle rather than relying on a single piece.
A Doji often acts more like a friendly warning flag than a crystal-clear sign, so leaning on it too heavily can sometimes send traders down the garden path.
| Doji Type | Visual Characteristics | Usual Market Context | Potential Implication for Price Action |
|---|---|---|---|
| Standard Doji | Tiny body with upper and lower shadows about the same size | Pops up in both lively and quiet markets | Signals indecision on the trader’s part; often hints at a pause or a reversal, like the market catching its breath |
| Dragonfly Doji | A very long lower shadow with little to no upper shadow | Usually appears near the bottom of downtrends | Points toward a possible bullish turnaround, kind of like the market tipping its hat to the buyers |
| Gravestone Doji | Long upper shadow and barely any lower shadow | Commonly spotted near market peaks | Waves a flag for a potential bearish reversal, as if sellers are stepping into the spotlight |
| Long-legged Doji | Noticeably long shadows above and below a tiny body | Shows up during times of wild price swings | Reflects strong uncertainty — it’s like the market can’t make up its mind and often backs a weak trend bias |
Each variant of the Doji candle carries its own distinct look that hints at the market’s current mood and possible next moves. The good old Standard Doji reflects a stalemate where buyers and sellers are evenly matched. Meanwhile, the Dragonfly and Gravestone Dojis often pop up around turning points and signal potential reversals whether the market is about to switch from bearish to bullish or take the opposite route.
Using Dojis effectively means stepping back and seeing them in the grander scheme of the market. Traders often take a good look at the current trend, peek at the volume when the Doji pops up and hunt for confirmation from other candles or trusty technical indicators.
Pinpoint the main trend and figure out if the market is heading up or sliding down or just moving sideways.
Hunt for a Doji candlestick on your chart and don’t just glance over it. Note the exact type and where it appears because details matter.
Take a peek at the trading volume around the Doji to understand how intense that moment of indecision really is.
Keep an eye out for confirmation candles like bullish or bearish engulfing patterns. These usually follow the Doji and help confirm the signal.
Add other trusted indicators such as RSI or MACD to support your guess on whether the trend is about to reverse or continue.
Set firm risk controls with stop-loss orders and smart position sizing. This acts as your safety net against any sneaky false signals.
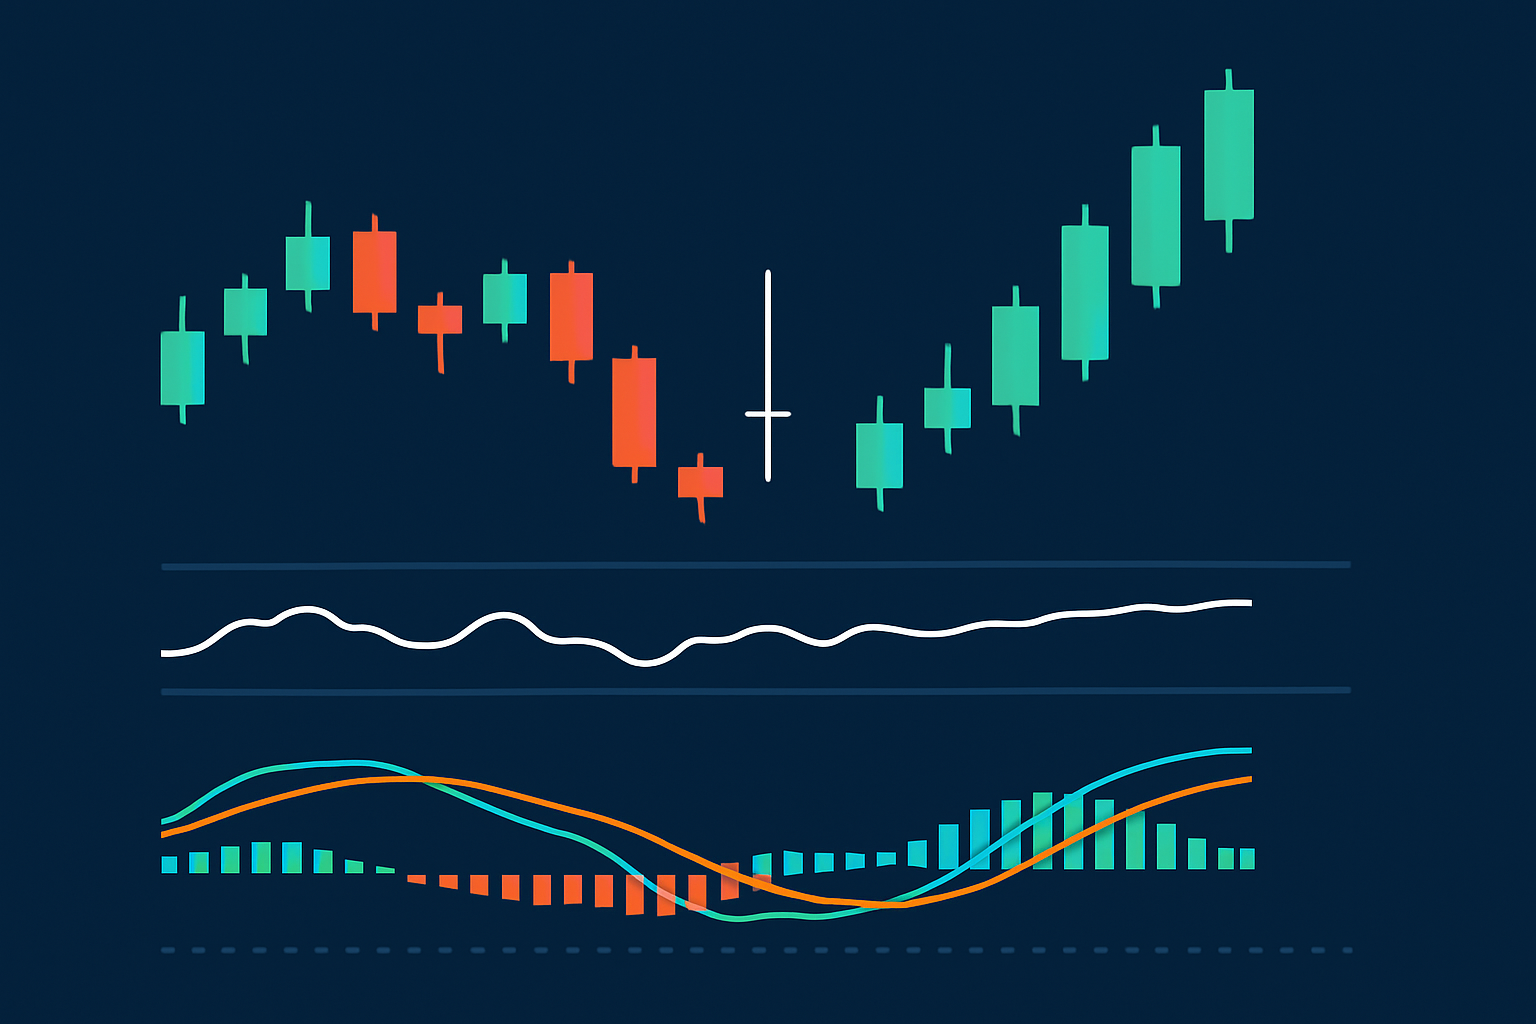
Chart illustrating a Doji candlestick in a trend, confirmed by RSI and MACD indicators signaling a potential reversal.
During a recent Bitcoin rally a Dragonfly Doji appeared near a short-term low followed by strong bullish candles that confirmed a reversal and indicated market strength. Meanwhile in the stock market a Gravestone Doji formed near a peak on Apple Inc.'s chart signaling that sellers were entering and initiating a bearish pullback. These examples highlight the importance of combining Doji pattern recognition with a solid understanding of the broader trend and volume.
Following these best practices can really help traders get the most out of Doji candlesticks as reliable signals for spotting price reversals. When you pair them up with handy tools like Binance for trading or TrendSpider for automated analysis, you often find your decision-making and risk management becoming a whole lot smoother.

Tired of missing opportunities and making suboptimal trading decisions? TrendSpider's cutting-edge platform automates complex technical analysis, saving you time and reducing human error.
With multi-timeframe analysis, dynamic alerts, backtesting, and customizable charting, you'll gain a competitive edge in identifying trends and making informed trades across global markets.

With 20 years experience in commodity trading, Jasper provides insights into energy markets, precious metals, and agricultural futures with a focus on macroeconomic trends.
Read PostsLearn how the True Range indicator captures market volatility and price swings, empowering traders t...
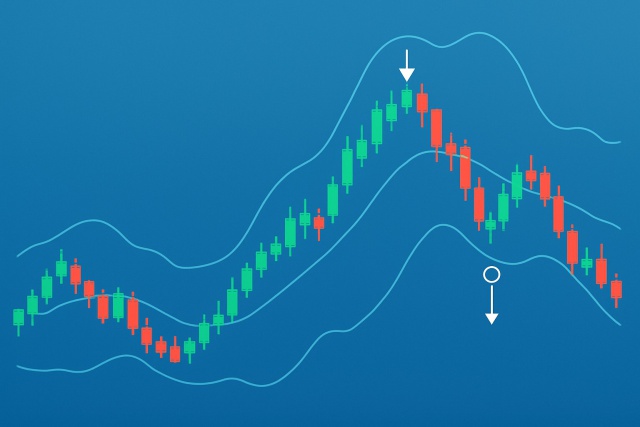
Master trading with Bollinger Bands by understanding volatility, setup patterns, and risk management...

Discover the wedge falling pattern's secrets and learn step-by-step how to trade this powerful techn...

Master the momentum indicator to gauge price speed and trend strength. This ultimate guide covers ca...