


Technical Analysis
Using The True Range Indicator To Spot Price Swings
Learn how the True Range indicator captures market volatility and price swings, empowering traders t...
Japanese candlestick charts have been a trusty sidekick in technical analysis for some time, giving traders a clear visual way to grasp market sentiment and price moves. They first debuted in 18th century Japan and were originally crafted for rice trading—yes, rice! These charts rely on distinctive shapes that map price changes over set periods. For traders, learning these patterns can reveal early hints of trend reversals and turn what feels like a jumble of data into something practical.
Japanese candlesticks are a type of financial chart that reveal how prices move for stocks, commodities and other assets. Each candlestick captures four key data points over a set time period: the open, close, high and low prices. Unlike line or bar charts, candlesticks better show market sentiment by spotlighting the relationship between opening and closing prices visually.
Many people assume that the color of a candlestick alone can tell you exactly where the price is headed. However, savvy traders know it’s all about the bigger picture—glancing at the chart as a whole and keeping an eye out for patterns formed by clusters of candles.
Candlestick patterns reveal shifts in the tug-of-war between supply and demand, often giving us a heads-up on when a new market trend is about to kick off.
Candlestick patterns often behave like those trusty traffic lights we all rely on. Green gives the go-ahead to keep charging ahead, red throws up a big caution flag, and yellow? Well, it’s that little nudge to ease off the gas and watch for a change in market mood.
Each of these patterns has a unique shape that gives you a feel for the market’s mood. Take the hammer for example. It has a tiny body with a long lower wick that often hints buyers are stepping up to stop a downtrend. A doji plays a slightly different tune. It shows a bit of hesitation with the open and close prices almost neck and neck and usually signals a possible turning point—especially after a prolonged trend.
| Pattern Name | Visual Description | Market Context (uptrend/downtrend) | Typical Signal | Confirmation Tips |
|---|---|---|---|---|
| Hammer | Small real body with a long lower shadow | Downtrend | Bullish Reversal | Usually backed up by higher volume and followed by a lively green candle |
| Hanging Man | Small body accompanied by a long lower shadow | Uptrend | Bearish Reversal | Keep an eye out for a bearish candle tagging along next |
| Inverted Hammer | Small body with a long upper shadow | Downtrend | Bullish Reversal | Better confirmed if the next candle closes above the hammer’s body |
| Shooting Star | Small body paired with a long upper shadow | Uptrend | Bearish Reversal | Often gets a thumbs-up from a volume spike and a red candle right after |
| Doji | Very small body, open and close prices almost equal | Both | Indecision or Reversal | It pays to check the trend context and see what the next candle decides to do |
| Bullish Engulfing | Large green candle fully engulfing the previous red candle | Downtrend | Bullish Reversal | Confirmation usually pops up with increased volume and a follow-up candle |
| Bearish Engulfing | Large red candle engulfing the prior green candle | Uptrend | Bearish Reversal | Often confirmed by signs that momentum is running out of steam |
Candlestick patterns can be strong indicators but leaning on them all by themselves often leads to false alarms. When you mix these patterns with volume analysis, support and resistance levels and momentum indicators you usually end up with a much clearer picture of genuine reversals.
Take a good look at how strong the previous trend was and which way it was moving to get a clearer picture of the pattern's overall context.
Keep an eye out for any nearby support or resistance levels.
Check if trading volume is increasing along with the pattern because that extra oomph can be a solid confirmation.
Add momentum indicators like RSI or MACD to get a sense of whether the trend is losing strength or starting to gain momentum.
Be patient before jumping in and wait for the next candle to confirm the signal.
Many beginners tend to jump the gun acting on a single candlestick pattern without pausing to see if the bigger market picture actually backs up a reversal. Then there are those who dive in headfirst a little too early before any solid confirmation shows up—often ending up stuck in trades during those frustrating sideways moves or short pauses.
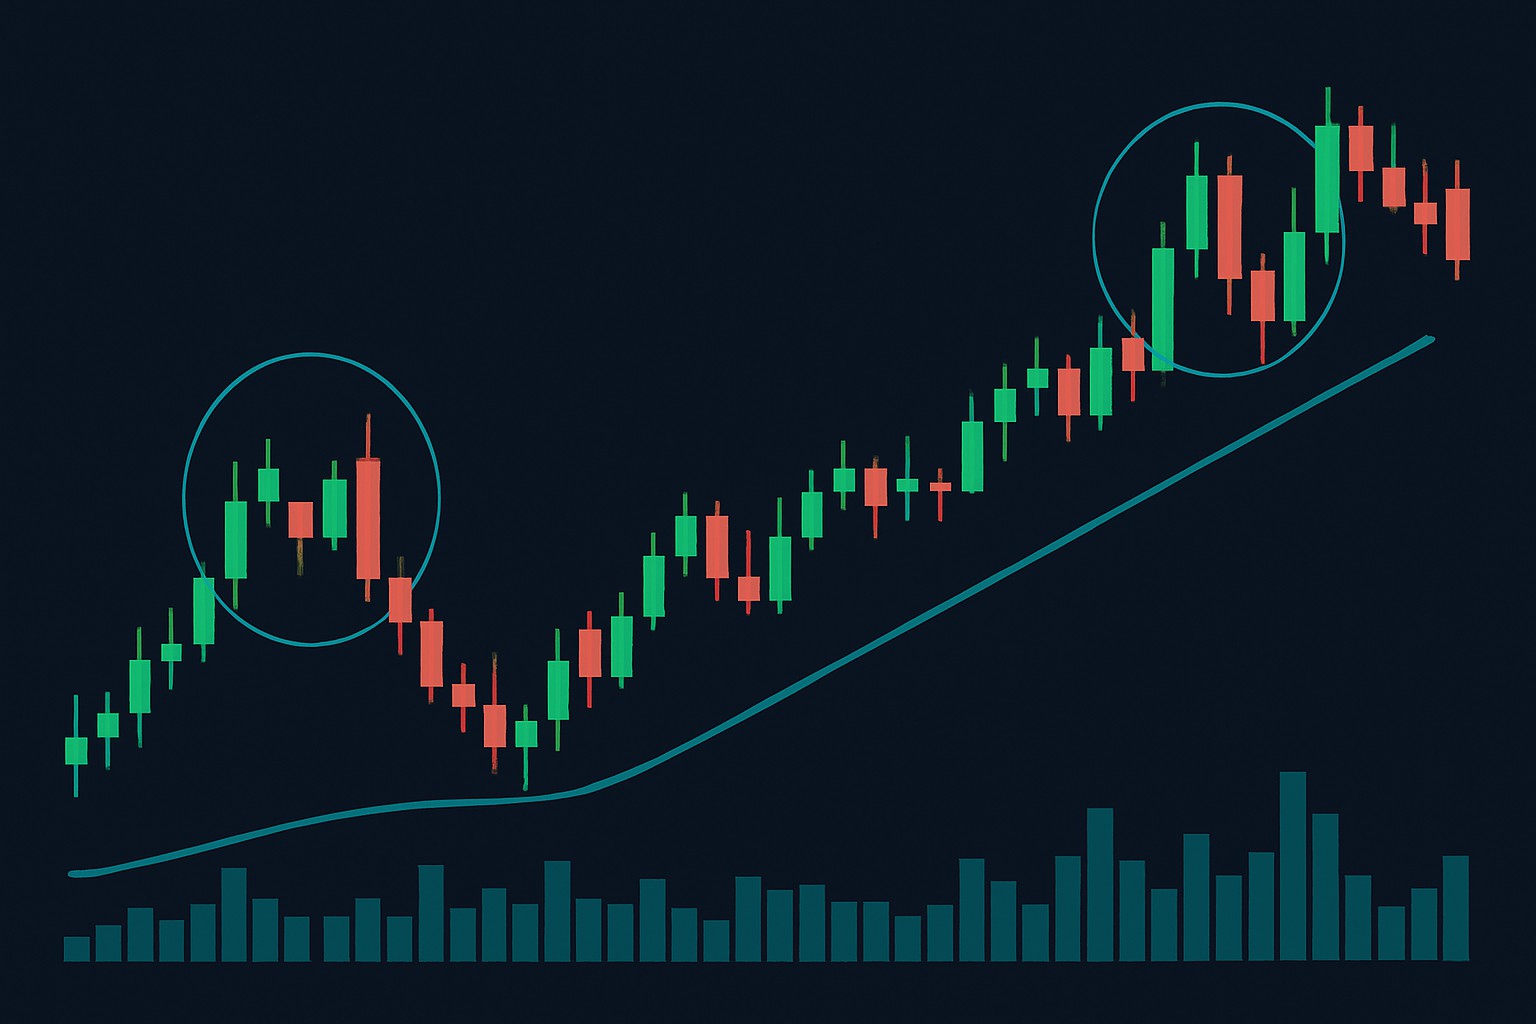
Imagine a stock trudging downwards where suddenly a hammer candlestick pops up on the daily chart, just as it touches a well-known support level. When volume perks up and the next candle turns green, it’s a pretty clear sign that buyers are starting to step in. This setup often hints at a short-term bullish reversal, giving traders a bit of hope. On the flip side, spotting a shooting star after an uptrend is like seeing the party winding down. If the RSI indicator also flags weakening momentum, you can usually bet a bearish reversal isn’t far behind.
Example of a candlestick chart highlighting hammer and shooting star reversal patterns with volume and RSI indicators shown.
Spot a candlestick with a small body and a long lower wick right near a support zone. That is usually a good sign. Then, keep an eye out for a jump in volume along with a confirming green candle in the next period to back it up.
Discipline and patience truly hold the reins when it comes to working with Japanese candlestick patterns. Jumping into trades fueled by fear or a sudden rush of excitement after seeing just one pattern usually ends up biting you in the wallet. Taking a careful approach—double-checking signals and keeping an eye on the bigger market picture—helps traders build genuine confidence and make smarter calls. Sure, tools like TrendSpider offer nifty automated pattern recognition that can take some of the grunt work off your plate.
Let's clear the air on some of the usual mix-ups that tend to trip people up when dealing with Japanese candlesticks. It’s easy to get tangled in the myths if you’re not careful, but once you get the hang of it, these little guys start making a lot more sense.
Japanese candlestick patterns have earned their fair share of popularity though they’re also surrounded by common myths. Take, for instance, the notion that these patterns alone can guarantee market reversals—spoiler alert they can’t. You need to look at them within the bigger picture to get anything useful from them. Another popular misunderstanding is that complex patterns always trump simpler ones. Simpler patterns often shine brighter and offer clearer, more trustworthy signals.

Struggling to improve your trading performance? Edgewonk's advanced analytics tools are designed to give you the edge you need.
With detailed trade journaling, robust strategy analysis, and psychological insights, you'll gain a comprehensive understanding of your strengths and weaknesses. Don't miss out on this game-changing opportunity.

With 20 years of experience in derivatives trading, she specializes in options strategies and volatility trading, known for her innovative approaches to portfolio hedging.
Read PostsLearn how the True Range indicator captures market volatility and price swings, empowering traders t...

Discover the wedge falling pattern's secrets and learn step-by-step how to trade this powerful techn...

Hidden bullish divergence is a key technical indicator revealing strong buying pressure beneath unce...
Master trading with Bollinger Bands by understanding volatility, setup patterns, and risk management...