


Technical Analysis
How to Trade a Wedge Falling Pattern
Discover the wedge falling pattern's secrets and learn step-by-step how to trade this powerful techn...
When it comes to sma vs ema, these moving averages are the trusty old workhorses of technical analysis, helping traders smooth out those often noisy price swings to spot trends that might otherwise slip under the radar. The Simple Moving Average (SMA) and Exponential Moving Average (EMA) are like the dynamic duo here, each bringing its own flavor to the table. They crunch the numbers differently and respond to market price changes in their own unique ways.
It’s worth taking a moment to get familiar with the basic definitions and how the Simple Moving Average (SMA) and Exponential Moving Average (EMA) actually do their thing.
Get a clear sense of which moving average pulls ahead by taking a closer look at their traits across several important factors that can make or break your trading results. This comparison dives into responsiveness, complexity and lag. It also covers how well they adapt to different markets and the accuracy of their signals, all key points.
The main difference between SMA and EMA boils down to how quickly they pick up on new price data. SMA treats every period equally which leads to a lag when market trends suddenly change. Meanwhile, EMA is more nimble and applies a smoothing factor that focuses on recent prices so it reacts faster. This quicker response can be a real lifesaver for traders hoping to catch trend reversals or shifts in momentum before the crowd does. EMA's hustle comes at a cost as it often throws out false alarms when the market gets choppy or volatile.
Calculating the SMA is straightforward—you add up the closing prices over a set period and divide by the number of days. The EMA takes more effort because it involves exponential smoothing and previous EMA values. It might sound daunting at first but most trading platforms like TradingView and TrendSpider handle all the heavy lifting behind the scenes so users don’t have to worry about the math.
Moving averages tend to play by different rules depending on the market mood. When trends are running strong, EMAs usually shine by quickly picking up changes in direction and helping traders jump in and out a bit ahead of the crowd. When the market is stuck in a sideways shuffle, the SMA's smoother and more laid-back line cuts through noise and false alarms better than the EMA. The EMA can get jittery and cause pesky whipsaws.

Chart depicting SMA and EMA moving averages overlaid on price data illustrating differences in responsiveness and lag in various market conditions.
Moving averages are a cornerstone in many trading strategies whether you rely on them solo or blend them with other indicators. Picking between SMA and EMA can seriously influence when you jump into or bail out of trades, where you decide to place stop losses and how you size up the strength of a trend.
Technical analysis platforms usually come packing both SMA and EMA indicators, paired with some seriously robust charting tools.
This comparison covers key elements of two leading platforms for technical analysis and trading automation, outlining their features, pricing, and usability to help traders make more informed decisions without feeling overwhelmed.
| Key Differences |  |  |
|---|---|---|
| Pricing | Pro: $14.95/mo, Pro+: $29.95/mo, Premium: $59.95/mo | Standard: $49.99/mo, Pro: $79.99/mo, Elite: $129.99/mo |
| Key Features | Advanced charting tools, a wide selection of indicators, and a social trading network that really keeps the conversation flowing | AI-based pattern recognition, automated technical analysis, and backtesting that give your trading an extra edge |
| Ease of Use | Moderate learning curve; the extensive toolset takes some getting used to, but once you do, it feels like second nature | Intuitive interface, though some of the features might feel a bit overwhelming if you’re just starting out |
| Technical Analysis Tools | A broad array of customizable indicators focused on manual charting that let you really get your hands dirty | Advanced automation with AI-driven alerts and charting capabilities that practically do the heavy lifting for you |
| Alerts and Notifications | Standard alerts included; stepping up to higher-tier plans unlocks some of the fancier, advanced alerts | Highly customizable and dynamic alerts tailored precisely to market conditions, like having a personal assistant who is always on the lookout |
| Community and Collaboration | A strong global community where users actively share ideas and strategies—think of it as a bustling trading floor online | Fewer social features compared to some competitors, so it’s more of a solo flight than a group hike |
| Device Accessibility | Fully supported on desktop, mobile, and tablet devices, so you’re covered no matter where the market takes you | Available on desktop and mobile, delivering efficient performance no matter which device you pick up |
| Target Audience | Traders at all levels who want detailed charting and a lively, engaged community | Active, experienced traders laser-focused on automation and precise alerting |
| Visit TradingView Site | Visit TrendSpider Site |
TradingView and TrendSpider both bring solid moving average tools to the table but each has its own sweet spot. TradingView really shines with its easy-to-use interface and tons of customization options. It also has a bustling community where traders eagerly swap strategies. It’s a perfect fit for those who value flexibility and enjoy bouncing ideas off fellow traders. On the flip side, TrendSpider leans heavily into powerful automation and multi-timeframe analysis. Its AI-driven pattern recognition gives active traders the upper hand when tackling complex EMA and SMA strategies while trimming down tedious manual work.
| Feature | Simple Moving Average (SMA) | Exponential Moving Average (EMA) |
|---|---|---|
| Calculation Method | Just the straightforward average of closing prices over N periods — nothing fancy, just the plain old mean | A weighted average that cleverly puts more emphasis on recent prices, kind of like paying more attention to the latest gossip |
| Sensitivity to Price Changes | Less jumpy; it smooths out the noise like a calming balm on wild data swings | More twitchy; it reacts faster to price movements, catching those quick shifts before you blink |
| Lag | Usually lags behind since it treats all data points equally, like everyone getting the same amount of attention | Lags less because it’s in tune with recent data — giving fresh info more say in the story |
| Typical Use Cases | Great for spotting long-term trends and key support or resistance levels, perfect if you like playing the long game | Loved by traders who want to move fast, it’s your go-to for short-term trading, quick trend spotting, and momentum bursts |
| Advantages | Smooth sailing with a clean line, less noise, and pretty easy on the eyes—super beginner-friendly | Snaps up trend changes quicker and responds to price action like it’s got a sixth sense |
| Drawbacks | Can be a little slow on the uptake, which means you might miss some keystone signals in volatile markets | Might throw you some false alarms, especially when the market’s choppy or drifting sideways, so buckle up for some noise |
Picking between SMA and EMA mostly boils down to what you’re aiming for and the kind of market you’re navigating. It also depends on the timeframes you prefer to work with. EMAs often have a leg up in fast-moving trending markets because they deliver quicker signals cutting through the clutter. On the flip side, SMAs tend to offer a clearer view of the trend direction without too much noise getting in the way.
Traders searching for advanced charting tools and a community-driven spot to tweak their SMA and EMA strategies often like TradingView. Its flexible platform lets you experiment with moving average setups and integrates smoothly with brokerages for live trading.
TrendSpider really shines for traders who lean into automated, multi-timeframe technical analysis, especially when comparing sma vs ema strategies. Thanks to its AI-driven pattern recognition and flexible indicators, it helps you zero in on entries and exits even as markets do their unpredictable dance.

Struggling to improve your trading performance? Edgewonk's advanced analytics tools are designed to give you the edge you need.
With detailed trade journaling, robust strategy analysis, and psychological insights, you'll gain a comprehensive understanding of your strengths and weaknesses. Don't miss out on this game-changing opportunity.

Known for demystifying options trading for retail investors, this former hedge fund manager brings Wall Street expertise to everyday trading education.
Read PostsDiscover the wedge falling pattern's secrets and learn step-by-step how to trade this powerful techn...
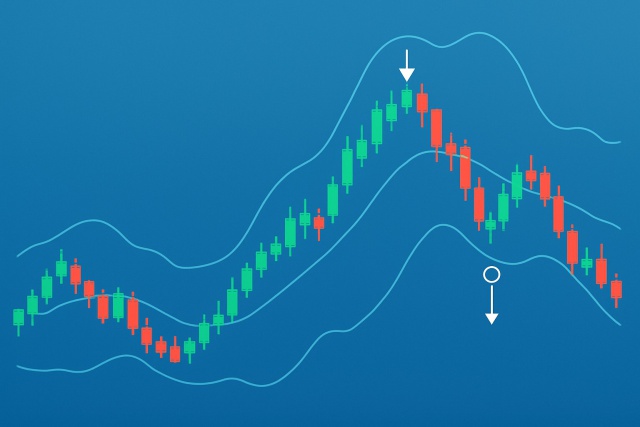
Master trading with Bollinger Bands by understanding volatility, setup patterns, and risk management...

Hidden bullish divergence is a key technical indicator revealing strong buying pressure beneath unce...

Master the momentum indicator to gauge price speed and trend strength. This ultimate guide covers ca...