


Technical Analysis
Momentum Indicator Basics for Traders
Master the momentum indicator to gauge price speed and trend strength. This ultimate guide covers ca...
The spinning top candlestick is one of the most commonly spotted patterns in technical analysis, yet it often leaves traders scratching their heads thanks to its rather cloudy nature. Unlike the more straightforward bullish or bearish candles that shout their intentions, the spinning top quietly reflects a market caught in limbo—a tug-of-war between buyers and sellers where no clear winner emerges. Getting a handle on this pattern is a must for traders at all levels since it really shines a light on those moments when the market is holding its breath, hinting at possible pauses or even reversals in trends.
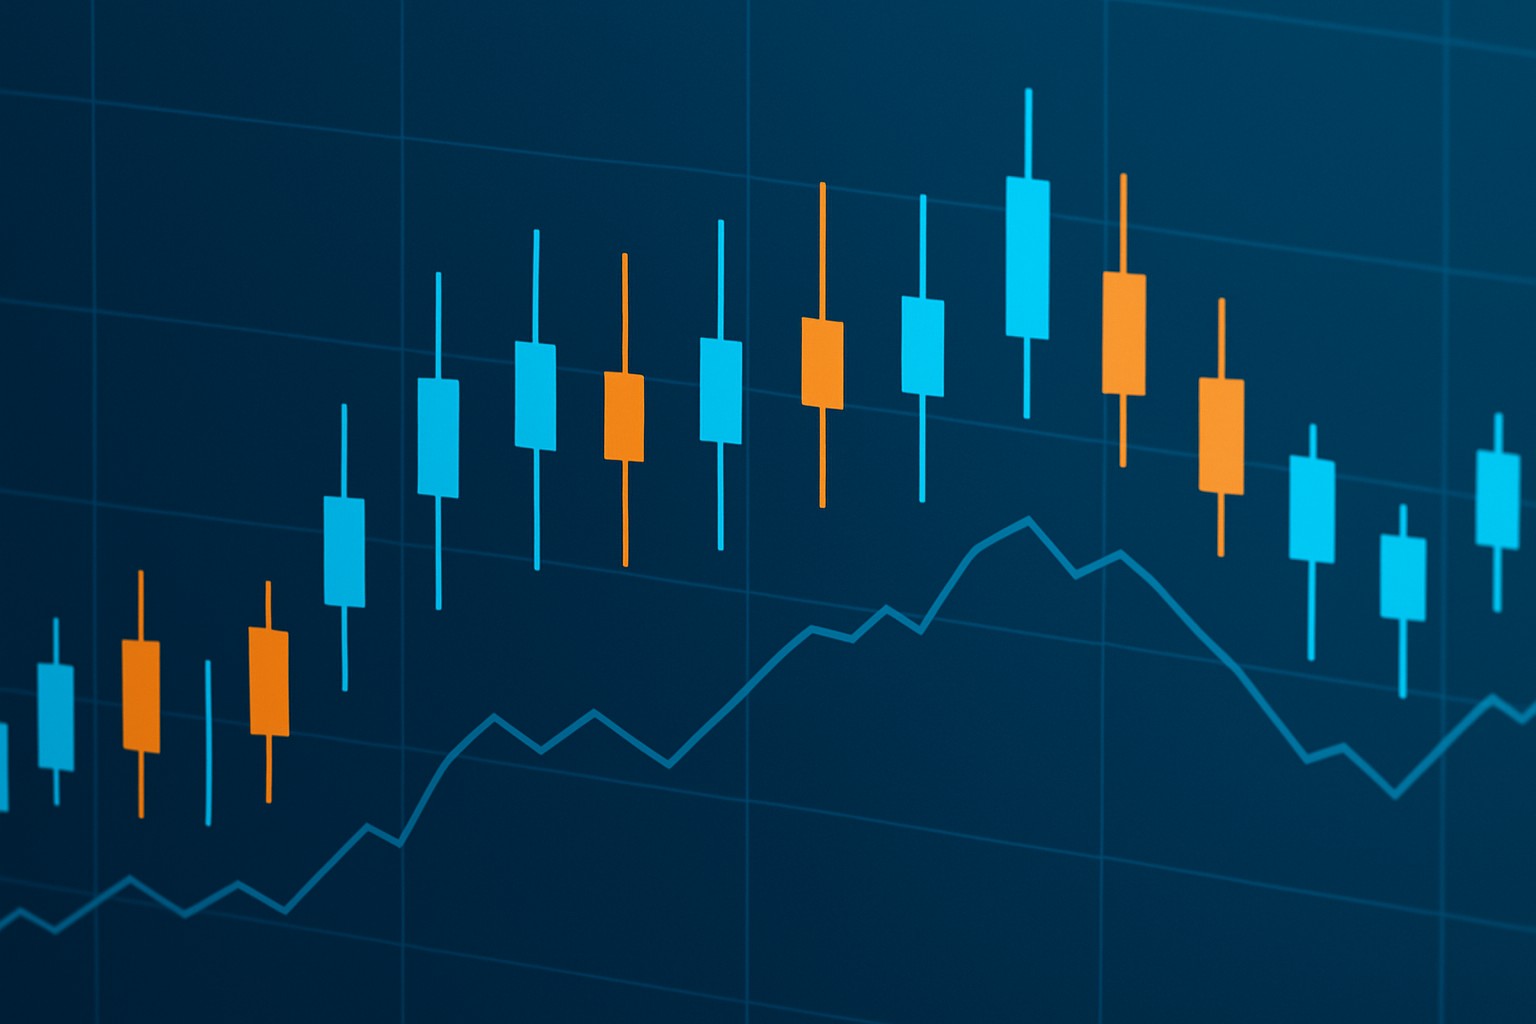
A spinning top candlestick shows a small real body nestled somewhere near the middle of the high and low price range, accompanied by long upper and lower shadows. This pattern tells a story: the opening and closing prices ended up pretty close to each other, signaling only a tiny net change despite what might have been quite a rollercoaster ride in price throughout the session.

Example of a spinning top candlestick pattern displaying small body and long shadows indicating market indecision.
The spinning top candlestick captures a telling moment of hesitation where buyers and sellers wrestle to steer prices their way but neither gains control. It’s like a tug-of-war with the market price bobbing above and below the opening price before finally settling close to it. These candles tend to appear after strong market moves, signaling a breather as traders take a step back and reassess momentum or brace themselves for what’s coming next.
The spinning top is kind of like a seesaw out there in the marketplace. It captures that fleeting moment when neither bulls nor bears have the upper hand, leaving everyone scratching their heads as to which way things will swing next.
When it comes to reading the market’s mood, spinning tops can be surprisingly insightful. These little candlesticks, with their short bodies and long shadows, might look like just another shape on the chart, but they speak volumes if you know how to listen. They often hint at a tug-of-war between buyers and sellers, a kind of market hesitation that traders can’t afford to overlook. In my experience, catching these subtle pauses can be the difference between jumping in too early or holding your nerve for the right moment. So, while they might seem modest at first glance, spinning tops have their quiet but important role in the grand drama of trading.
Spinning top patterns are worth watching since they often hint at possible turning points in the market or signal a pause in the current trend's momentum. Traders tend to focus on these candles because they often appear right before reversals or times when prices begin moving sideways. After a strong rally a spinning top might suggest that buying enthusiasm is starting to wane. This nudges cautious traders to prepare for a potential pullback or a trend shift.
Spinning tops often signal a bit of indecision in the market, hinting that the current trend could be running out of steam.
They tend to act as early heads-ups for potential trend reversals, especially when other indicators are singing the same tune.
Confirmation from volume data or momentum indicators makes these signals pack a bit more punch.
Incorporating spinning tops into your strategy can really help in managing risk by spotlighting those moments when the market is hesitating.
Catching these patterns can give you a leg up on timing your entries and exits—always a handy edge in trading.
Spinning top candlesticks can appear in any market or timeframe but how you interpret them depends on the surrounding context. You’ll want to watch the recent market trend and key support or resistance levels when these show up in stocks, forex or cryptocurrency. A spinning top appearing after a long uptrend or downtrend usually packs more punch than one during a sideways consolidation phase.
It’s easy to get tripped up by spinning top candlestick patterns—they might look simple, but there’s more to them than meets the eye. Many traders jump to conclusions without giving these little guys their due, often missing the subtle hints they’re trying to send. In my experience, spinning tops are like the poker face of the candlestick world not giving away too much yet quietly signaling that indecision or a potential shift might be brewing. So before you write them off or overhype them, it’s worth unpacking these misunderstandings and seeing what these patterns really have to say.
Spinning tops can be handy little clues but I have noticed that many traders often misread their signals. Not every spinning top is waving a flag for a reversal so it is really key not to put all your eggs in that one basket without considering other market factors. Some traders get hung up on the candle color or assume these patterns behave the same across every timeframe which rarely pans out.
Using spinning tops in your trading strategy requires patience and a wide view of the market. It’s vital to hold your horses and wait for confirmation from other technical indicators like volume or moving averages before jumping on a single spinning top candle.
Clearly spot the spinning top candlestick by looking at the size of its real body compared to the shadows it casts. It is like the candlestick's little outfit telling you a story.
Take a step back and consider the overall trend or market situation leading up to that moment so you can better understand what the pattern might be hinting at.
Take the pattern at face value but look for support from volume spikes or RSI divergences and other technical signals that add strength.
When it’s time to enter, set your entry carefully and always include a stop-loss to protect yourself from false signals or unexpected market moves.
Stay alert during the trade by closely watching price action and be ready to adjust your stop-loss or exit points as the market changes.
| Trend Context | Signal Interpretation | Confirmation Indicators | Common Pitfalls | Suggested Action |
|---|---|---|---|---|
| Bullish Uptrend | The trend might be slowing down or just taking a well-earned breather | Falling volume, RSI showing divergence | Jumping in too soon without clear signals can feel tempting but often backfires | Hold off patiently until you get solid confirmation |
| Bearish Downtrend | The trend could be reversing or simply hitting a pause for breath | MACD crossover, volume picking up | Assuming every spinning top spells a reversal is a classic rookie mistake | Look for other indicators and volume to back up the story |
| Sideways Market | Market is still throwing up its hands, undecided and consolidating | Volatility narrows | Trading without zooming out to see the bigger picture can lead you astray | Treat spinning tops as helpful hints, not hard-and-fast orders |
| Near Support Level | Price might bounce or pull a U-turn right here | Confirmation from price action or a surge in volume | Relying solely on the pattern without the bigger context can trip you up | Double-check the strength of support or hunt for reversal candles |
| Near Resistance Level | Price might hit a wall or lose a bit of steam | Bearish engulfing pattern or volume spike | Overtrading just because you spot a single spinning top is a slippery slope | Combine with resistance breakdowns or other confirmations to be safer |

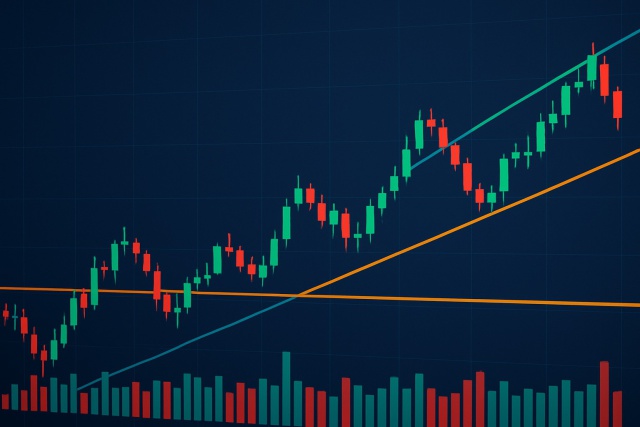
Chart contrasting spinning top signals in bullish and bearish trend contexts with insights on interpretation and next steps.
On a daily stock chart right after a steady uptrend, a spinning top candlestick quietly appeared with falling volume—like the market was taking a hesitant breath as buyers seemed to lose some swagger. The next day brought a bearish confirmation candle that set off a short-term pullback and reminded us that even the strongest trends can hit a snag. In the crypto world, this spinning top pattern showed up near an important support level just before prices bounced back. This shows that paying attention to the spinning top candlestick and volume can really clear things up.

Tired of missing opportunities and making suboptimal trading decisions? TrendSpider's cutting-edge platform automates complex technical analysis, saving you time and reducing human error.
With multi-timeframe analysis, dynamic alerts, backtesting, and customizable charting, you'll gain a competitive edge in identifying trends and making informed trades across global markets.

Driven by a passion for democratizing trading knowledge, she focuses on behavioral finance and psychological aspects of market decision-making.
Read PostsMaster the momentum indicator to gauge price speed and trend strength. This ultimate guide covers ca...

Hidden bullish divergence is a key technical indicator revealing strong buying pressure beneath unce...
Trend lines are essential tools in technical analysis that help traders identify market direction an...

Learn how the True Range indicator captures market volatility and price swings, empowering traders t...