


Technical Analysis
Momentum Indicator Basics for Traders
Master the momentum indicator to gauge price speed and trend strength. This ultimate guide covers ca...
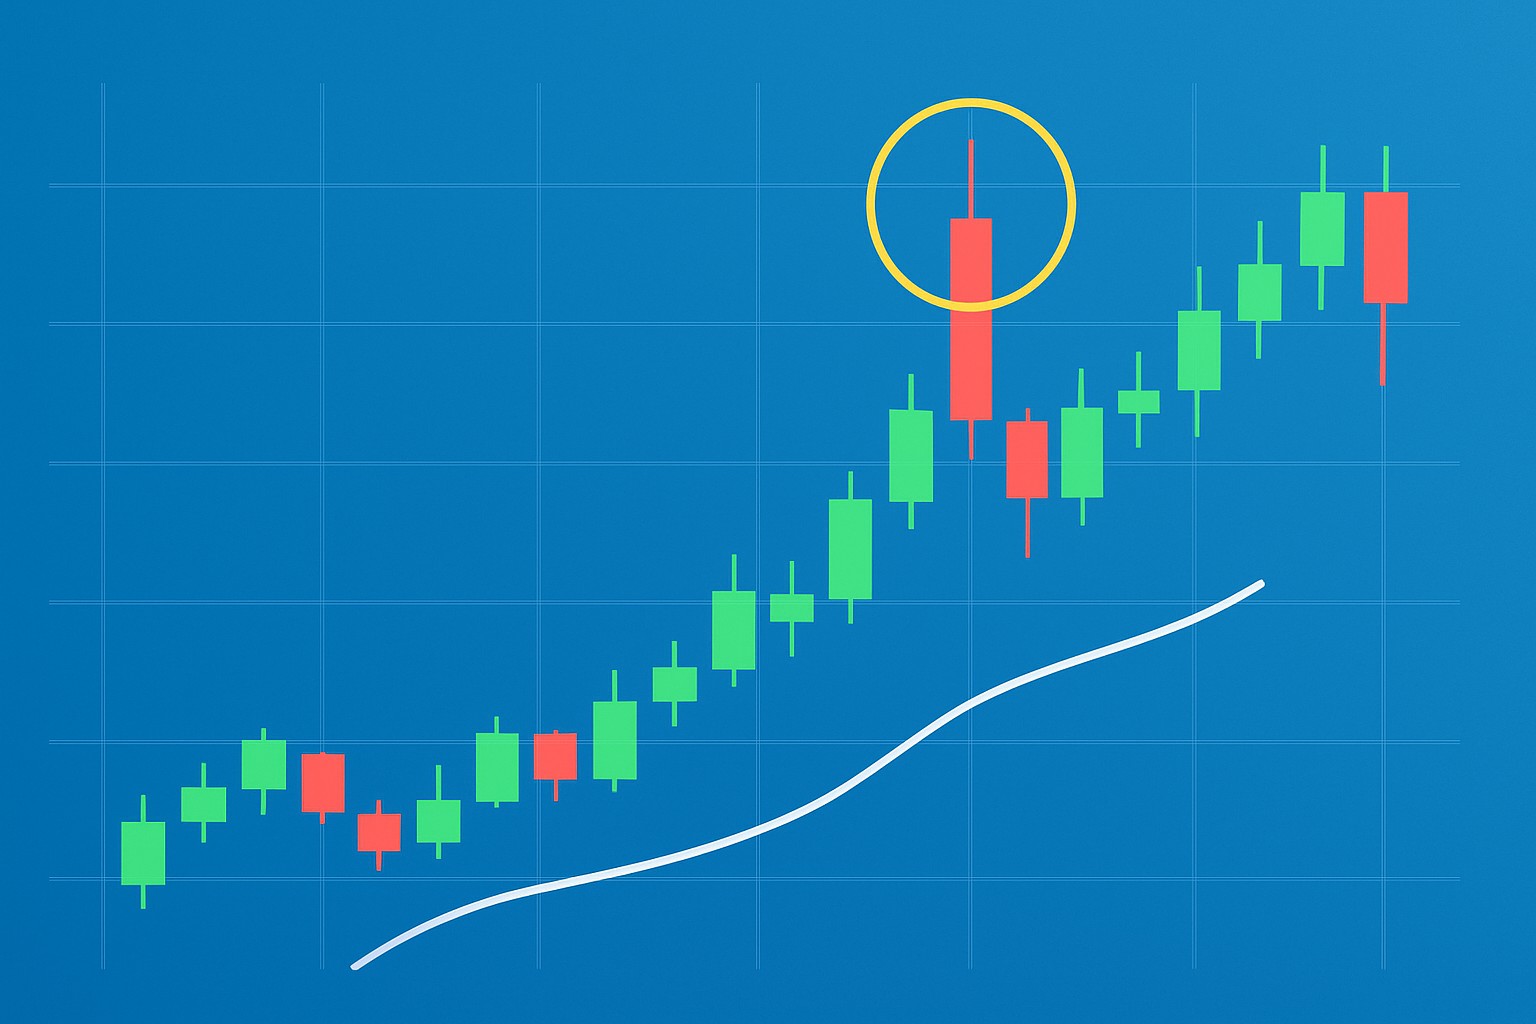
The shooting star candle formation is a classic candlestick pattern in technical analysis that often signals a potential reversal during an uptrend.
Candlestick charts lay out price movements over a certain period and are an indispensable tool for traders and investors alike. They capture the open, high, low and close prices, giving you a quick snapshot of market mood.
A shooting star candle pattern typically appears during an uptrend. You will notice it has a small real body near the bottom of the candle with a long upper wick at least twice as long as the body and barely any lower wick.
The shooting star is like a little drama on the charts showing that buyers made a strong bid to lift prices higher during the session. In the end, sellers had the final say and pushed prices back down near where they started. This kind of rejection of higher prices often sets the stage for a bearish reversal, especially if the candles that follow back it up.

Visual representation of a shooting star candle formation alongside a regular candlestick for comparison
Candlestick charting was born way back in 18th century Japan, crafted by rice traders who were itching for a smarter way to get the pulse of market sentiment and price swings. The shooting star pattern tells a story of a real tug-of-war playing out in a trading session: buyers kick things off by pushing the price up sharply, only for sellers to crash the party and slam it back down.
The shooting star candle really captures that tug of war between bullish excitement and bearish resistance, boiling down a complex market mood into a straightforward, eye-opening snapshot.
Identifying a shooting star candle involves more than just looking at its shape. You also need to consider the context and size. Traders who pay close attention to market trends and the candle’s proportions usually recognize genuine signals instead of getting lost in background noise.
Make sure the market is clearly in an uptrend or rally before that candle shows up—no point jumping the gun.
Spot a small real body near the low price of the candle's time frame which usually hints at limited upward movement like the bulls are running out of steam.
Keep an eye out for a long upper shadow at least twice as long as the real body. Think of it as the market poking its head up but getting pushed back down.
The lower shadow should be barely there or missing to give that bearish signal extra punch.
If you can, check for higher trading volume during the shooting star candle. More traders jumping in often means the signal’s packing more heat.
Be patient and wait for a confirmation candle in the next period—usually a bearish one that closes below the shooting star’s body—to seal the deal.
Using multiple timeframes often gives a nice boost to your accuracy when spotting shooting star candles. For instance, an intraday shooting star usually packs more punch if it happens to line up with a bearish signal on the daily chart—kind of like getting a double nod from the market. Platforms like TradingView come to the rescue here, offering solid charting tools and customizable indicators that make it a lot easier to catch and confirm these patterns across various timeframes.
Many traders trip up on shooting star candles by glossing over key details like the prior trend or the length of the wicks and the need for confirmation. Confusing them with inverted hammer patterns or focusing just on the candle’s color can lead to costly slip-ups.
Patience is the name of the game when it comes to handling shooting star candles. Instead of jumping the gun on trades it’s smarter to lean on other technical indicators like RSI or volume to double-check if a reversal might actually be brewing. Tools like TrendSpider come in handy here — they offer automated pattern recognition and real-time alerts that help traders dodge premature signals.
Traders often throw shooting star candle signals into the mix as part of a bigger game plan. They usually pair them with trusty support and resistance levels, momentum indicators and a good look at volume analysis. This well-rounded approach tends to boost the reliability of trading decisions.
If a trader spots a shooting star followed by a bearish confirmation candle near a resistance zone, they might just decide to jump into a short position. Usually, they’d tuck in a tight stop-loss just above the wick—playing it safe—and aim to exit around a previous support level. This little dance helps lock in profits while keeping risk firmly in check.

Annotated chart showing entry and stop-loss placement following a shooting star formation
The shooting star candle is often a pretty strong indicator though it’s far from foolproof. It can throw out false signals especially during times of low liquidity in those frustratingly choppy sideways markets or when the volume just doesn’t seem to support the bearish reversal.
Combining shooting star candle formation analysis with other reliable indicators and tools often proves to be the key to effective trading. Platforms like TradingView and TrendSpider offer more than just charts. They provide advanced pattern spotting and useful alerts to help traders build smarter and more well-rounded strategies.

Are you tired of juggling multiple tools for your trading needs? TradingView is the all-in-one platform that streamlines your analysis and decision-making.
With its powerful charting capabilities, real-time data, and vibrant community, TradingView empowers traders like you to stay ahead of the market. Join thousands who trust TradingView for their trading success.

Driven by a passion for democratizing financial markets, Vivienne creates educational content on forex trading and currency market fundamentals for beginners.
Read PostsMaster the momentum indicator to gauge price speed and trend strength. This ultimate guide covers ca...

Hidden bullish divergence is a key technical indicator revealing strong buying pressure beneath unce...

Discover the wedge falling pattern's secrets and learn step-by-step how to trade this powerful techn...

Learn how the True Range indicator captures market volatility and price swings, empowering traders t...